Simple Linear Regressions
Time Series Analysis in Python

Rob Reider
Adjunct Professor, NYU-Courant Consultant, Quantopian
What is a Regression?
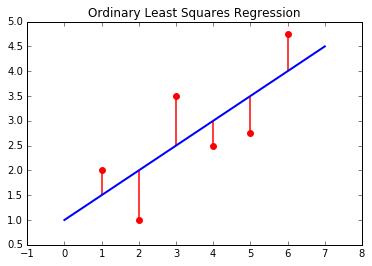
- Ordinary Least Squares (OLS)
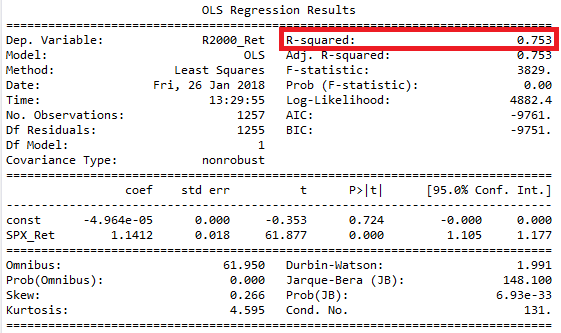
Regression Example (continued)
- Regression output

- Intercept in
results.params[0] - Slope in
results.params[1]
Regression Example (continued)
- Regression output