Introdução aos gráficos e subgráficos relacionais
Introdução à Visualização de Dados com o Seaborn

Content Team
DataCamp
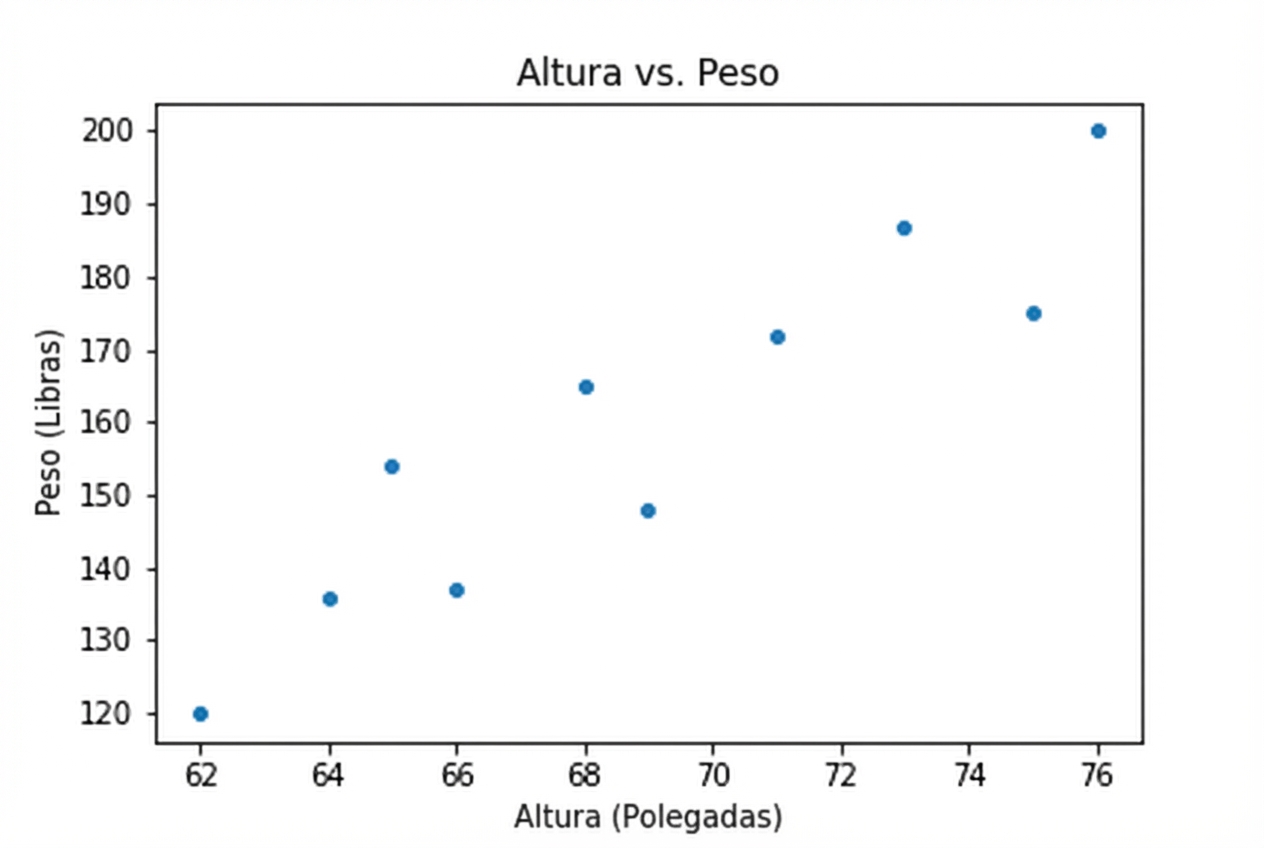
Perguntas sobre variáveis quantitativas
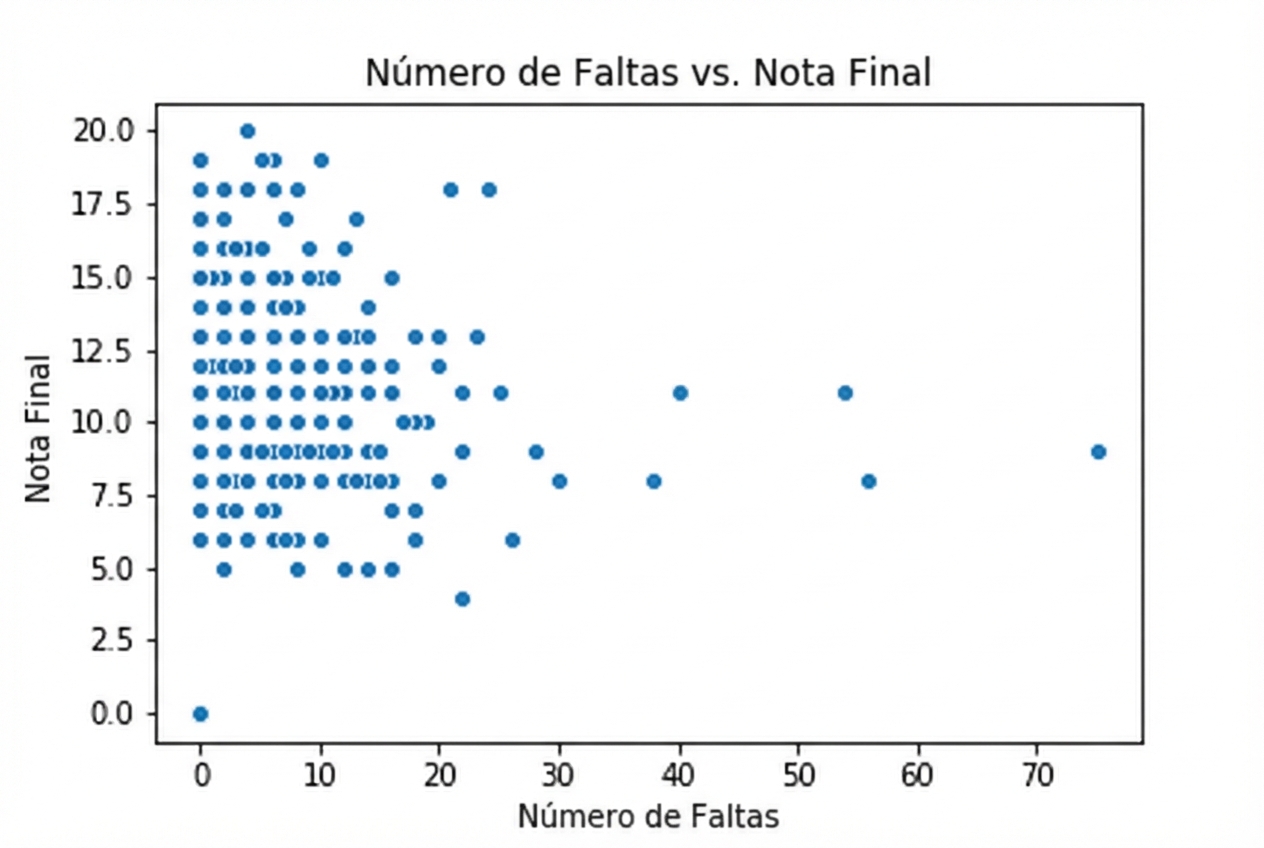
Perguntas sobre variáveis quantitativas
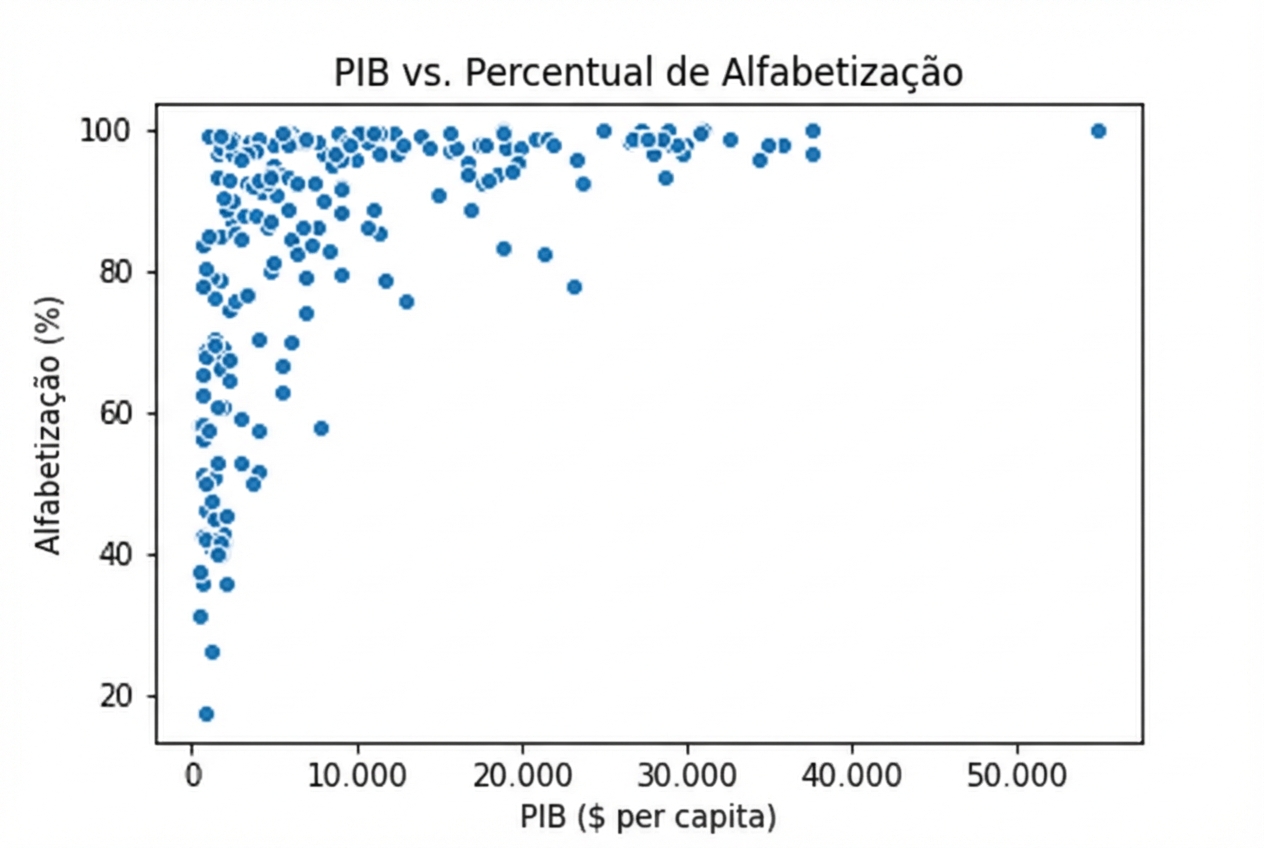
Perguntas sobre variáveis quantitativas
1 Waskom, M. L. (2021). seaborn: statistical data visualization. https://seaborn.pydata.org/
1 Waskom, M. L. (2021). seaborn: statistical data visualization. https://seaborn.pydata.org/
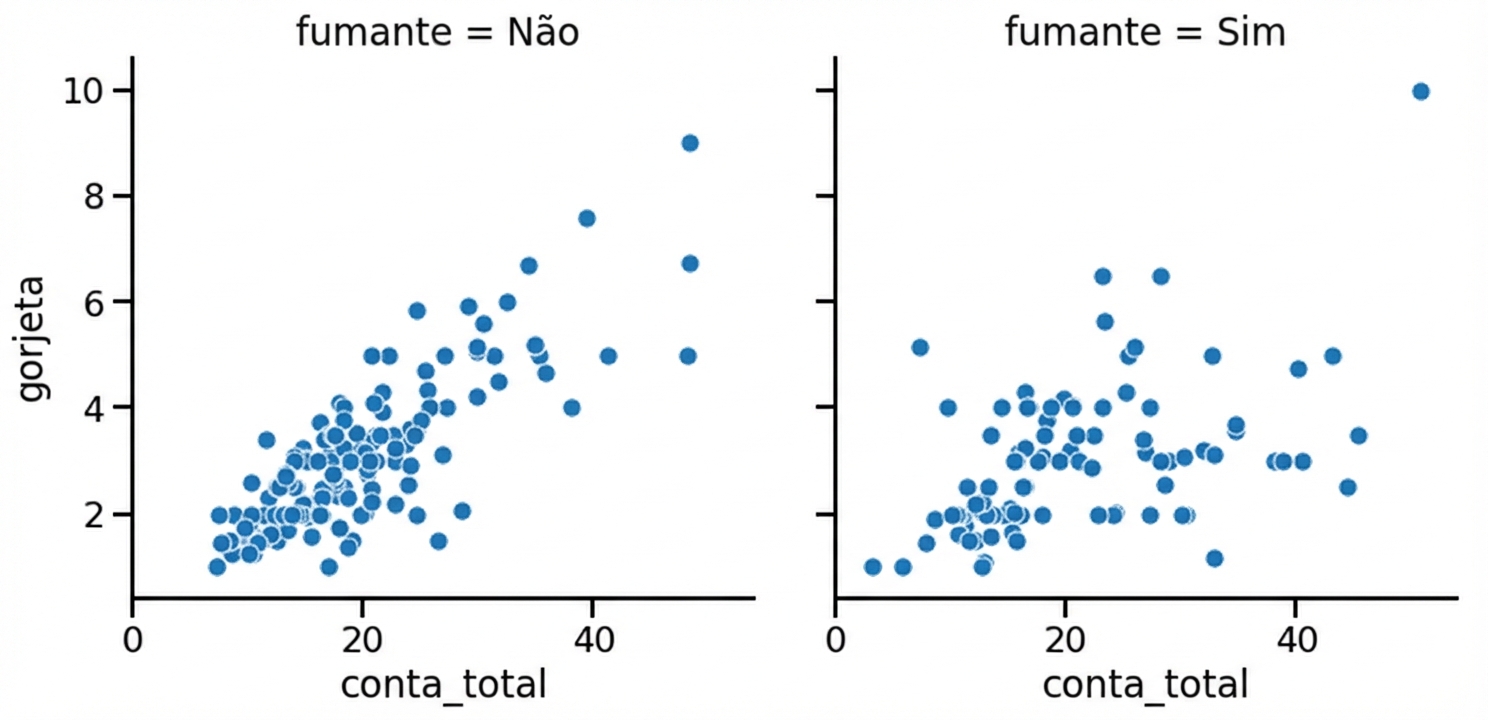
Subgráficos em colunas
1 Waskom, M. L. (2021). seaborn: statistical data visualization. https://seaborn.pydata.org/
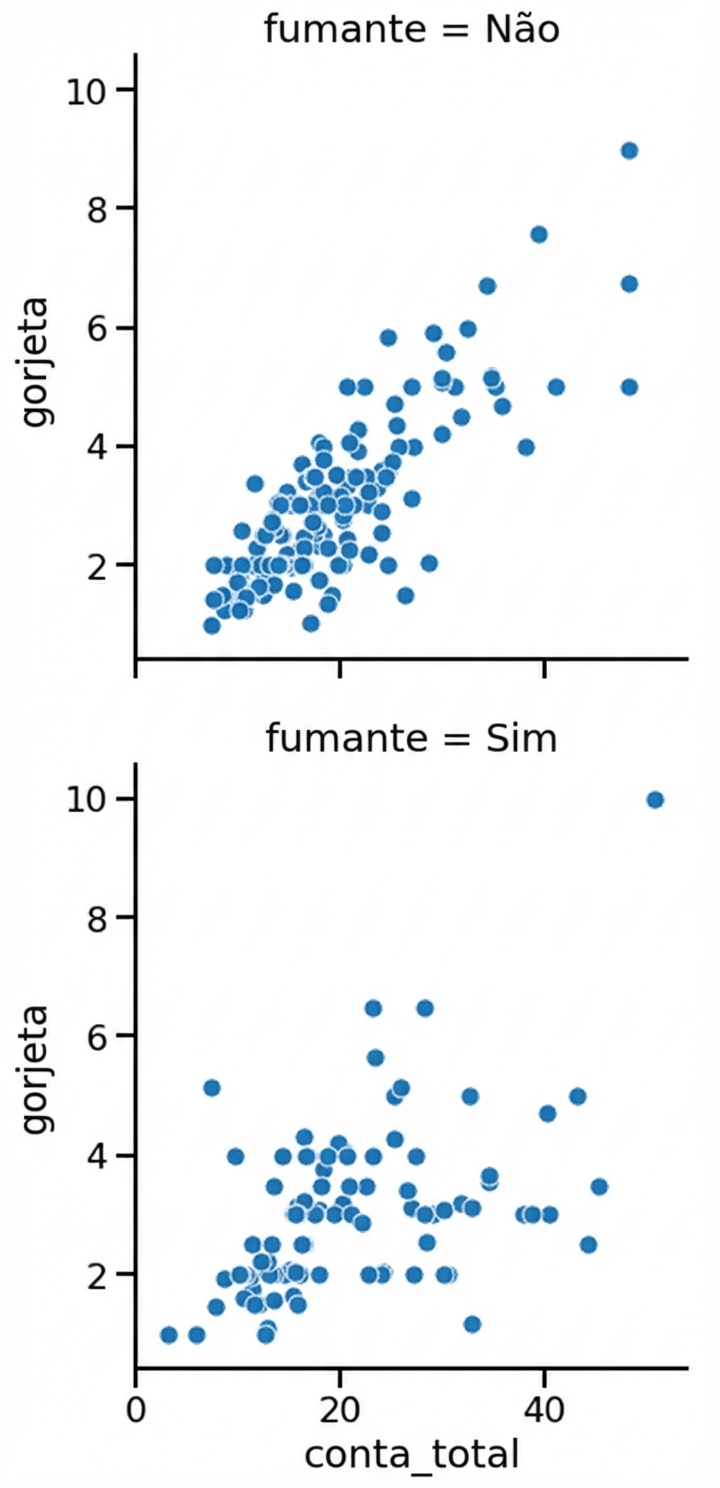
Subgráficos em linhas
1 Waskom, M. L. (2021). seaborn: statistical data visualization. https://seaborn.pydata.org/
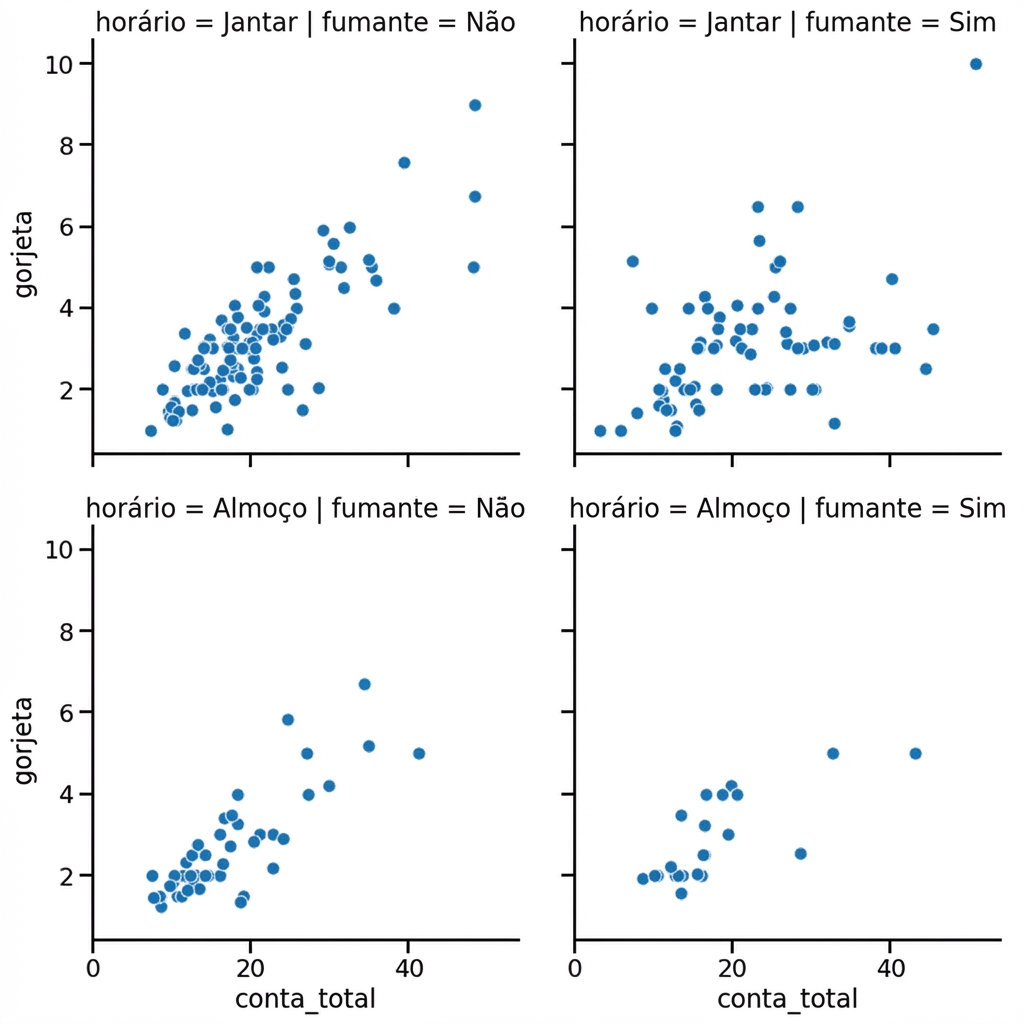
Subgráficos em linhas e colunas
1 Waskom, M. L. (2021). seaborn: statistical data visualization. https://seaborn.pydata.org/
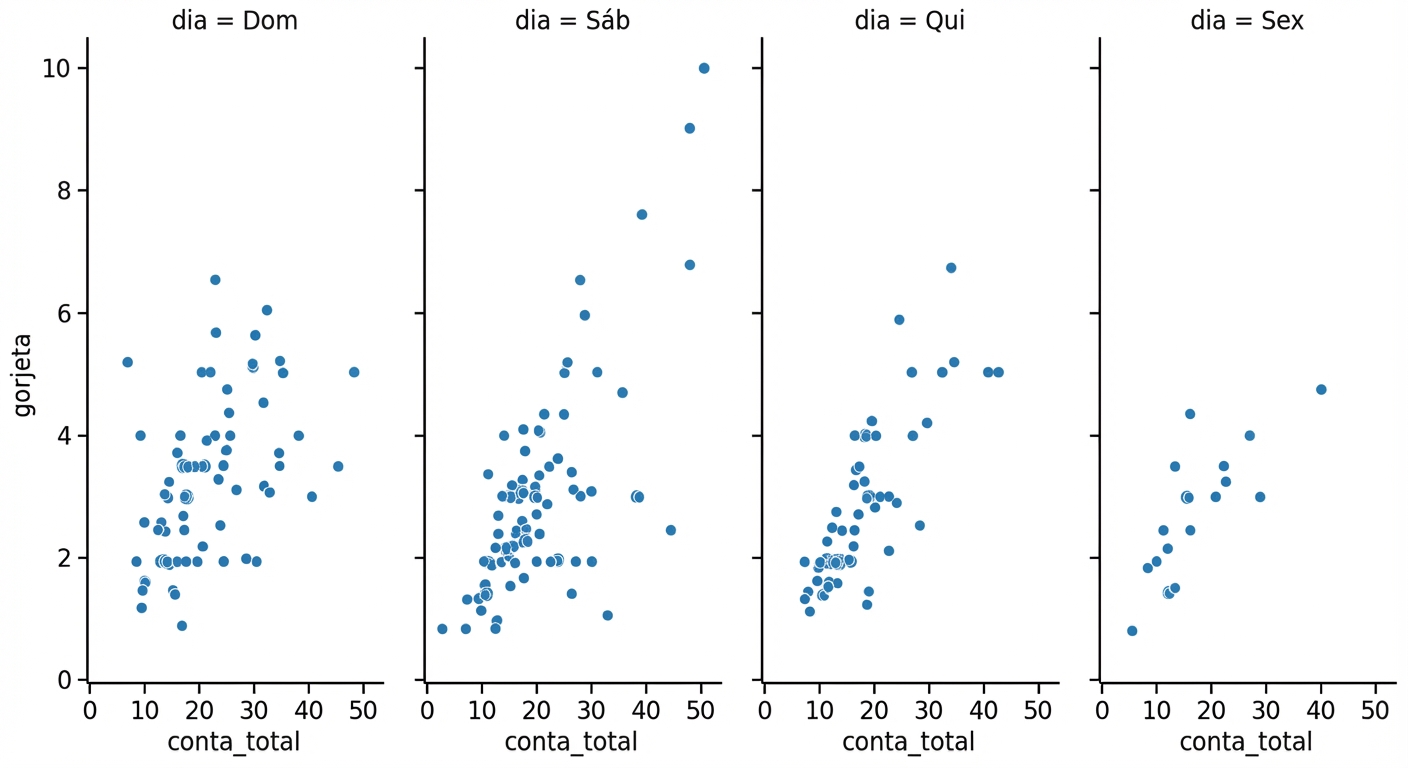
Subgrupos dos dias da semana
1 Waskom, M. L. (2021). seaborn: statistical data visualization. https://seaborn.pydata.org/
Wrapping de colunas
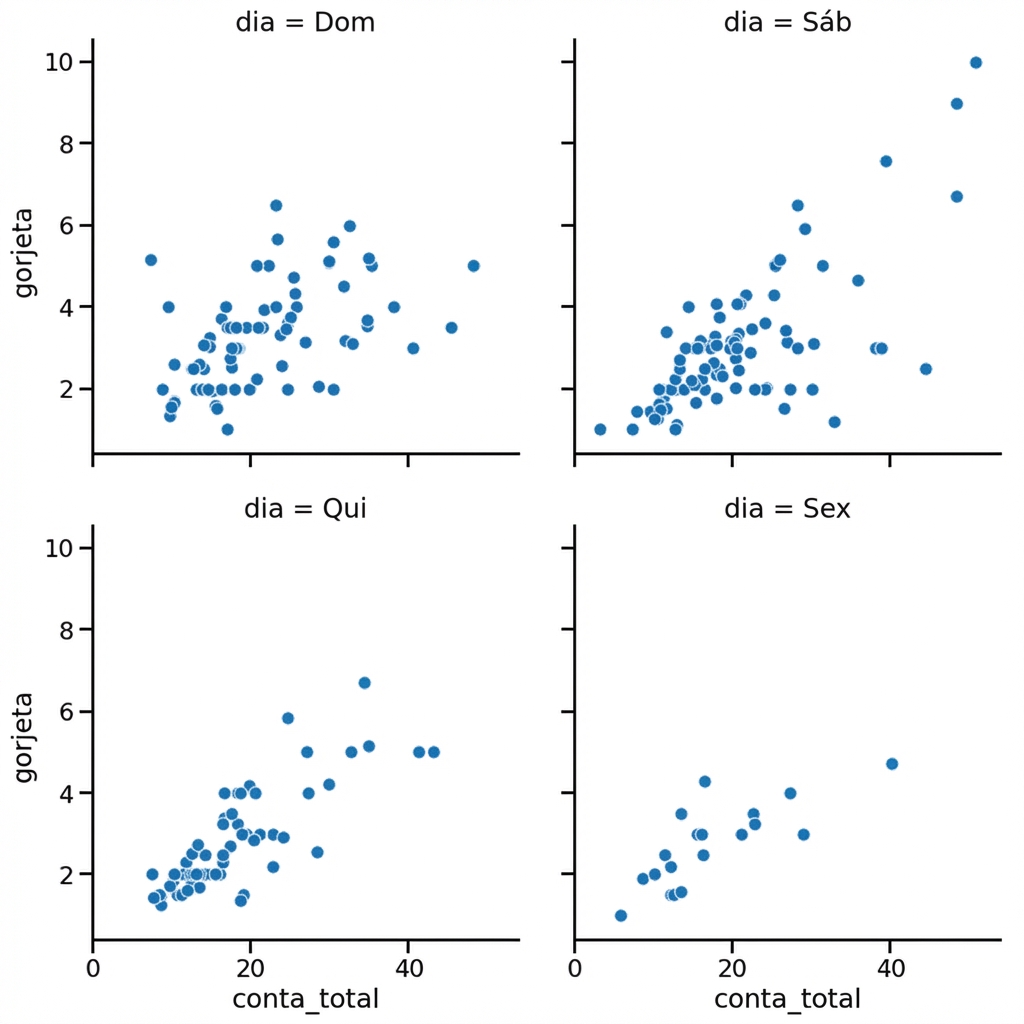
1 Waskom, M. L. (2021). seaborn: statistical data visualization. https://seaborn.pydata.org/
Como ordenar colunas
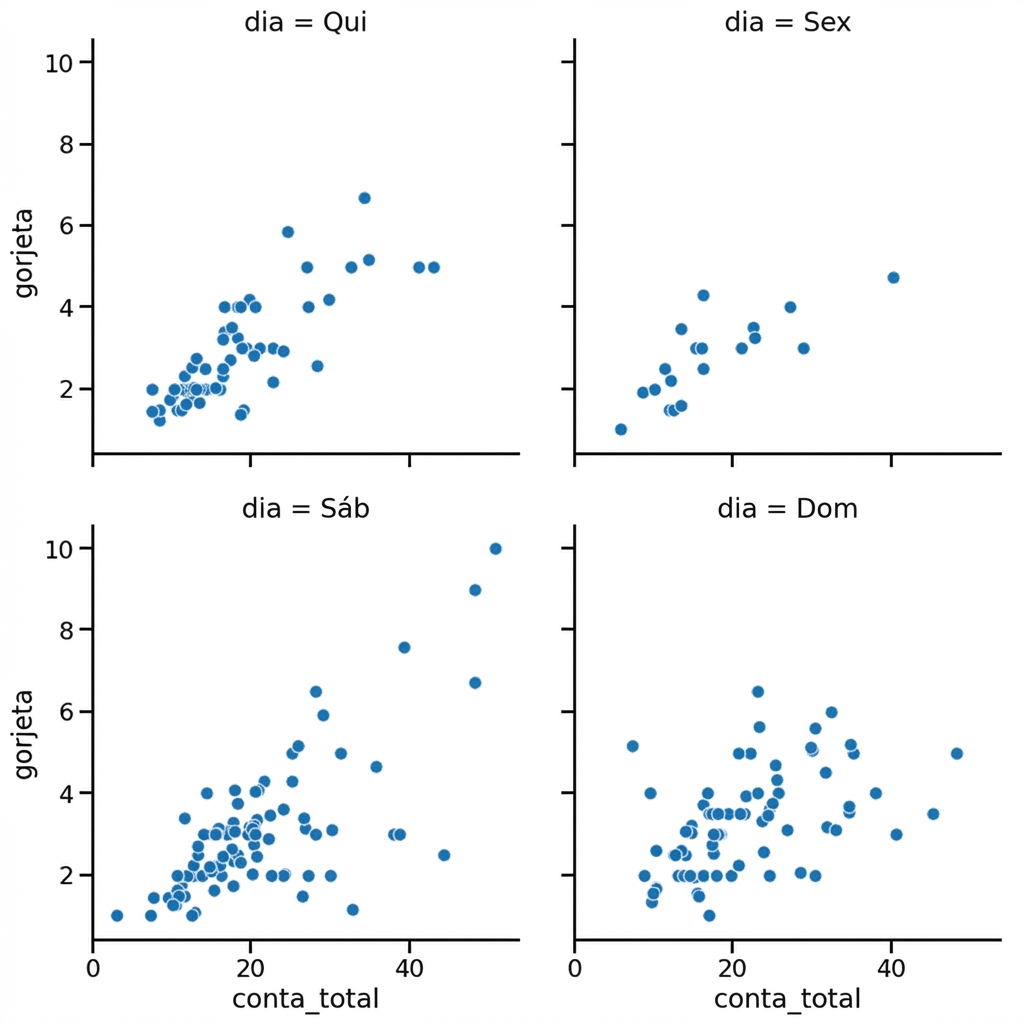
1 Waskom, M. L. (2021). seaborn: statistical data visualization. https://seaborn.pydata.org/

