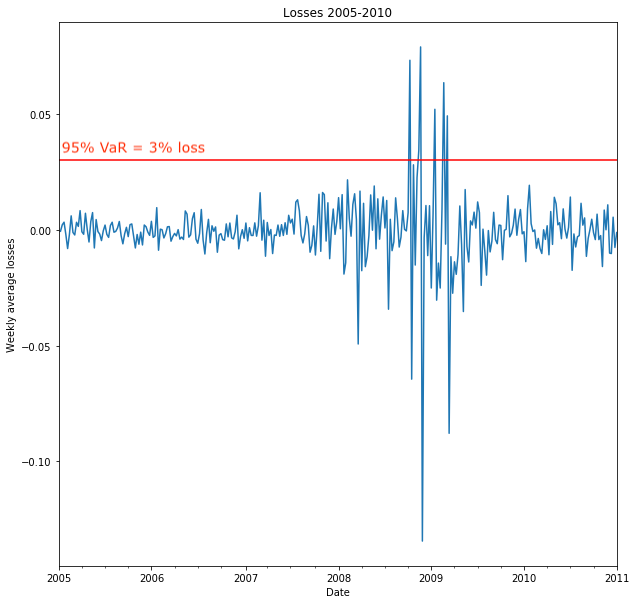
Volatility and extreme values
Quantitative Risk Management in Python

Jamsheed Shorish
Computational Economist
Chow test assumptions
Structural break indications
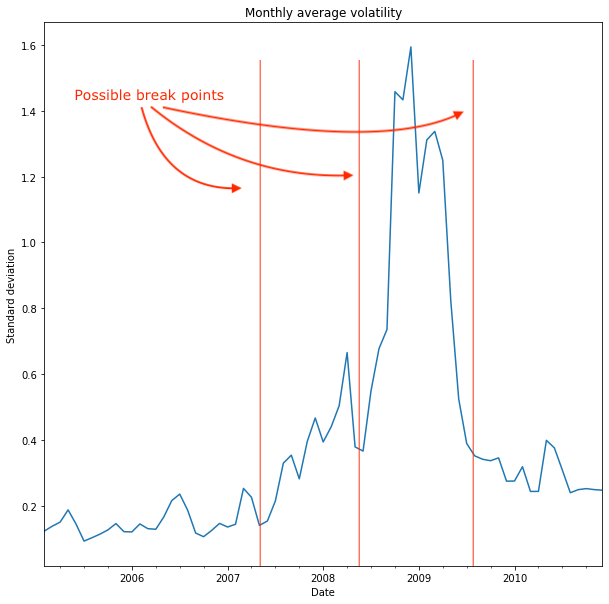
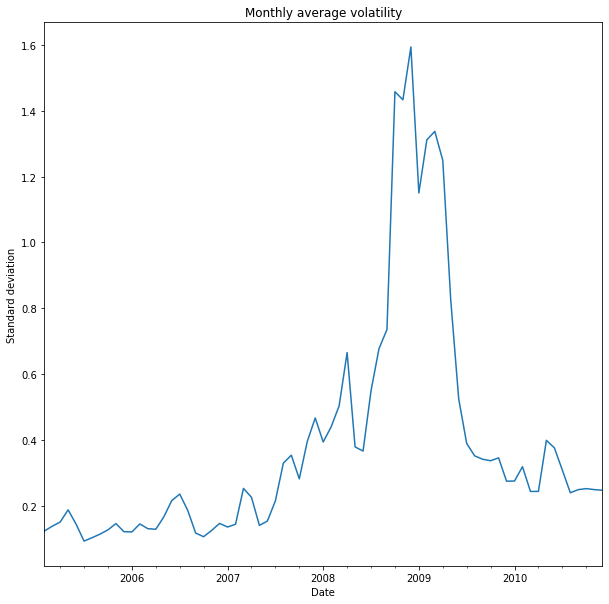
Rolling window volatility
import matplotlib.pyplot as plt
vol_mean.plot(
  title="Monthly average volatility"
).set_ylabel("Standard deviation")
plt.show()
Rolling window volatility
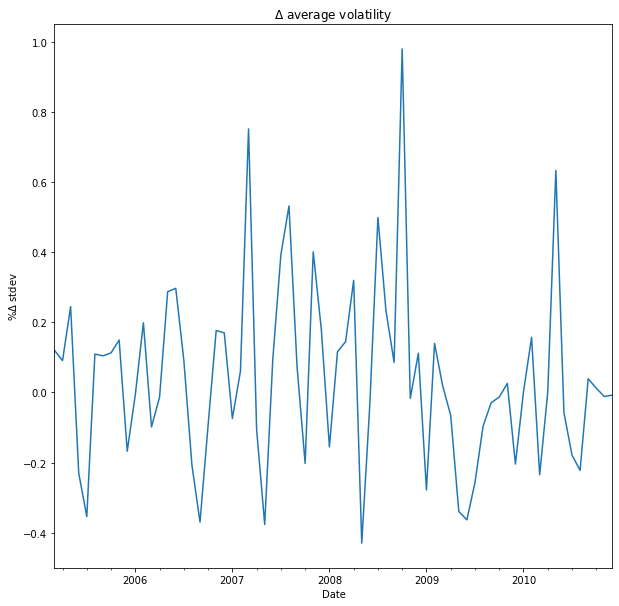
vol_mean.pct_change().plot(
  title="$\Delta$ average volatility"
).set_ylabel("% $\Delta$ stdev")
plt.show()
Backtesting