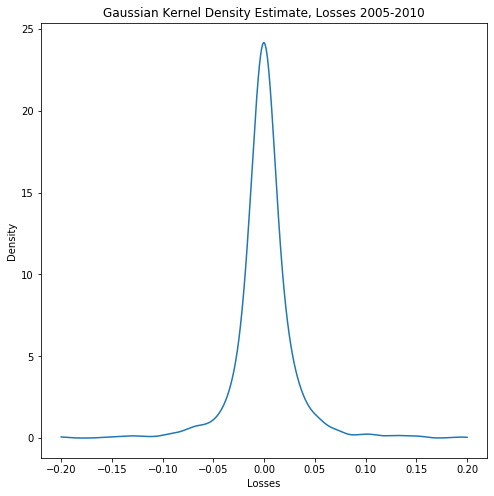
Kernel density estimation
Quantitative Risk Management in Python

Jamsheed Shorish
Computational Economist
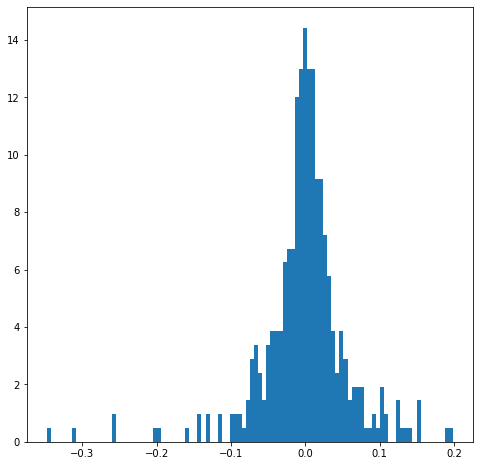
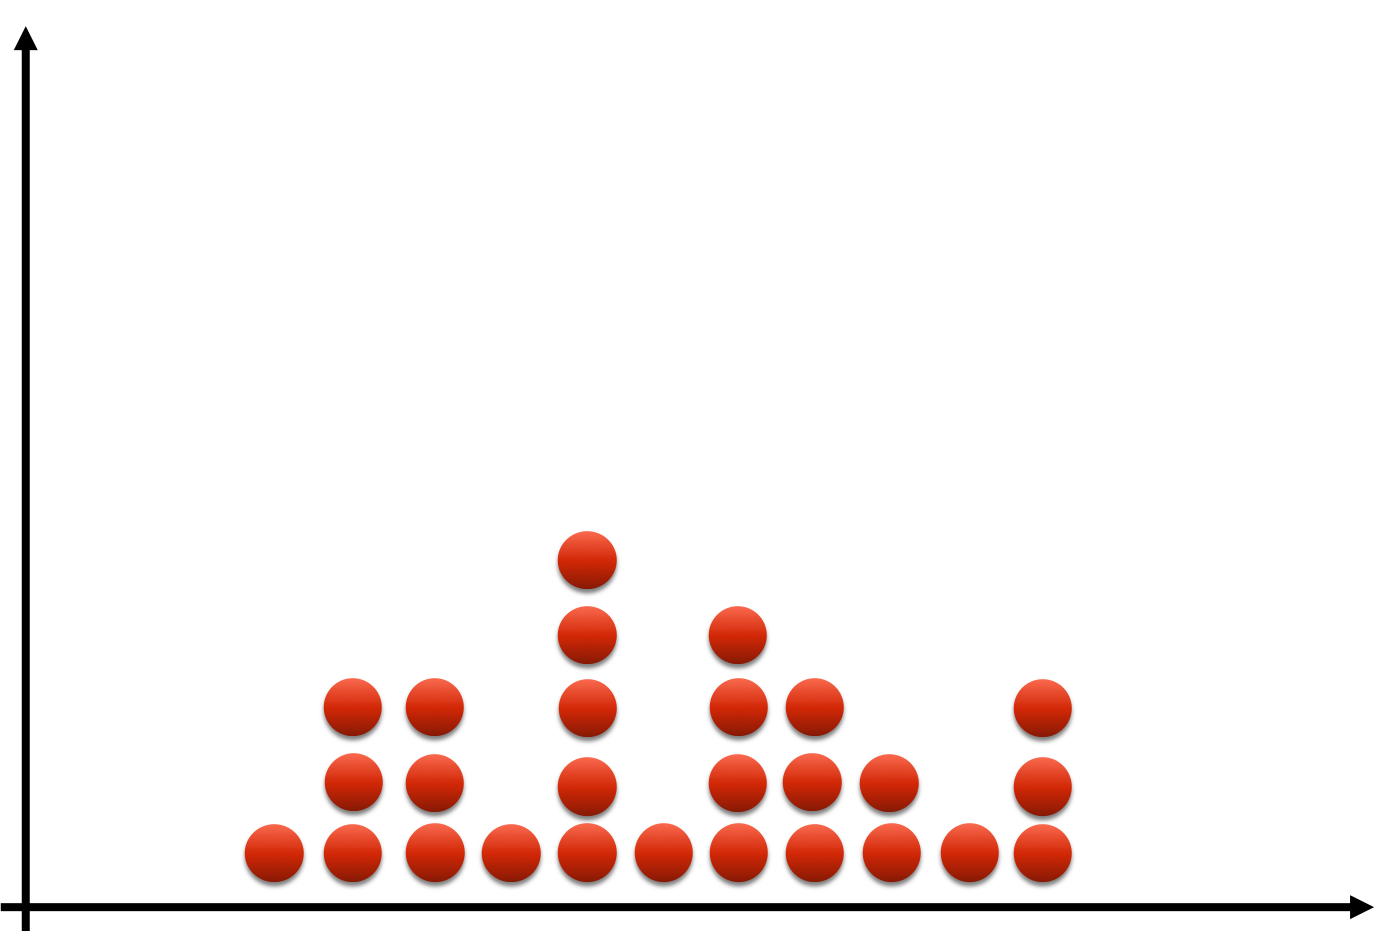
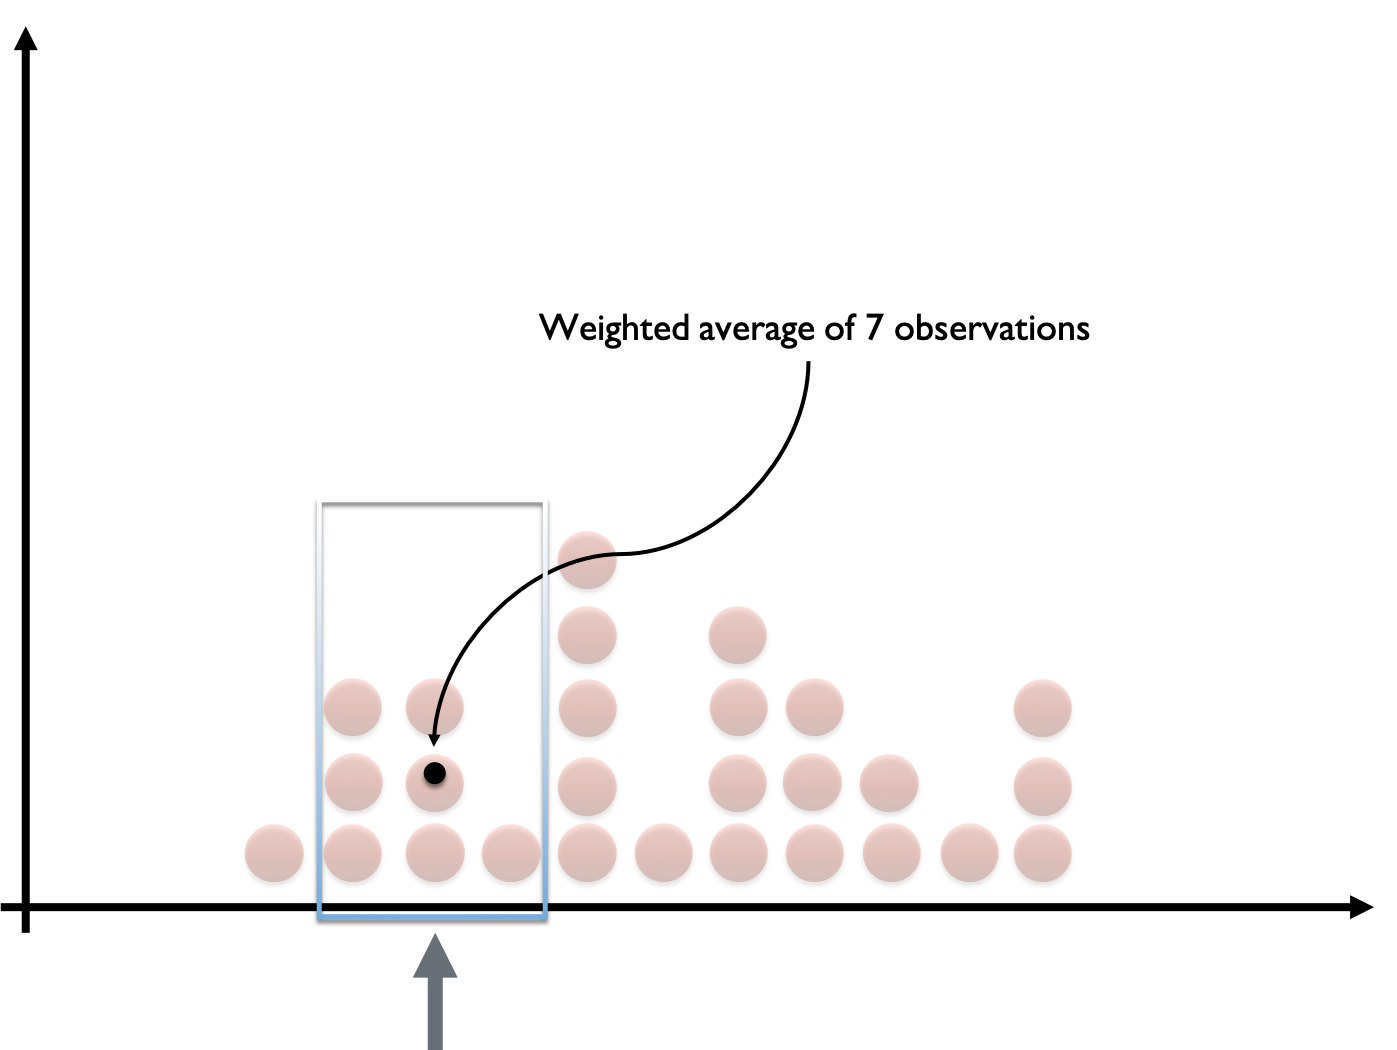
The histogram revisited
Data smoothing

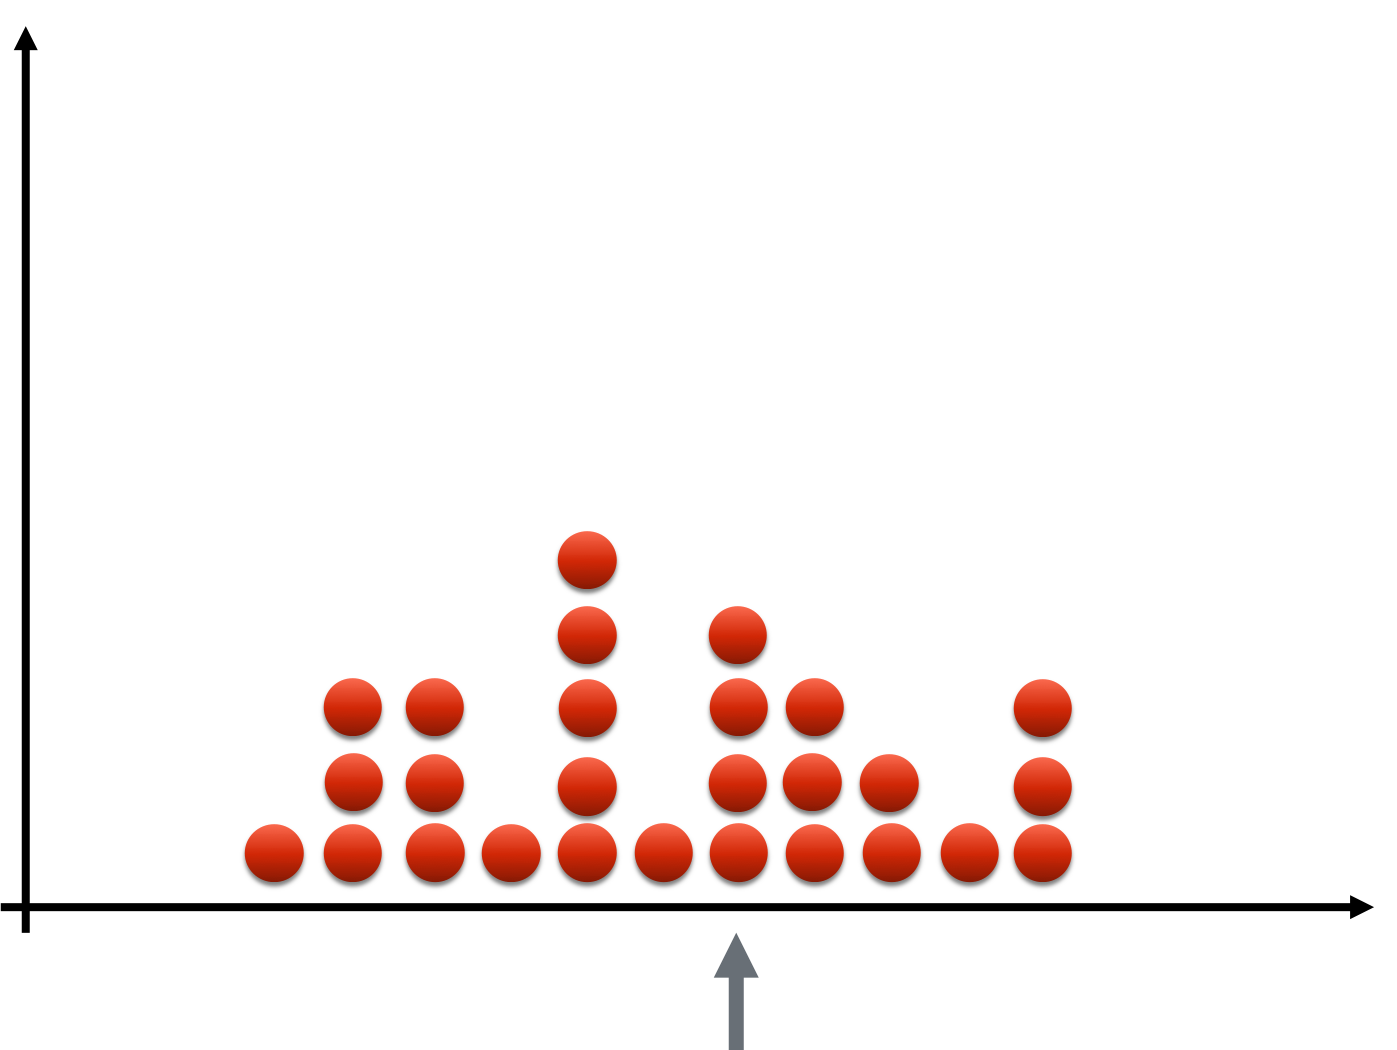
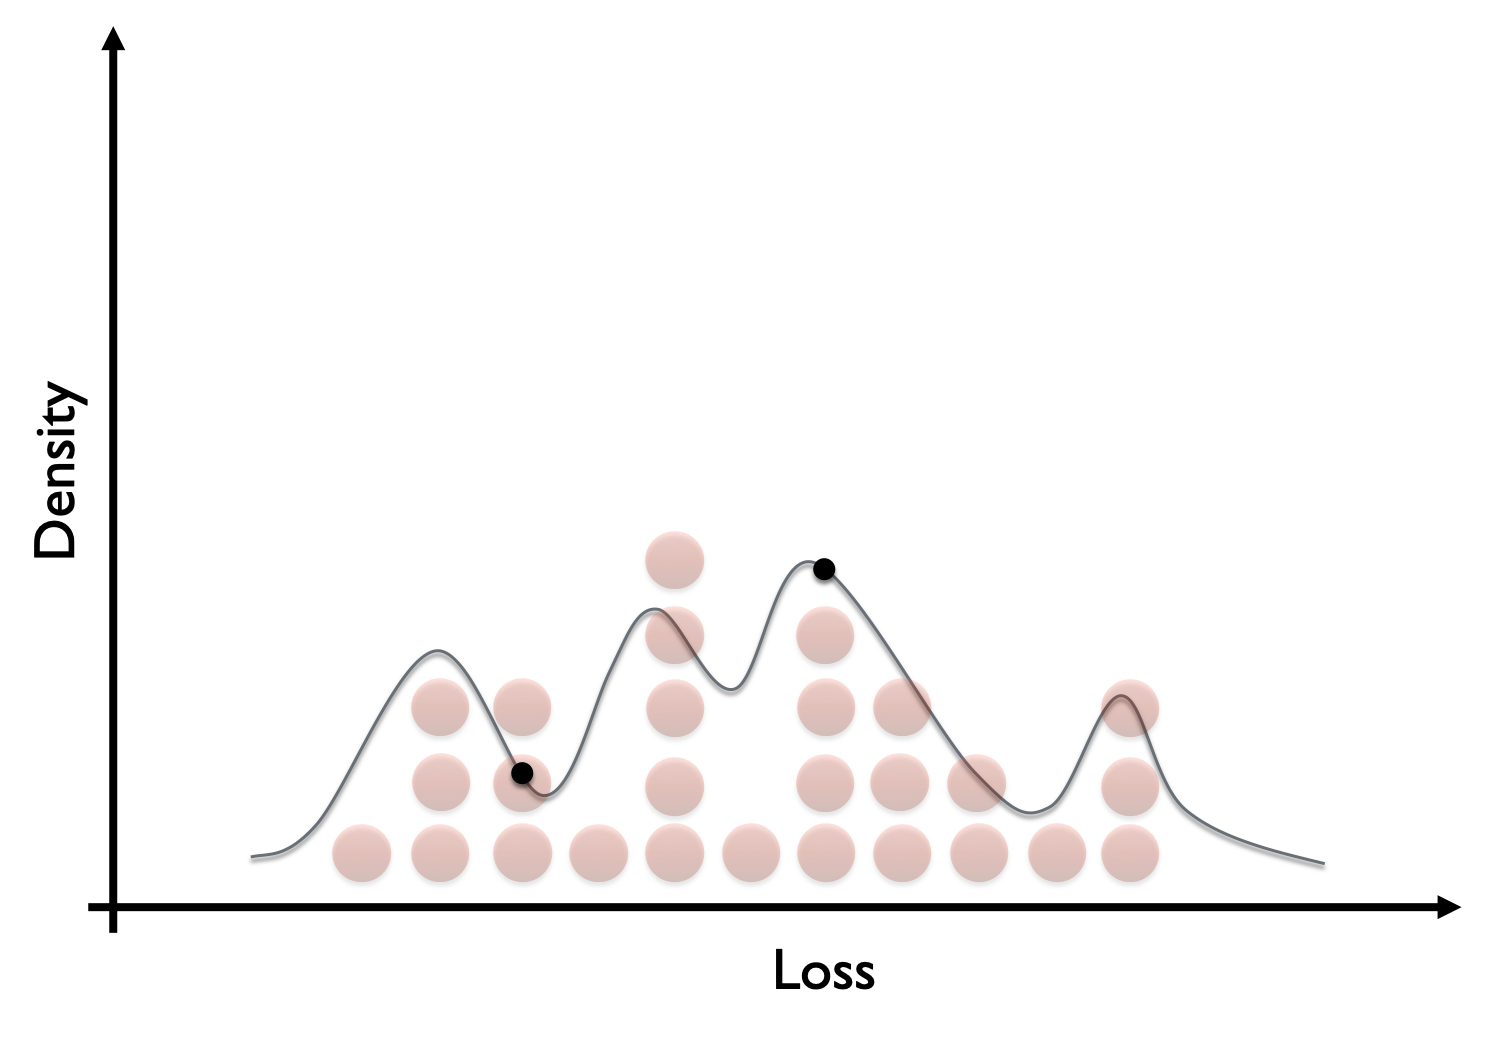
Data smoothing
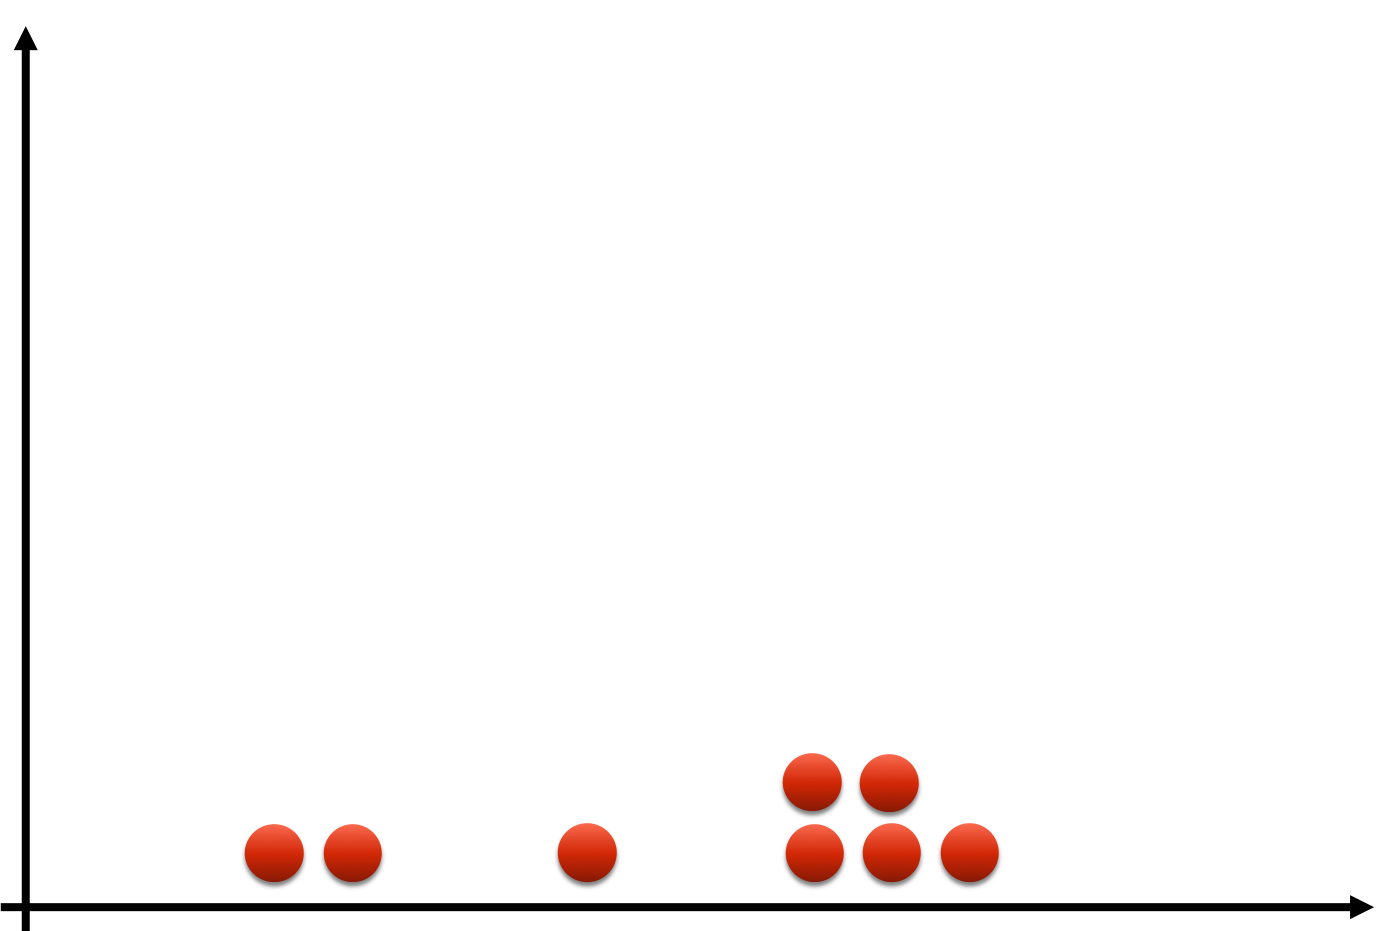
Data smoothing
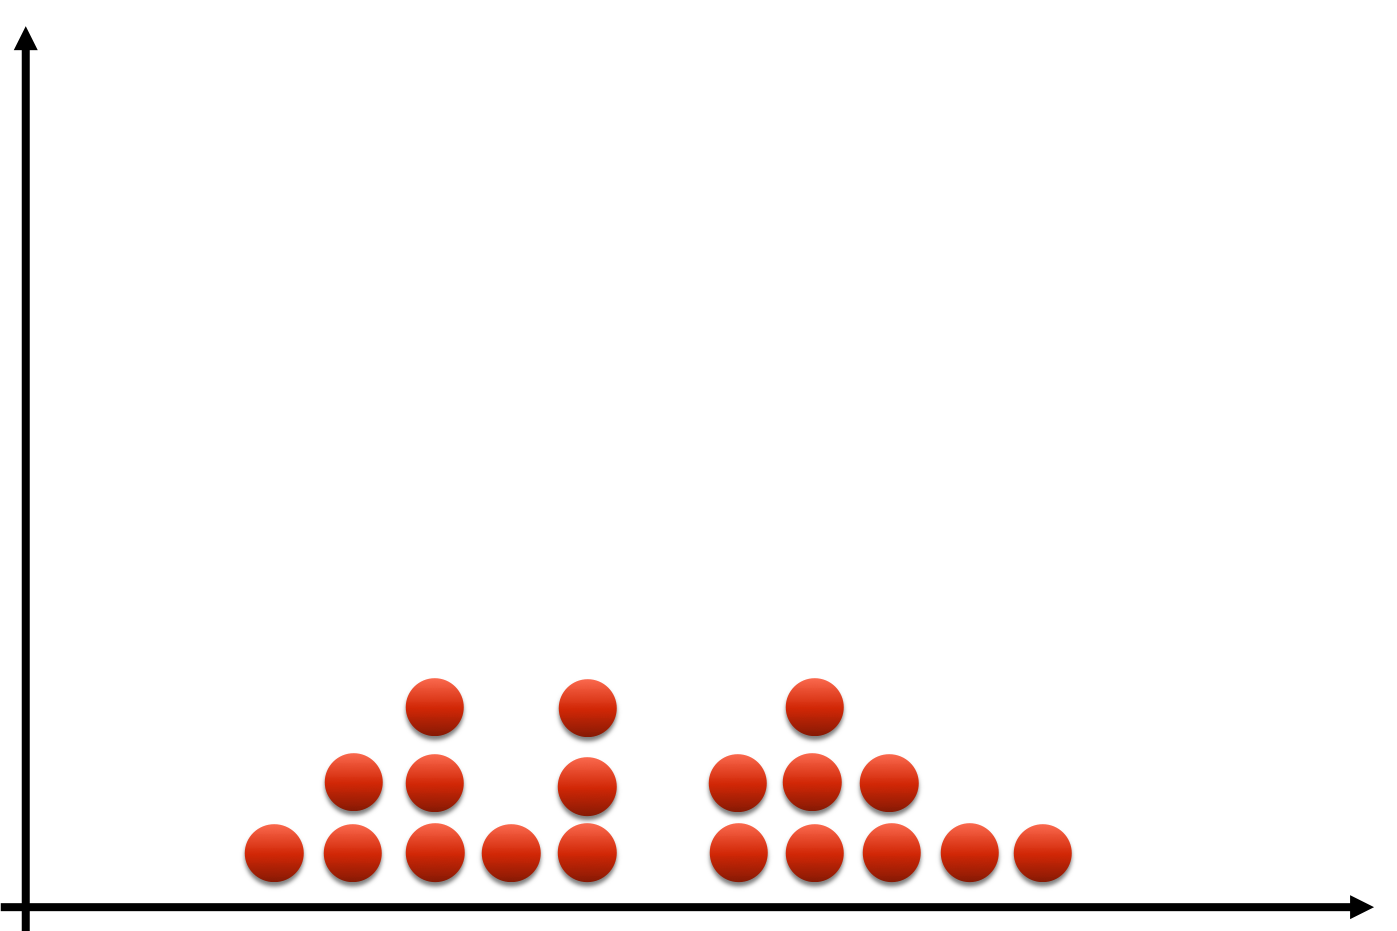
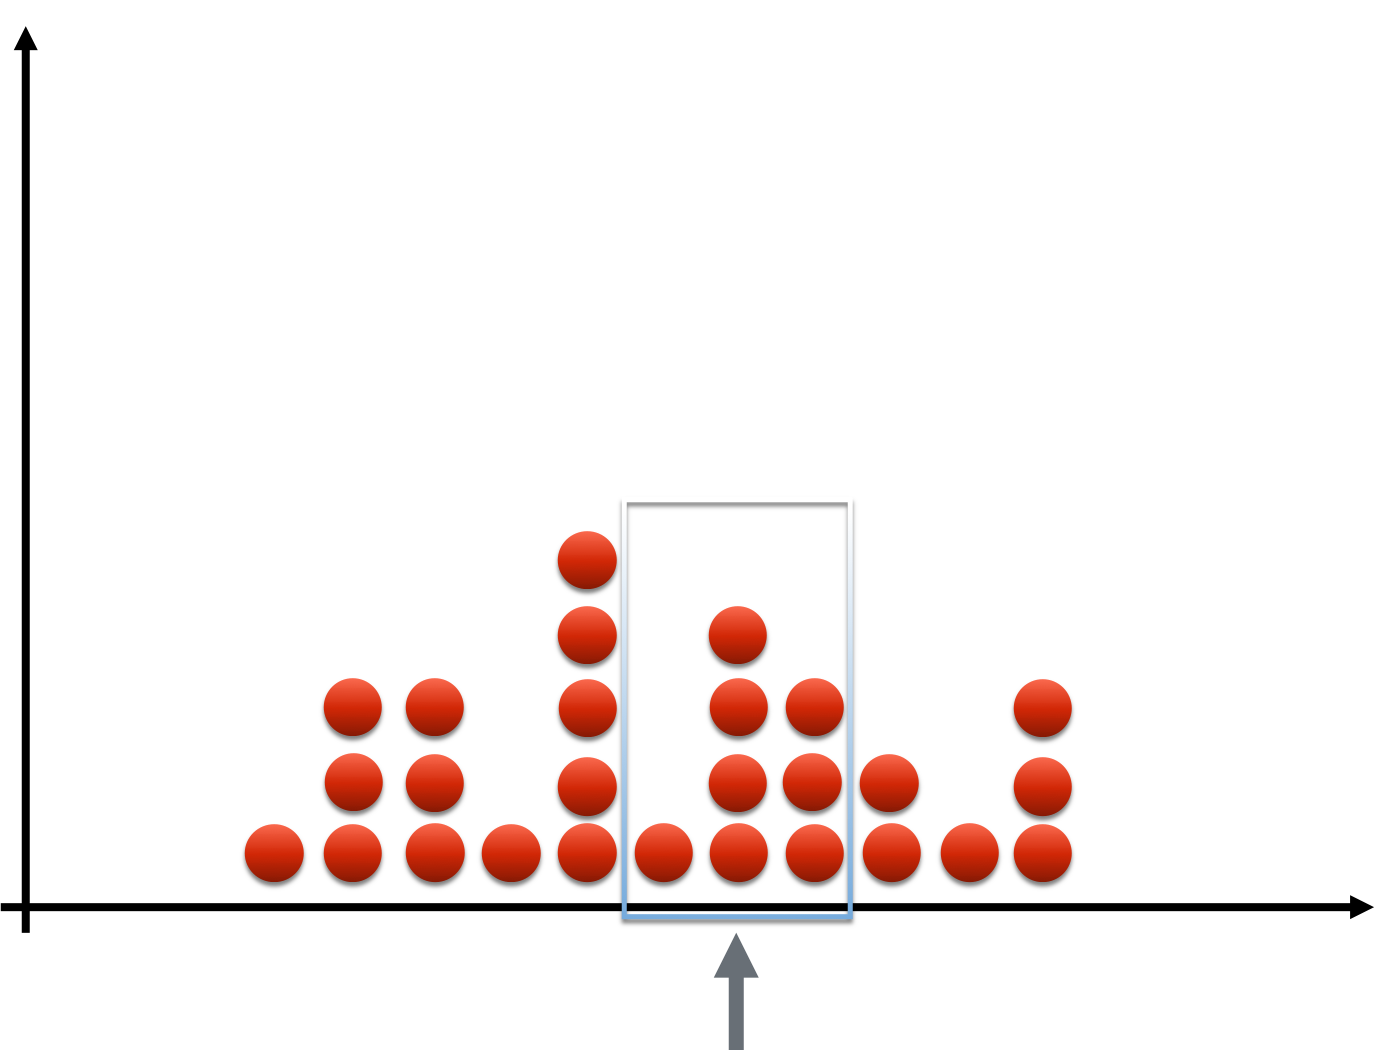
Data smoothing
Data smoothing
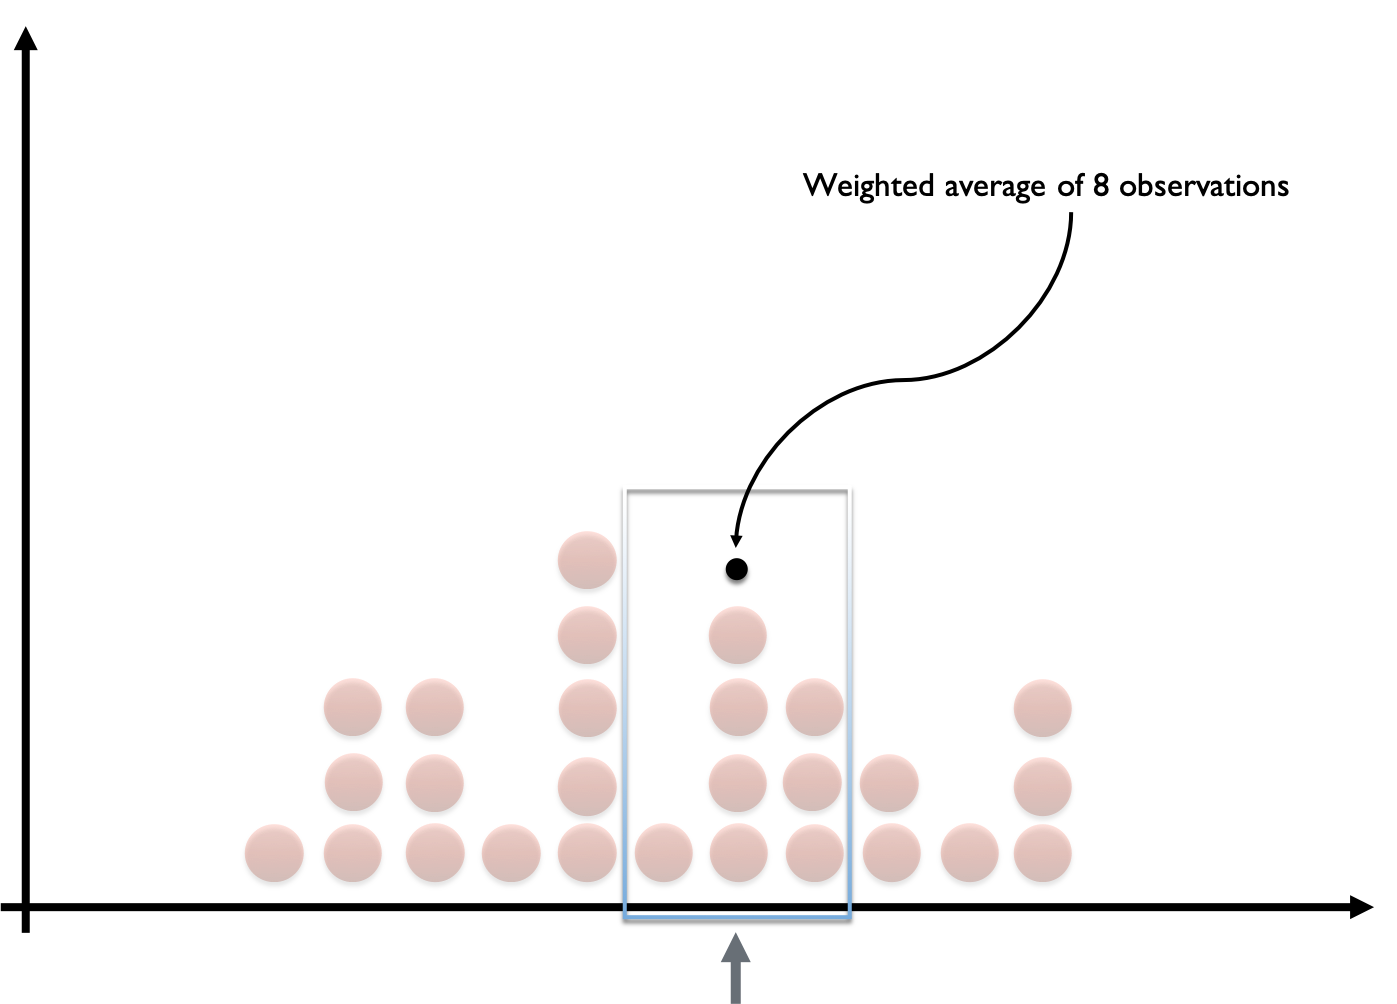
Data smoothing
Data smoothing
Data smoothing
Data smoothing
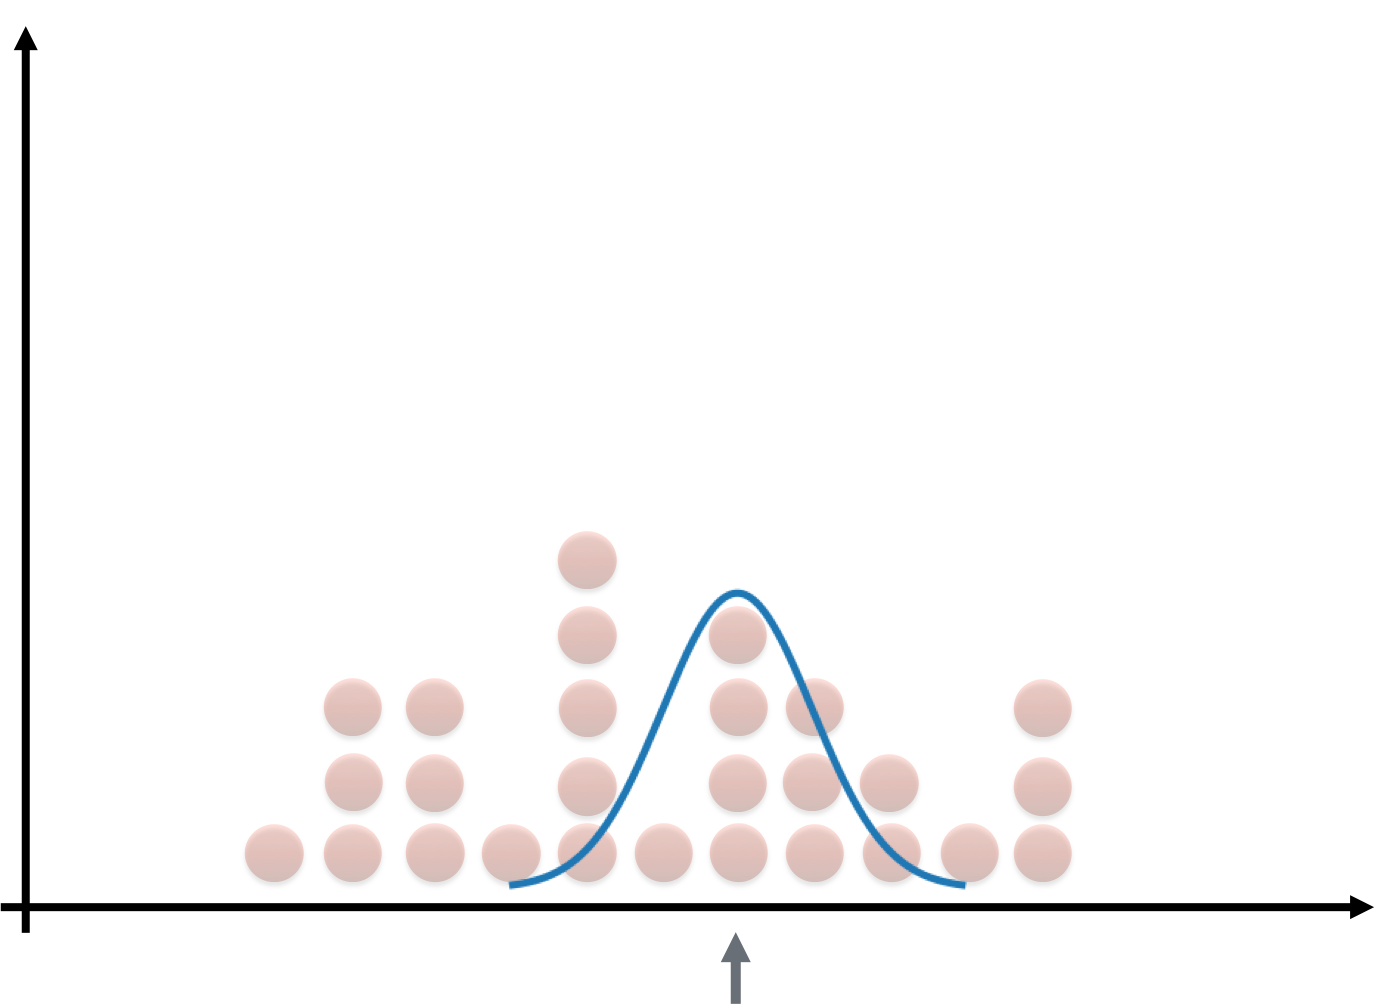
The Gaussian kernel
KDE in Python