Summary statistics
Monte Carlo Simulations in Python

Izzy Weber
Curriculum Manager, DataCamp
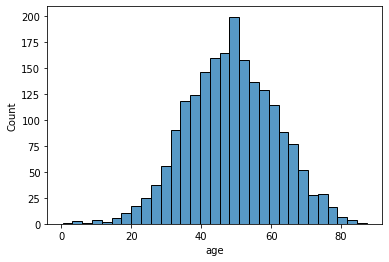
Age outcomes
What is the difference in outcomes for people in the first and fourth age quantiles?
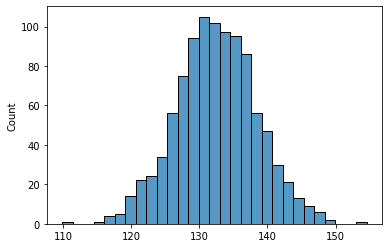
Outcome differences based on age and bmi
- Standard deviation:
np.std(y_diffs)
5.9322225537128
- Histogram of the results:
sns.histplot(y_diffs)