Generating continuous random variables
Monte Carlo Simulations in Python

Izzy Weber
Curriculum Manager, DataCamp
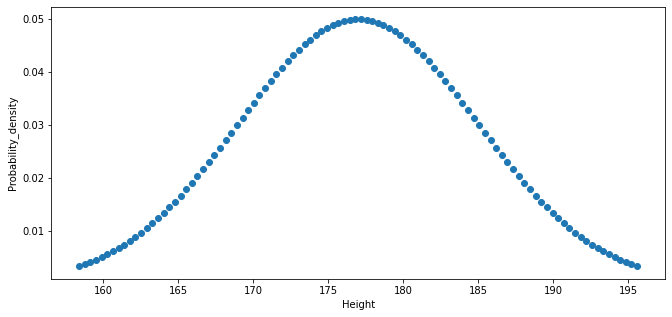
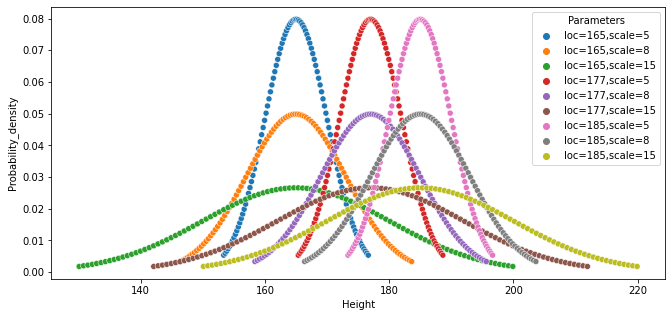
Normal distribution
Bell-shaped and centered at the mean (or loc); width defined by standard deviation (or scale)
The heights of American adult males are normally distributed:
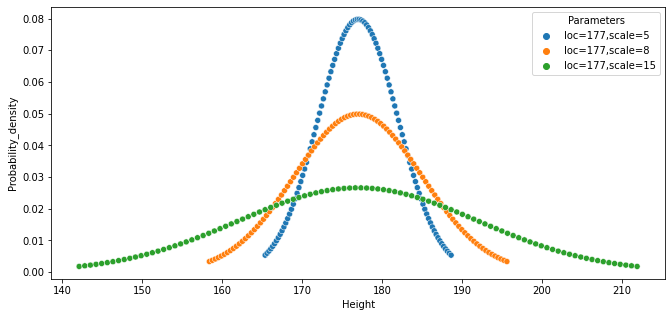
Changing the scale (standard deviation)
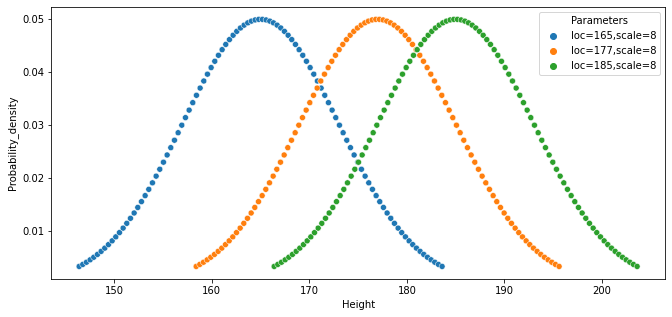
Changing the loc (mean)
Changing both scale and loc
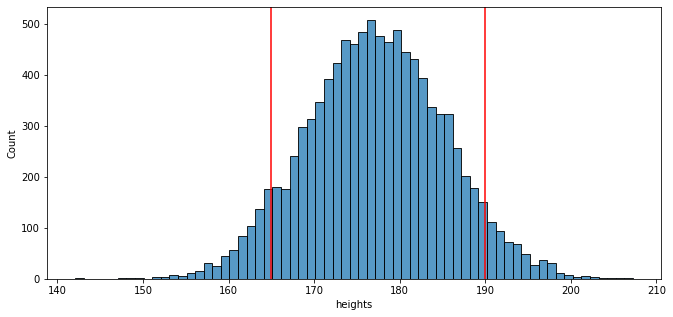
Plotting simulation results
heights_dict = {"heights":heights}
sns.histplot(x="heights", data=heights_dict)
plt.axvline(x=165, color="red")
plt.axvline(x=190, color="red")