Make the perfect plot using Shiny
Case Studies: Building Web Applications with Shiny in R

Dean Attali
Shiny Consultant
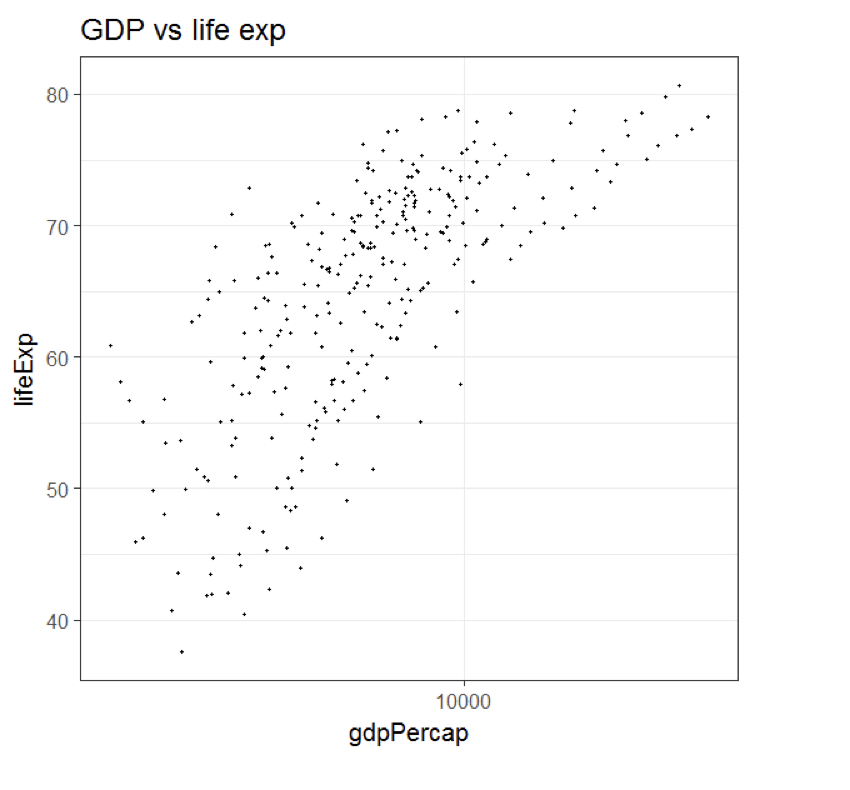
Re-plotting using R code
make_figure(
  data   = data1,
  size   = 1,
  colour = "black",
  title  = "GDP vs life exp"
)
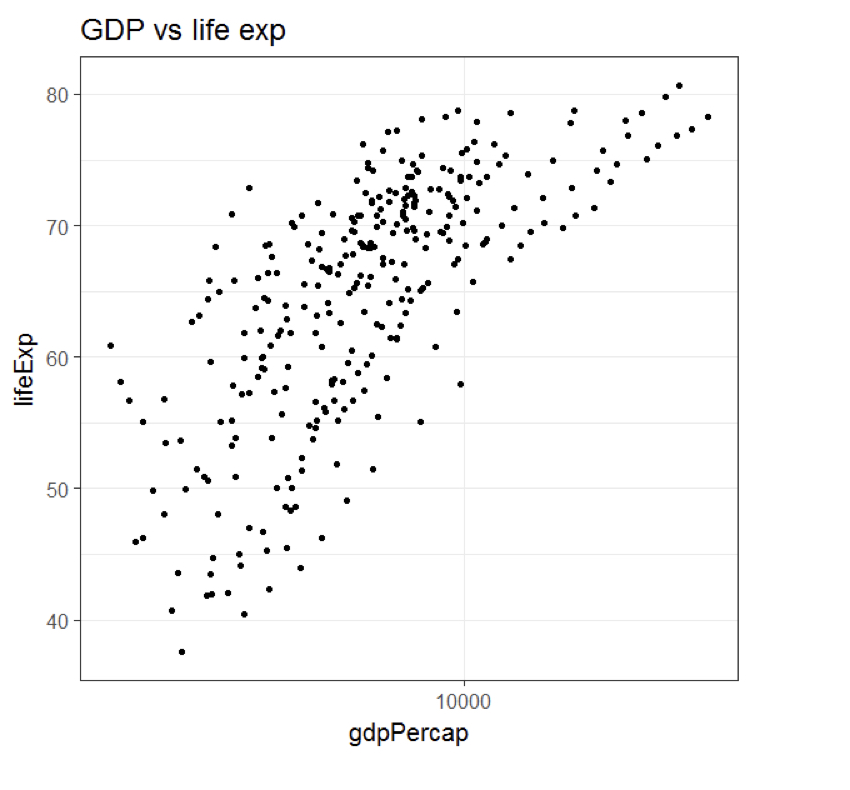
Re-plotting using R code
make_figure(
  data   = data1,
  size   = 2,
  colour = "black",
  title  = "GDP vs life exp"
)
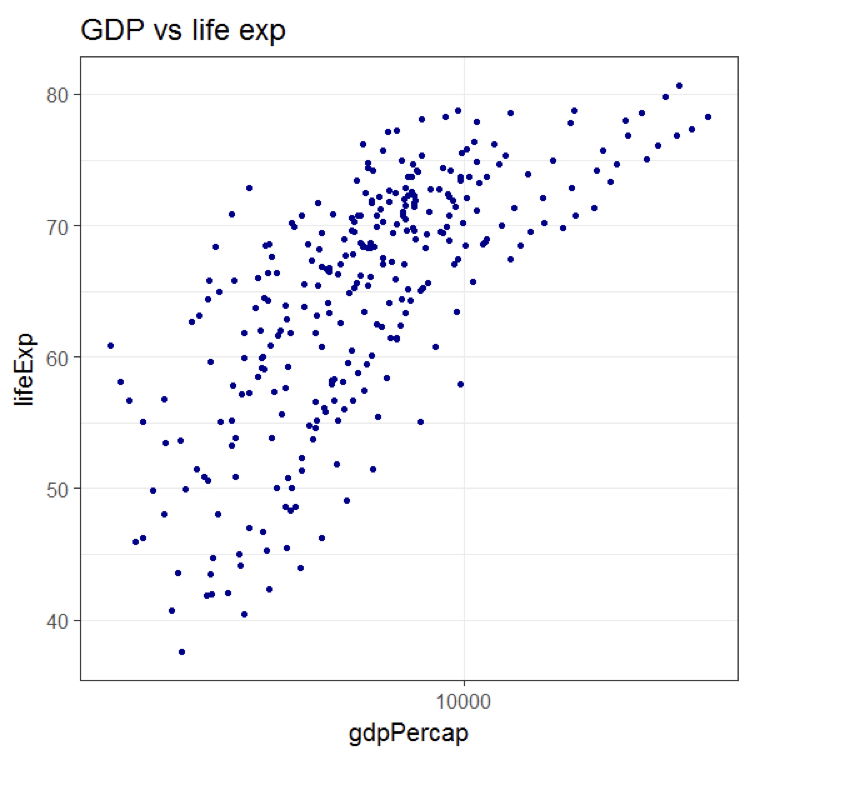
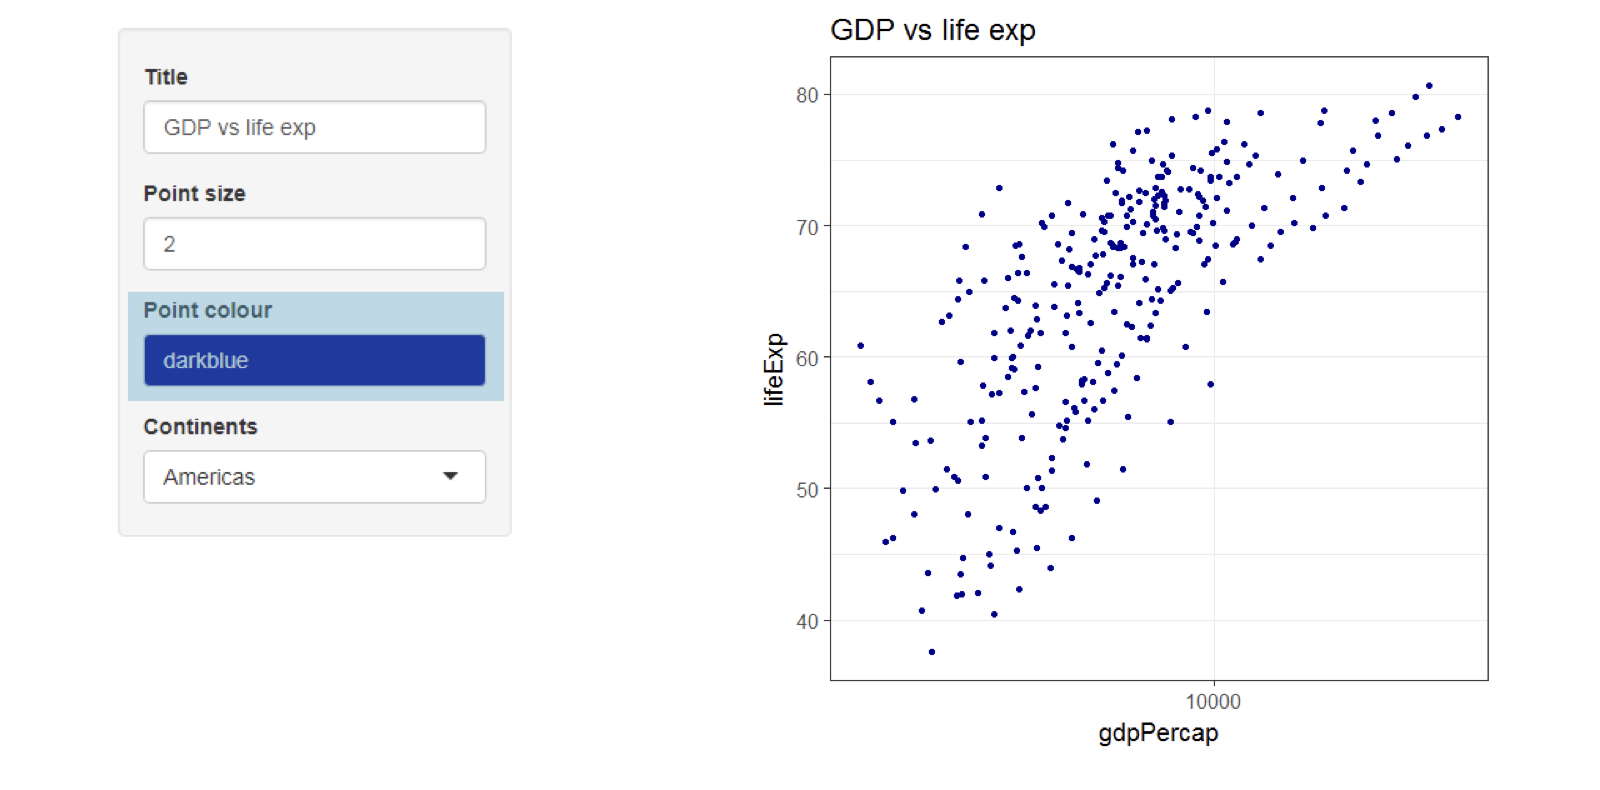
Re-plotting using R code
make_figure(
  data   = data1,
  size   = 2,
  colour = "darkblue",
  title  = "GDP vs life exp"
)
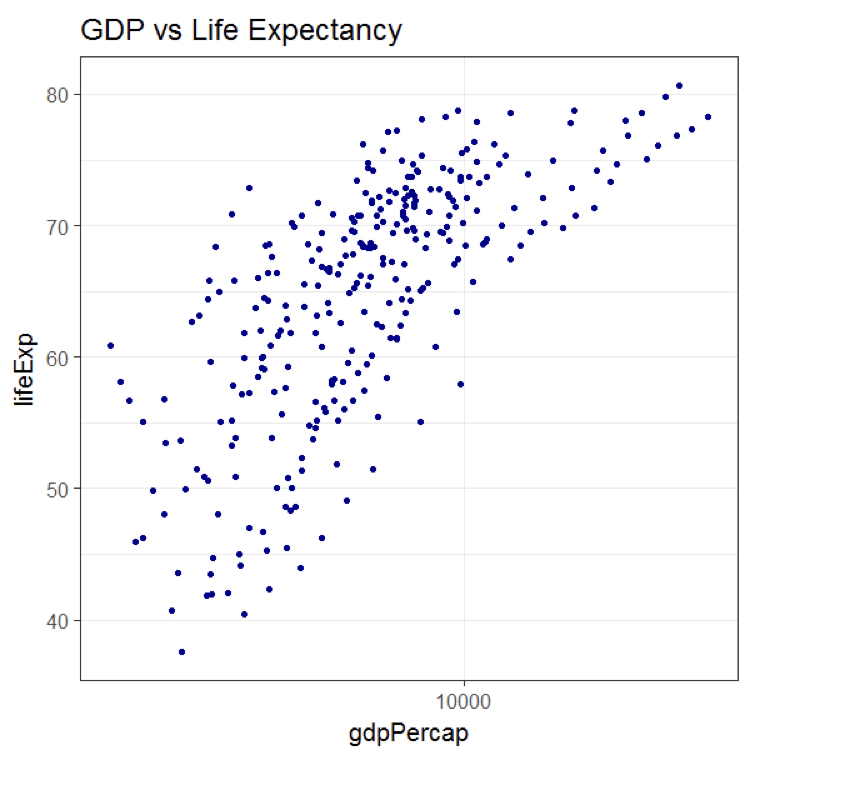
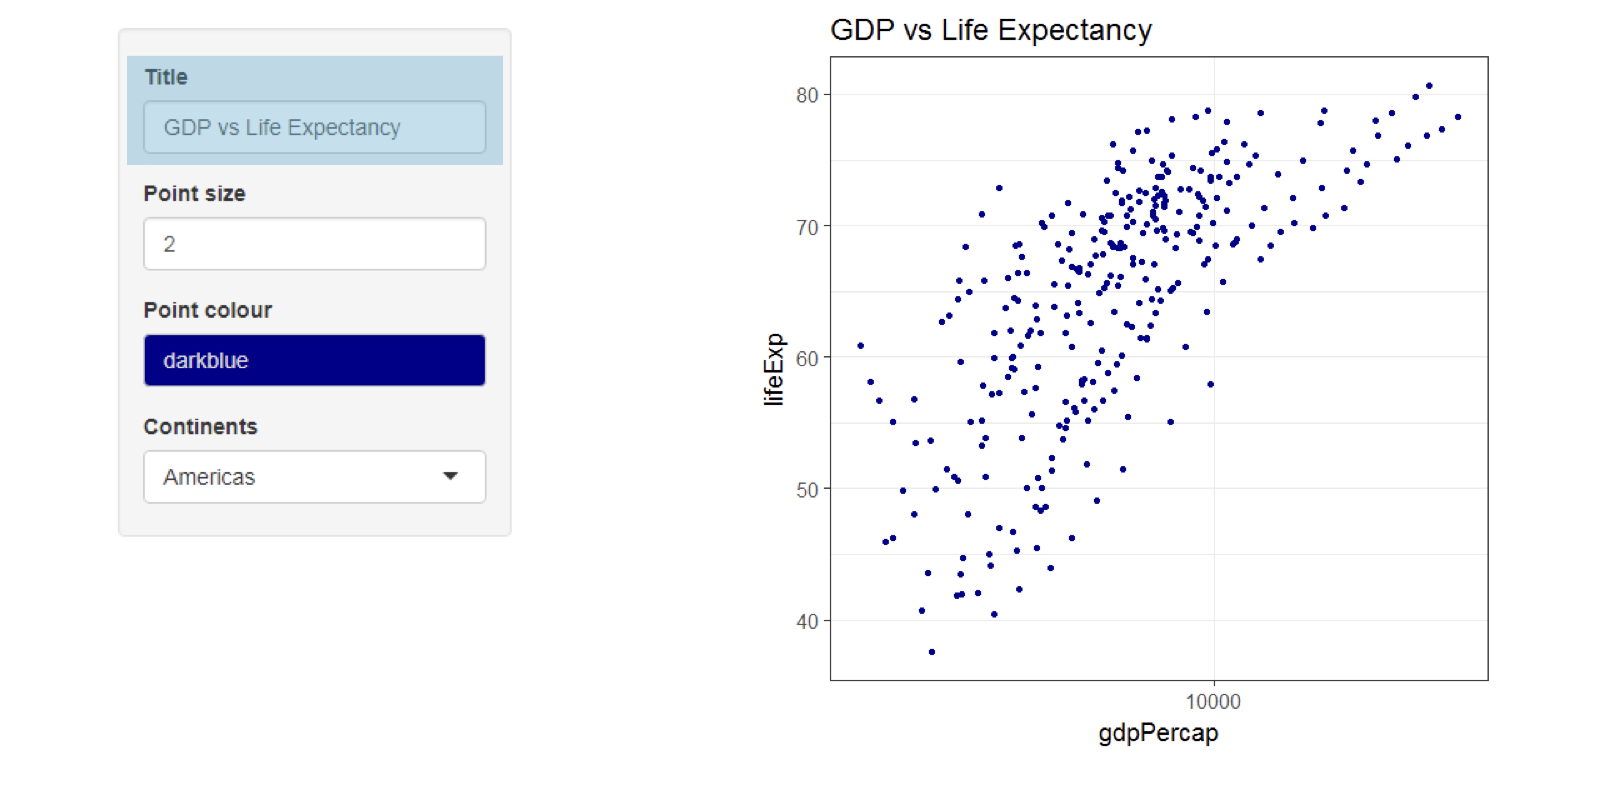
Re-plotting using R code
make_figure(
  data   = data1,
  size   = 2,
  colour = "darkblue",
  title  = "GDP vs Life Expectancy"
)
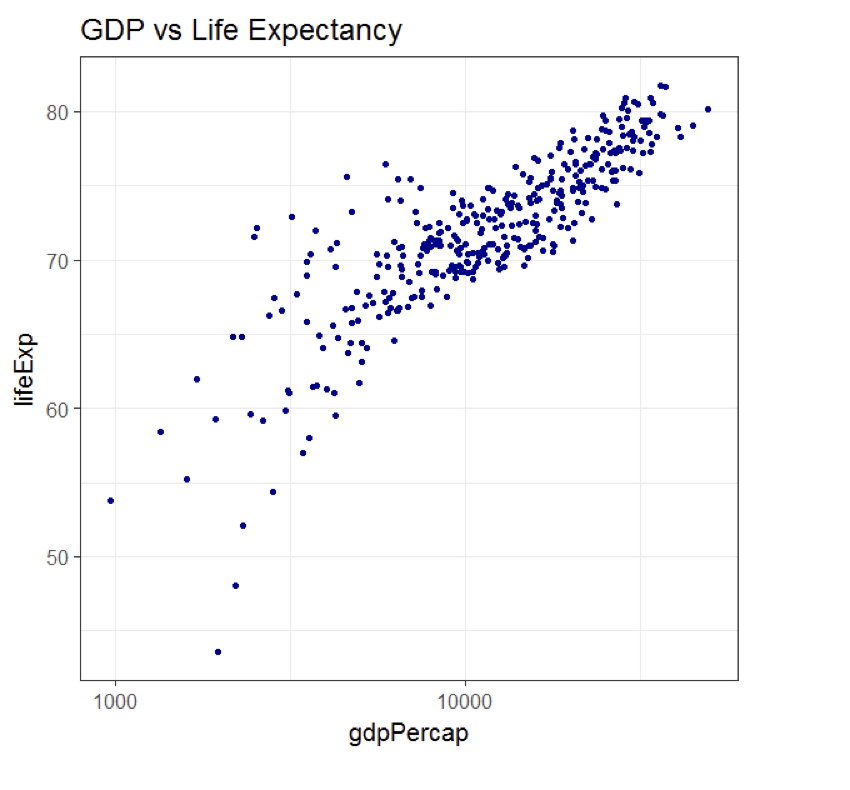
Re-plotting using R code
make_figure(
  data   = data2,
  size   = 2,
  colour = "darkblue",
  title  = "GDP vs Life Expectancy"
)
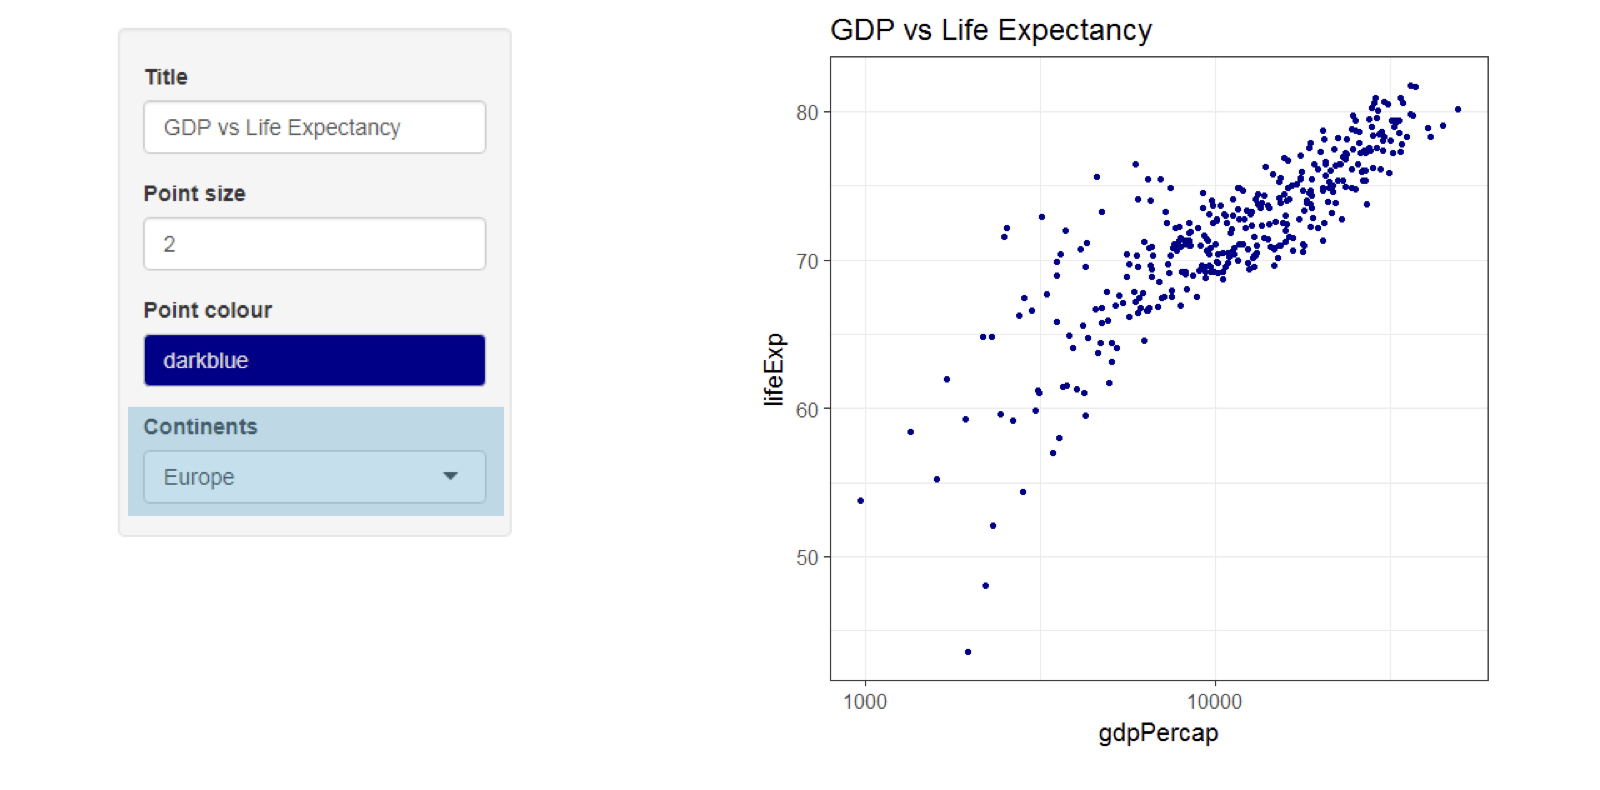
Re-plotting using Shiny
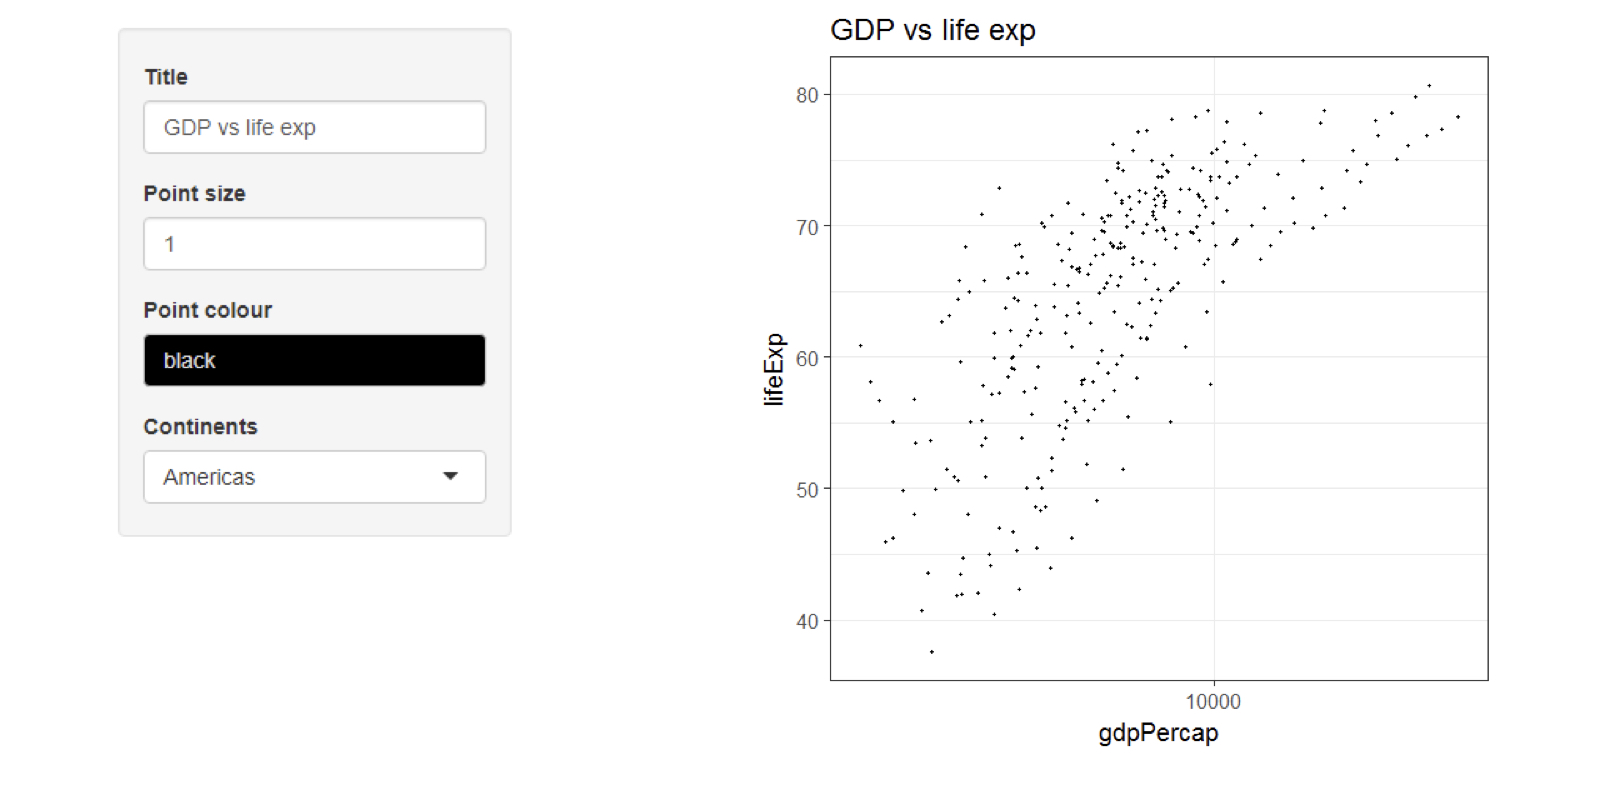
Re-plotting using Shiny
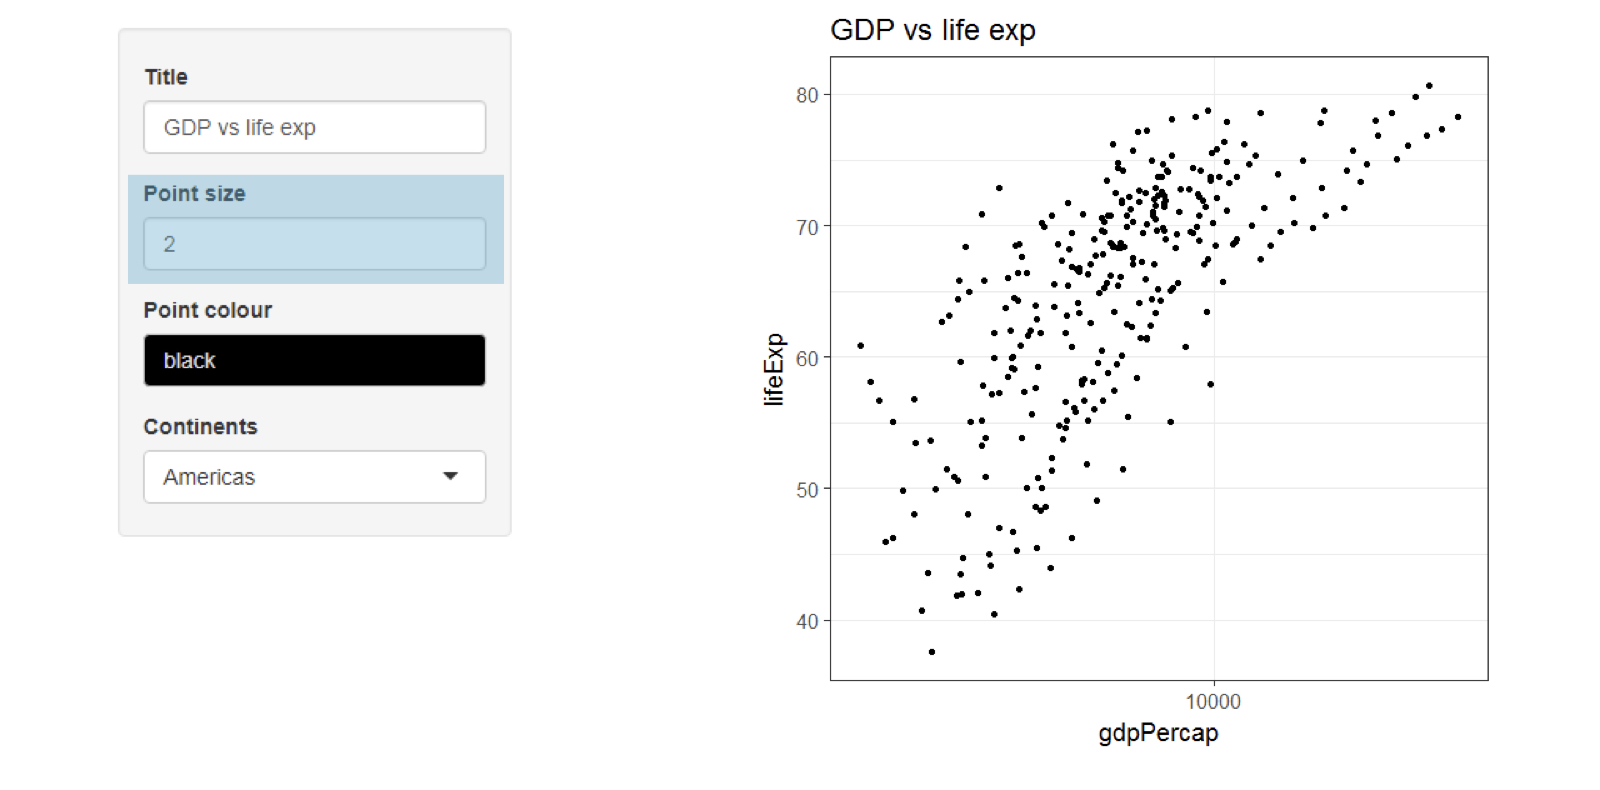
Re-plotting using Shiny
Re-plotting using Shiny
Re-plotting using Shiny