Advanced features to improve your plot
Case Studies: Building Web Applications with Shiny in R

Dean Attali
Shiny Consultant
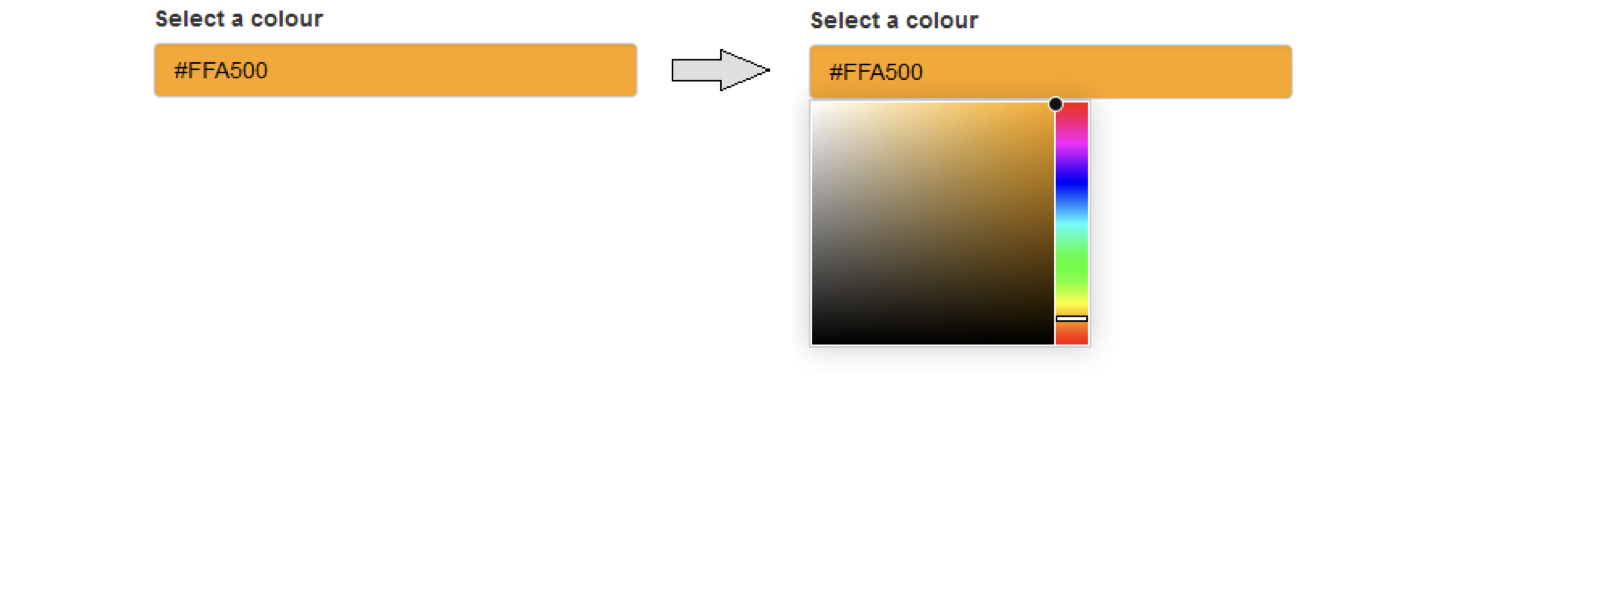
Colour input
library(colourpicker)colourInput("col", "Select a colour", value = "orange")
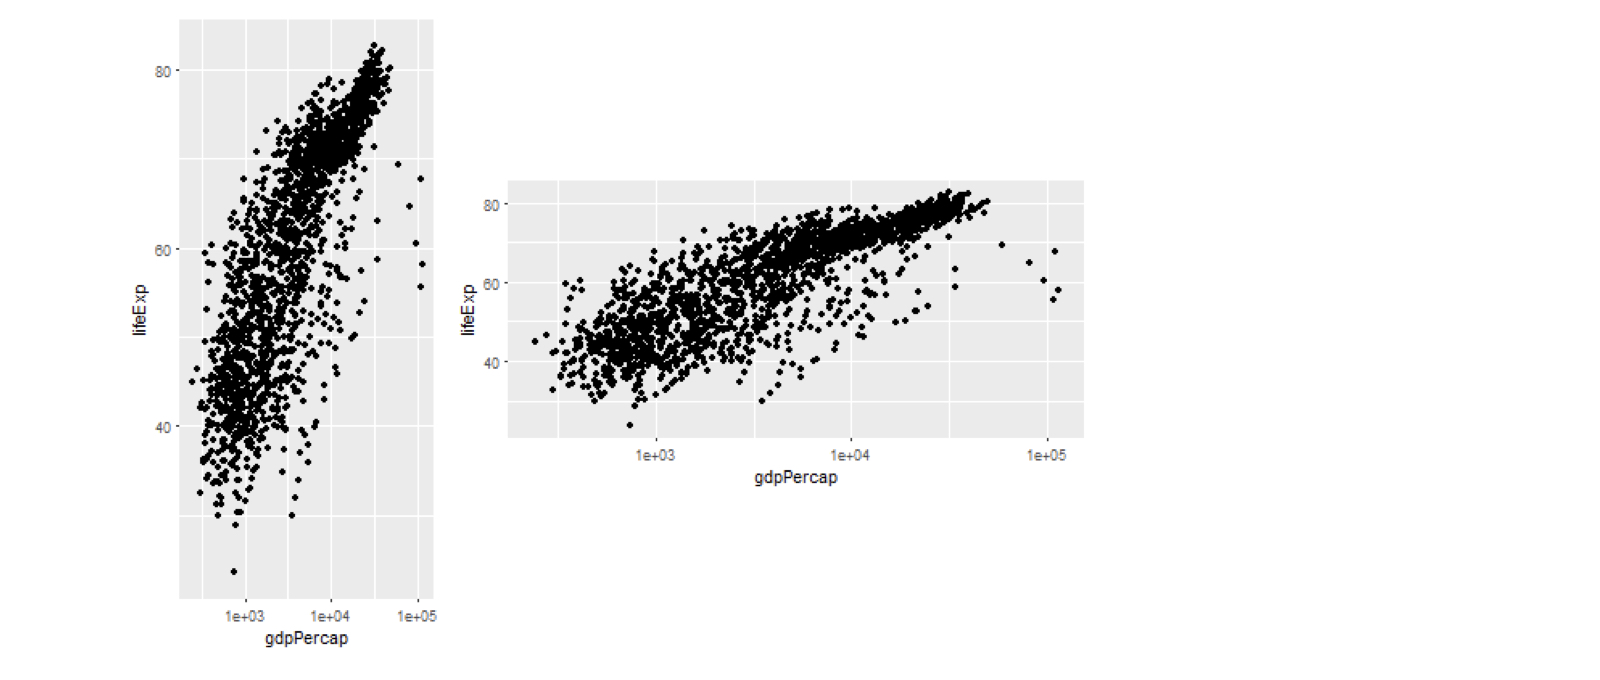
Plot output arguments
plotOutput("plot1", width = 200, height = 400)
plotOutput("plot2", width = 400, height = 200)
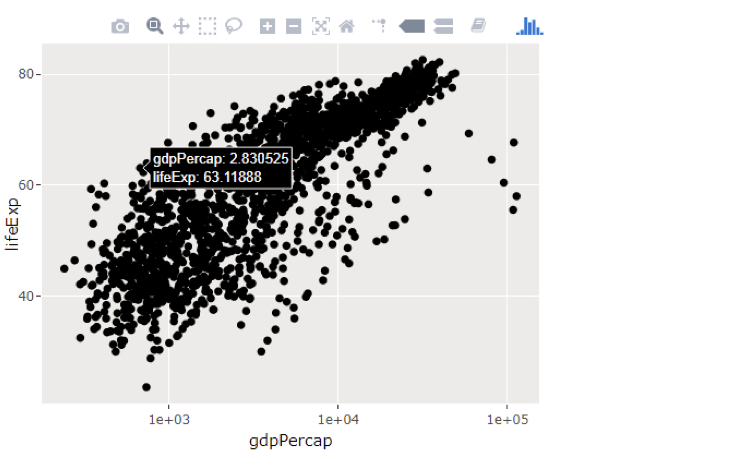
Interactive plots with plotly
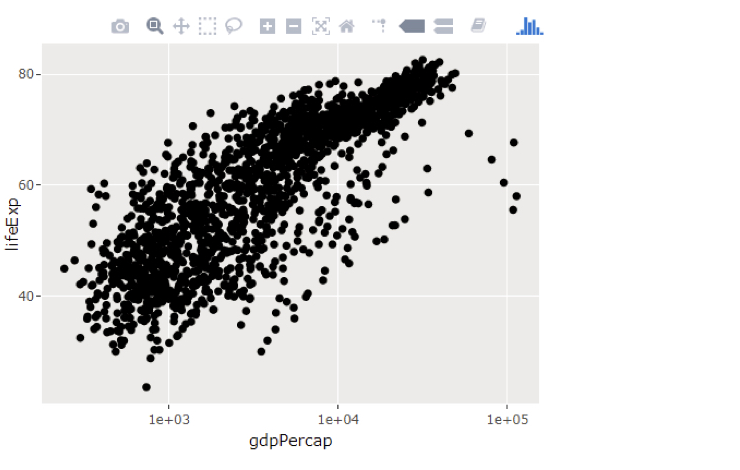
Interactive plots with plotly
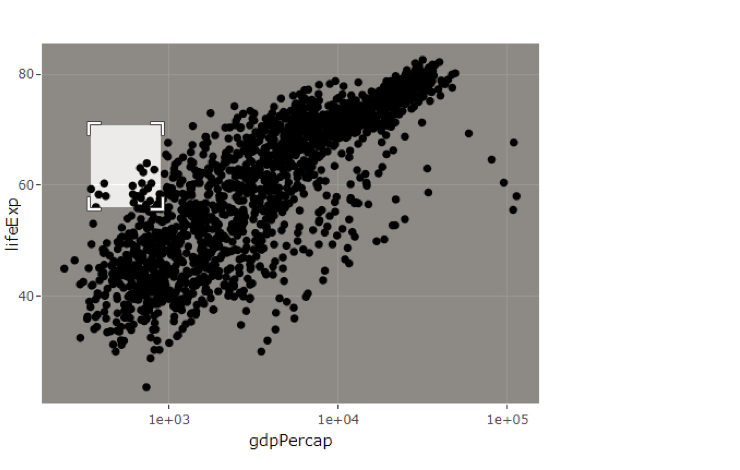
Interactive plots with plotly
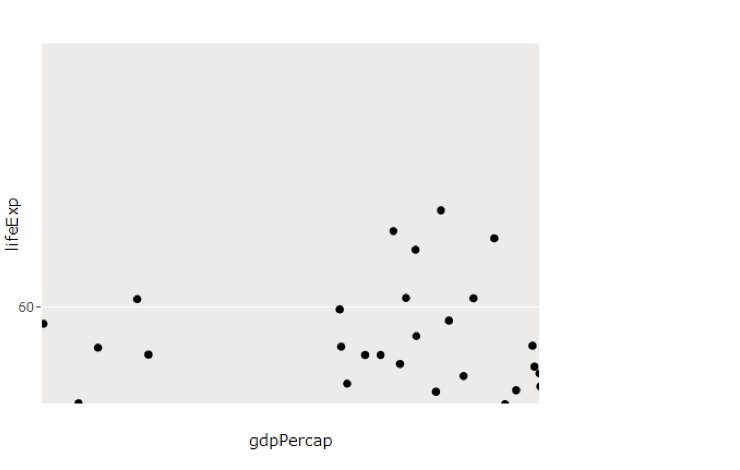
Interactive plots with plotly