Advanced features to improve your plot
Case Studies: Building Web Applications with Shiny in R

Dean Attali
Shiny Consultant
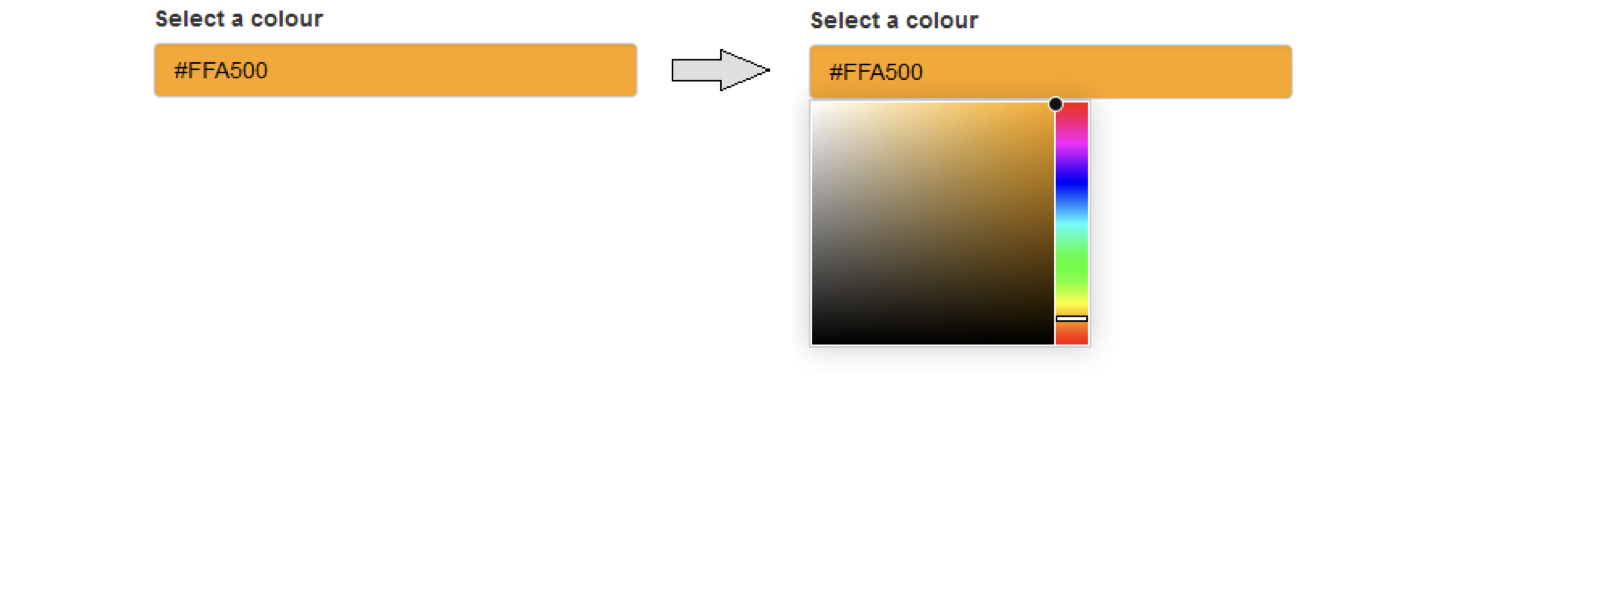
Colour input
library(colourpicker)colourInput("col", "Select a colour", value = "orange")
Outputs can have arguments
plotOutput(outputId, width = "100%", height = "400px",
           click = NULL, dblclick = NULL, hover = NULL,
           hoverDelay = NULL, hoverDelayType = NULL,
           brush = NULL, clickId = NULL, hoverId = NULL,
           inline = FALSE)
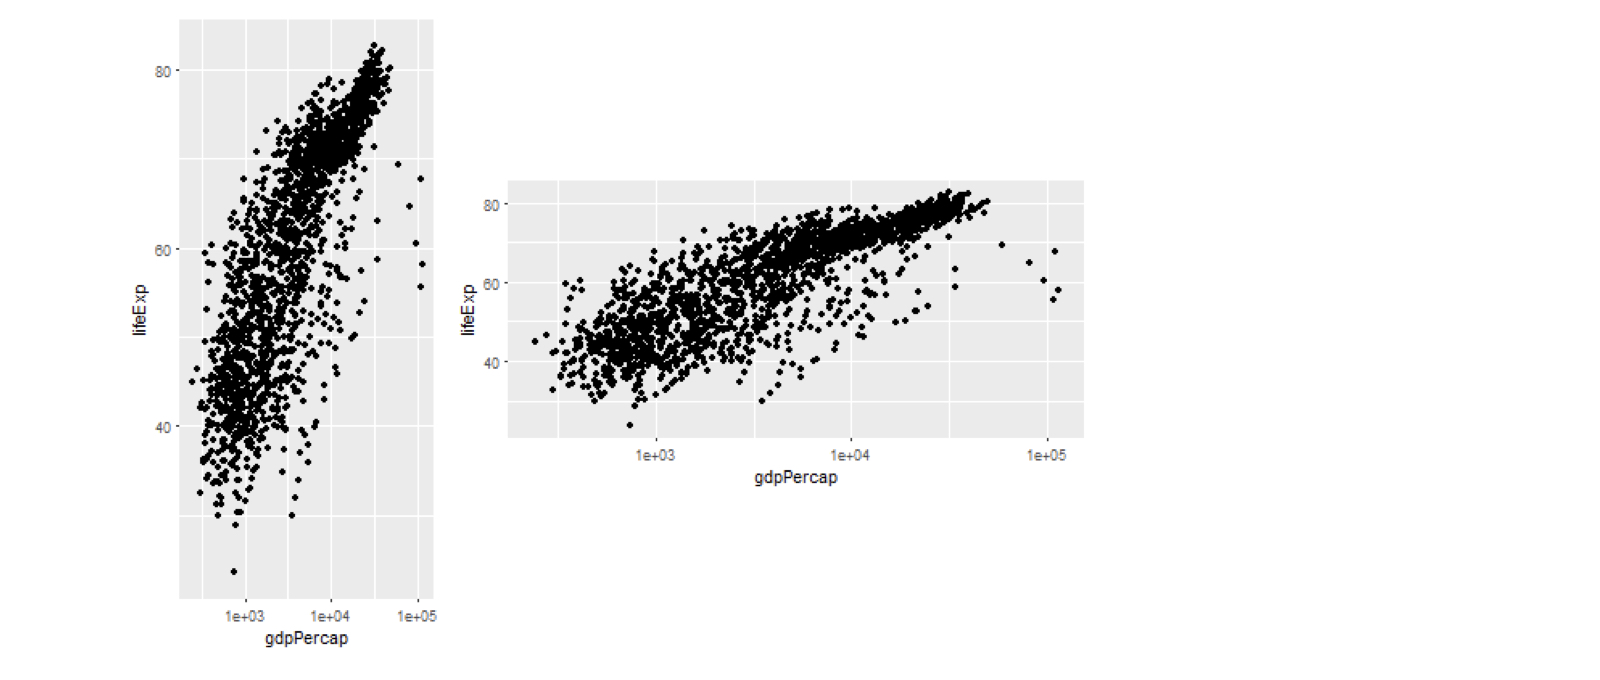
Plot output arguments
plotOutput("plot1", width = 200, height = 400)
plotOutput("plot2", width = 400, height = 200)
Interactive plots with plotly
- Many packages for interactive plots
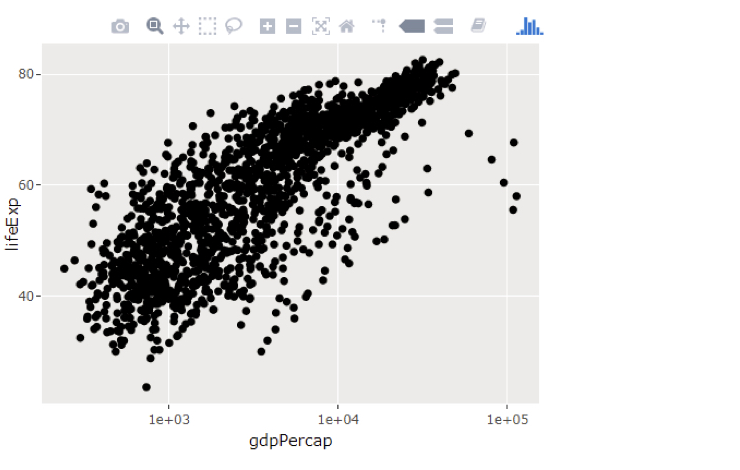
plotlyis popular choiceggplotly():ggplot2plot ⇒ interactive
p <- ggplot(gapminder, aes(gdpPercap, lifeExp)) + geom_point() + scale_x_log10()library(plotly)ggplotly(p)
Interactive plots with plotly
- Many packages for interactive plots
plotlyis popular choiceggplotly():ggplot2plot ⇒ interactive
p <- ggplot(gapminder, aes(gdpPercap, lifeExp)) + geom_point() + scale_x_log10()library(plotly)ggplotly(p)
Interactive plots with plotly
- Many packages for interactive plots
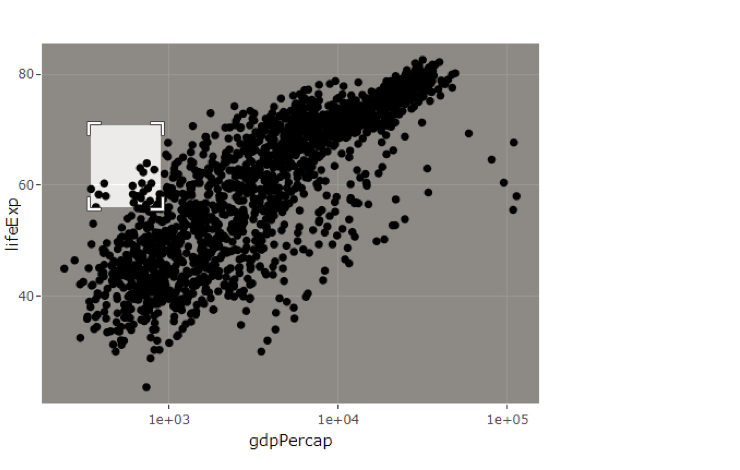
plotlyis popular choiceggplotly():ggplot2plot ⇒ interactive
p <- ggplot(gapminder, aes(gdpPercap, lifeExp)) + geom_point() + scale_x_log10()library(plotly)ggplotly(p)
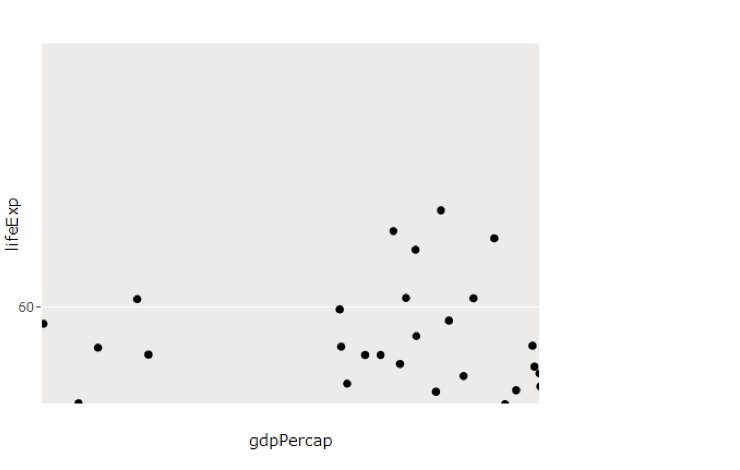
Interactive plots with plotly
- Many packages for interactive plots
plotlyis popular choiceggplotly():ggplot2plot ⇒ interactive
p <- ggplot(gapminder, aes(gdpPercap, lifeExp)) + geom_point() + scale_x_log10()library(plotly)ggplotly(p)
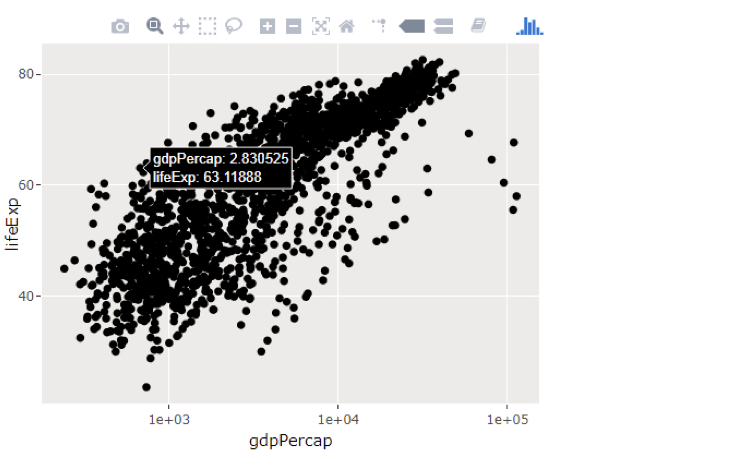
Plotly in Shiny
- Incorrect
plotOutput("plot")
renderPlot(ggplotly(p))
- Correct
plotlyOutput("plot")
renderPlotly(ggplotly(p))
Let's practice!
Case Studies: Building Web Applications with Shiny in R

