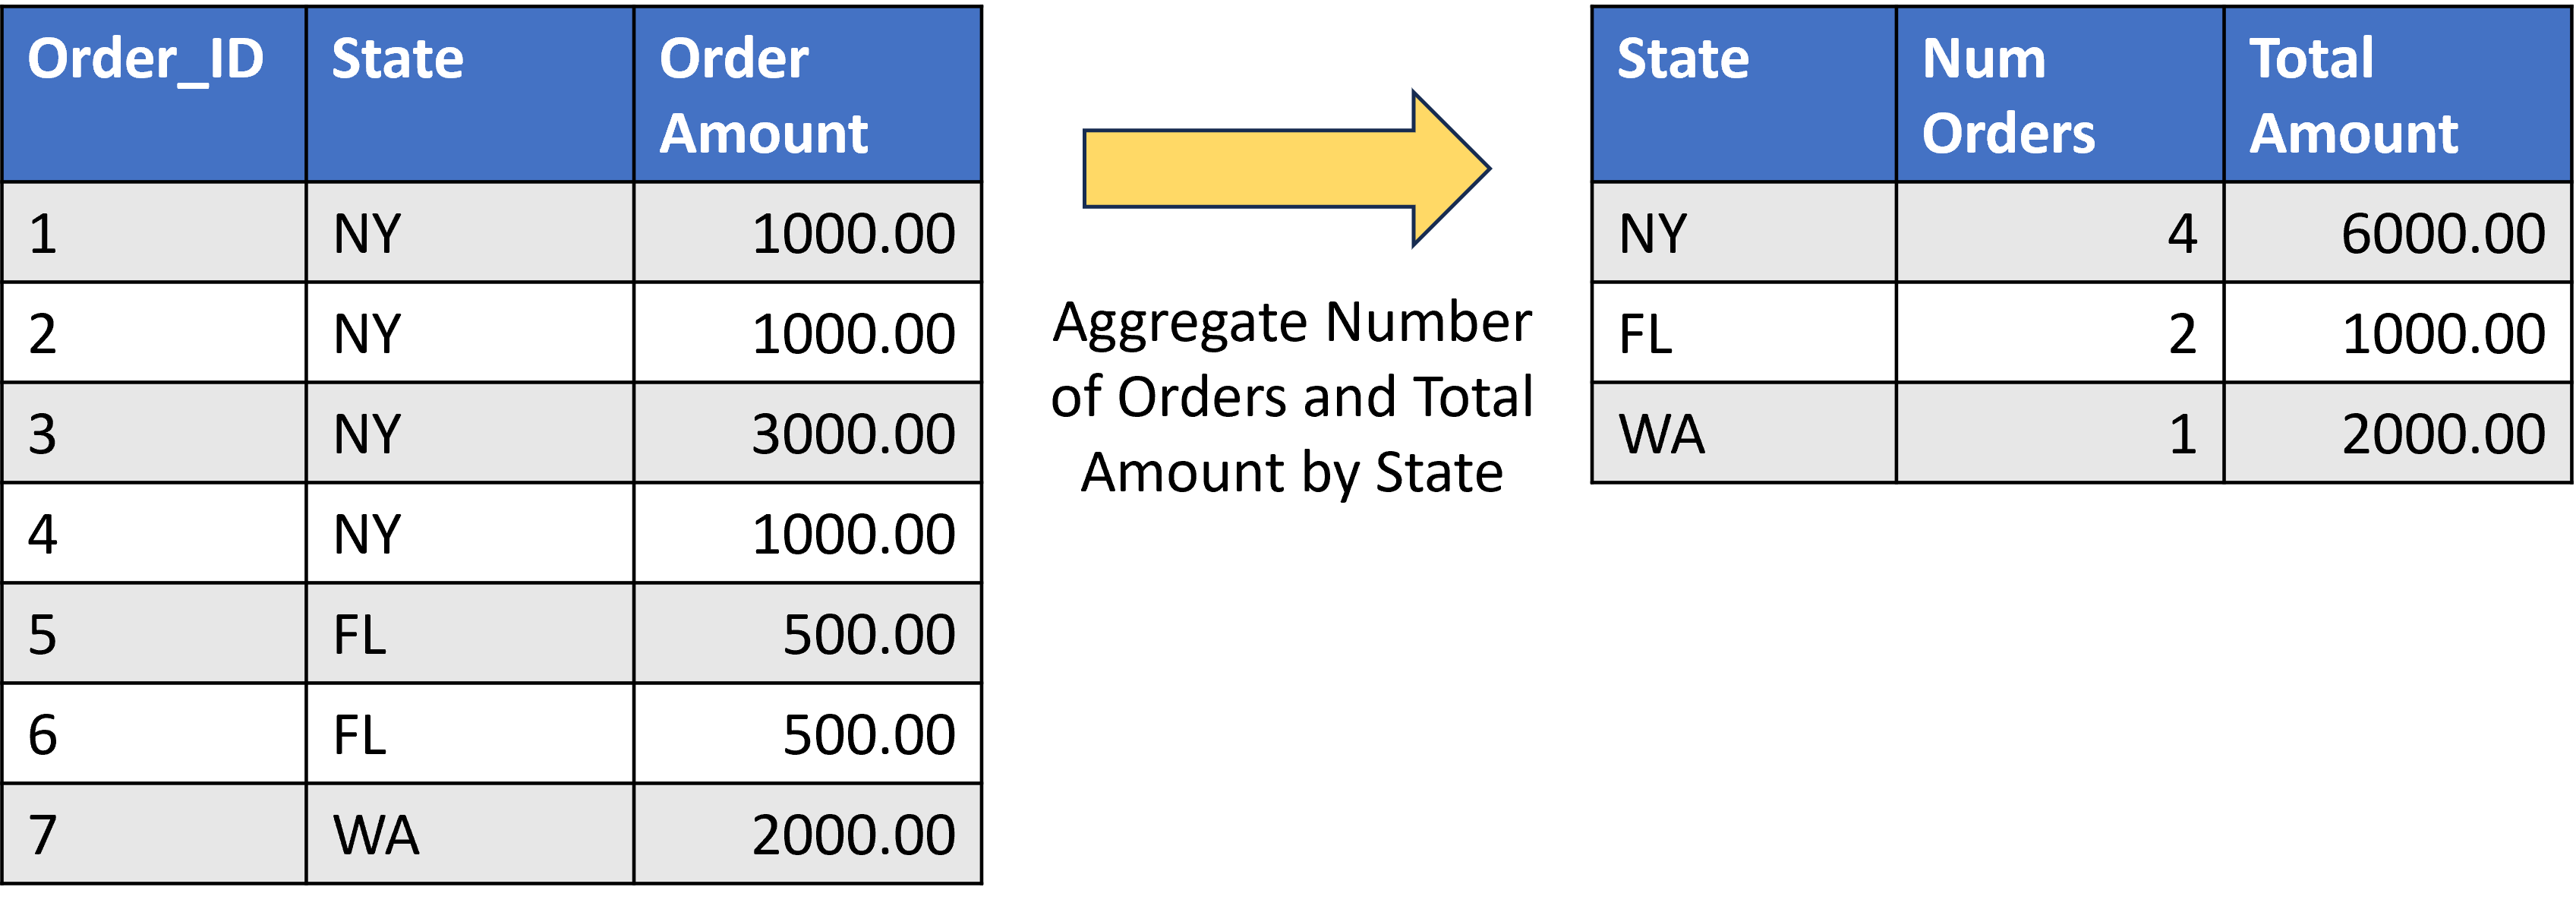
Data Aggregation
Transform and Analyze Data with Microsoft Fabric

Luis Silva
Solution Architect - Data & AI
When you should aggregate data?
Tools for implementing aggregation of data
Aggregating data with SQL
Aggregating data with Spark
from pyspark.sql.functions import sum

df.groupBy("state").agg(count("order_id"), sum("order_amount")).show()
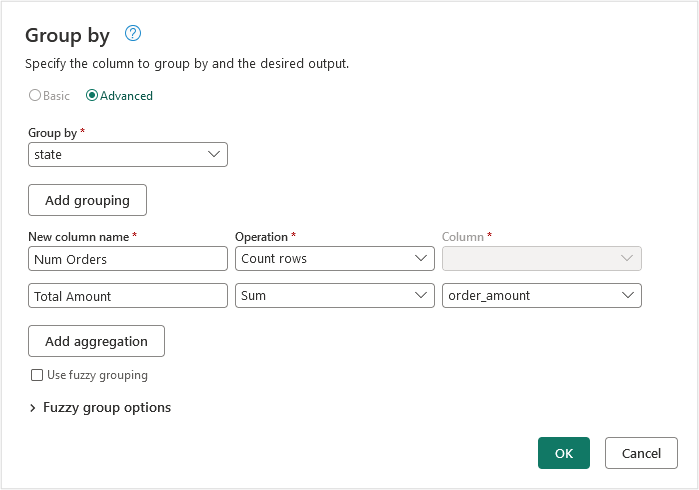
Aggregating data with Dataflows
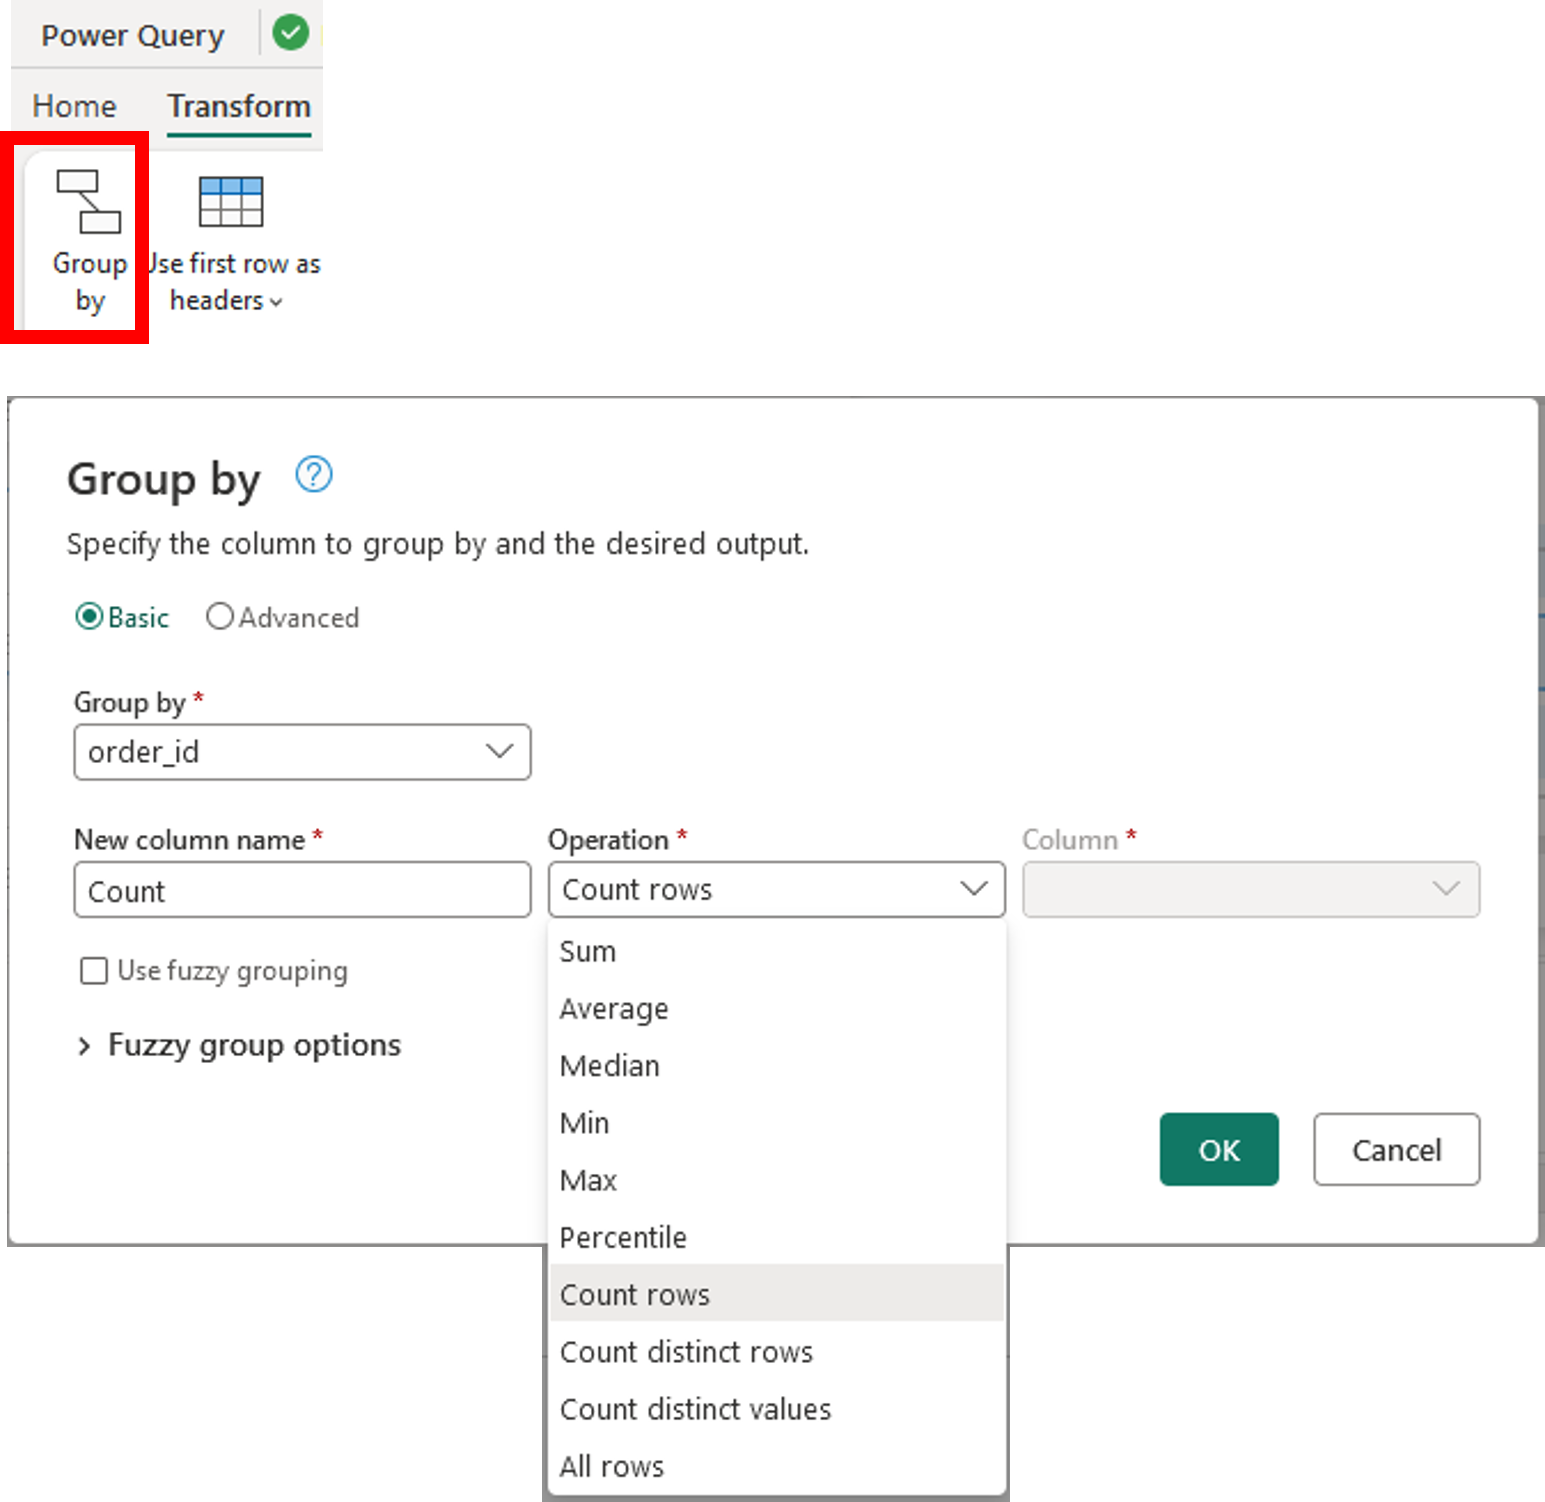
Aggregating data with Dataflows