Introduction to Star Schemas

Transform and Analyze Data with Microsoft Fabric

Luis Silva

Solution Architect - Data & AI

Dimensional Modeling basics

  • A Dimensional Model is a data structure optimized for data warehousing and analysis
  • It is a model of business events
  • Events have data and context
Transform and Analyze Data with Microsoft Fabric

Dimensional Modeling basics

Event: sale of a product at a retail shop.

Image of a sales receipt from a retail store

Transform and Analyze Data with Microsoft Fabric

Dimensional Modeling basics

Event: sale of a product at a retail shop.

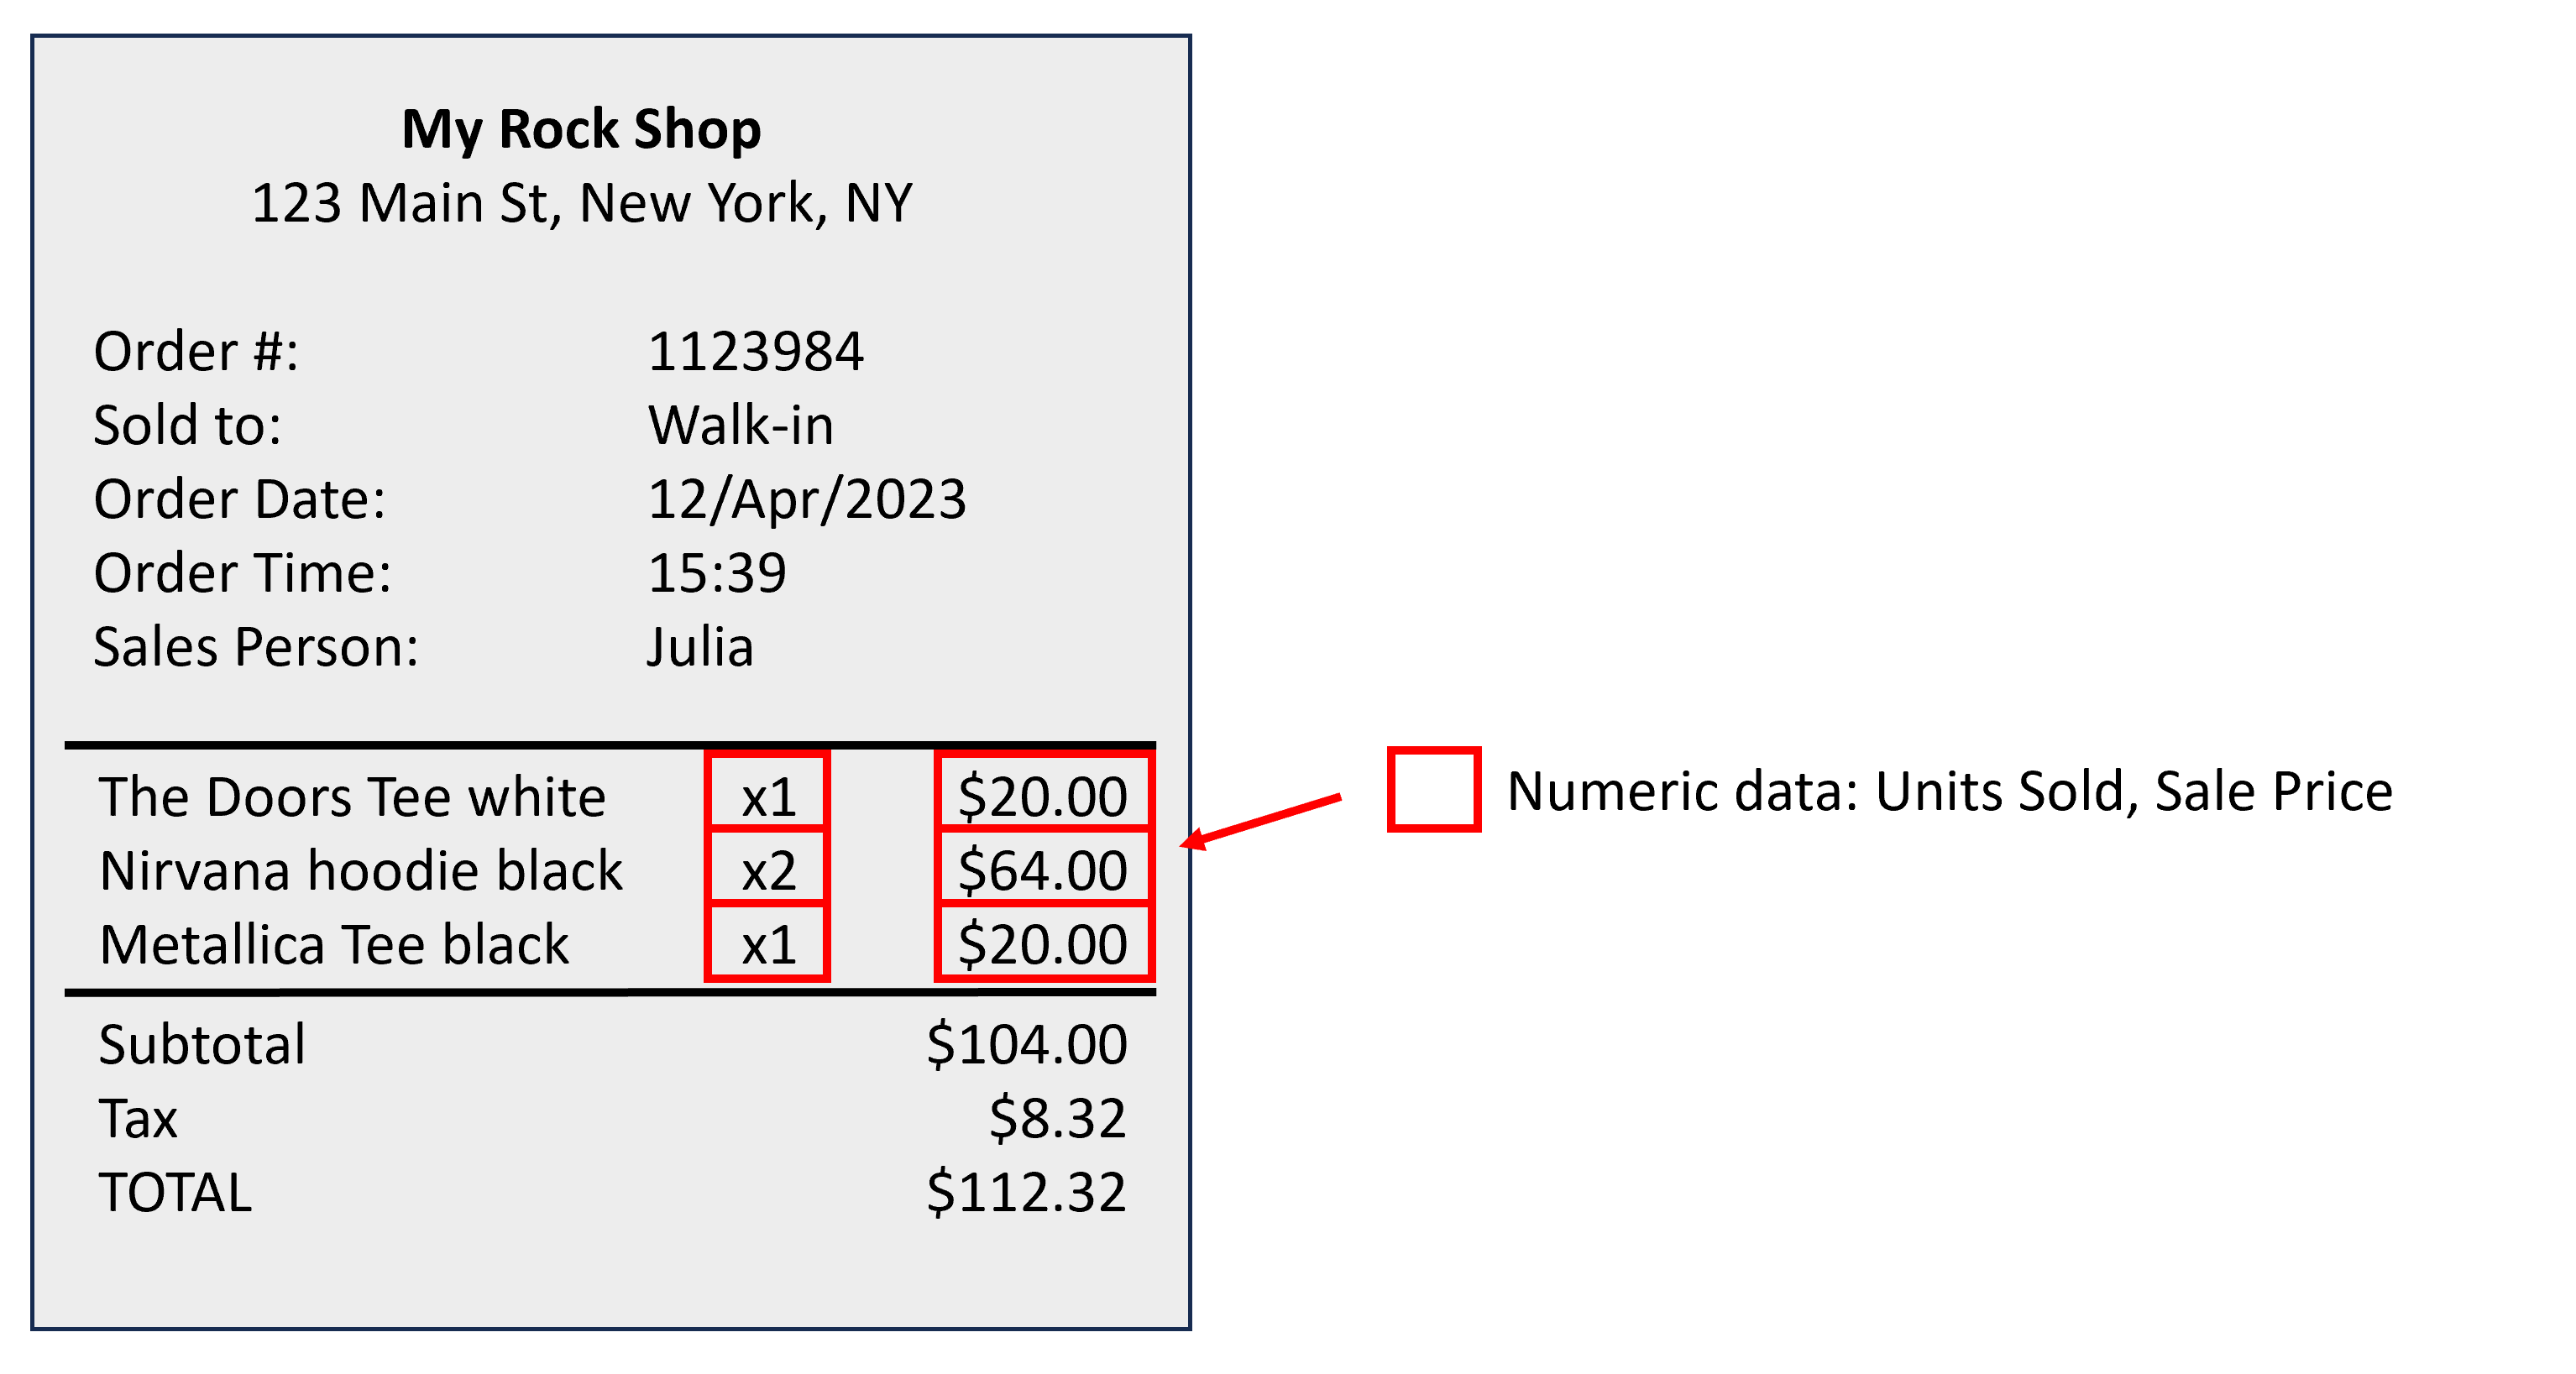
  • Numeric data:
    • Number of Units Sold
    • Sale Price

Image of a sales receipt from a retail store, highlighting the numeric data: Units Sold and Sale Price

Transform and Analyze Data with Microsoft Fabric

Dimensional Modeling basics

Event: sale of a product at a retail shop.

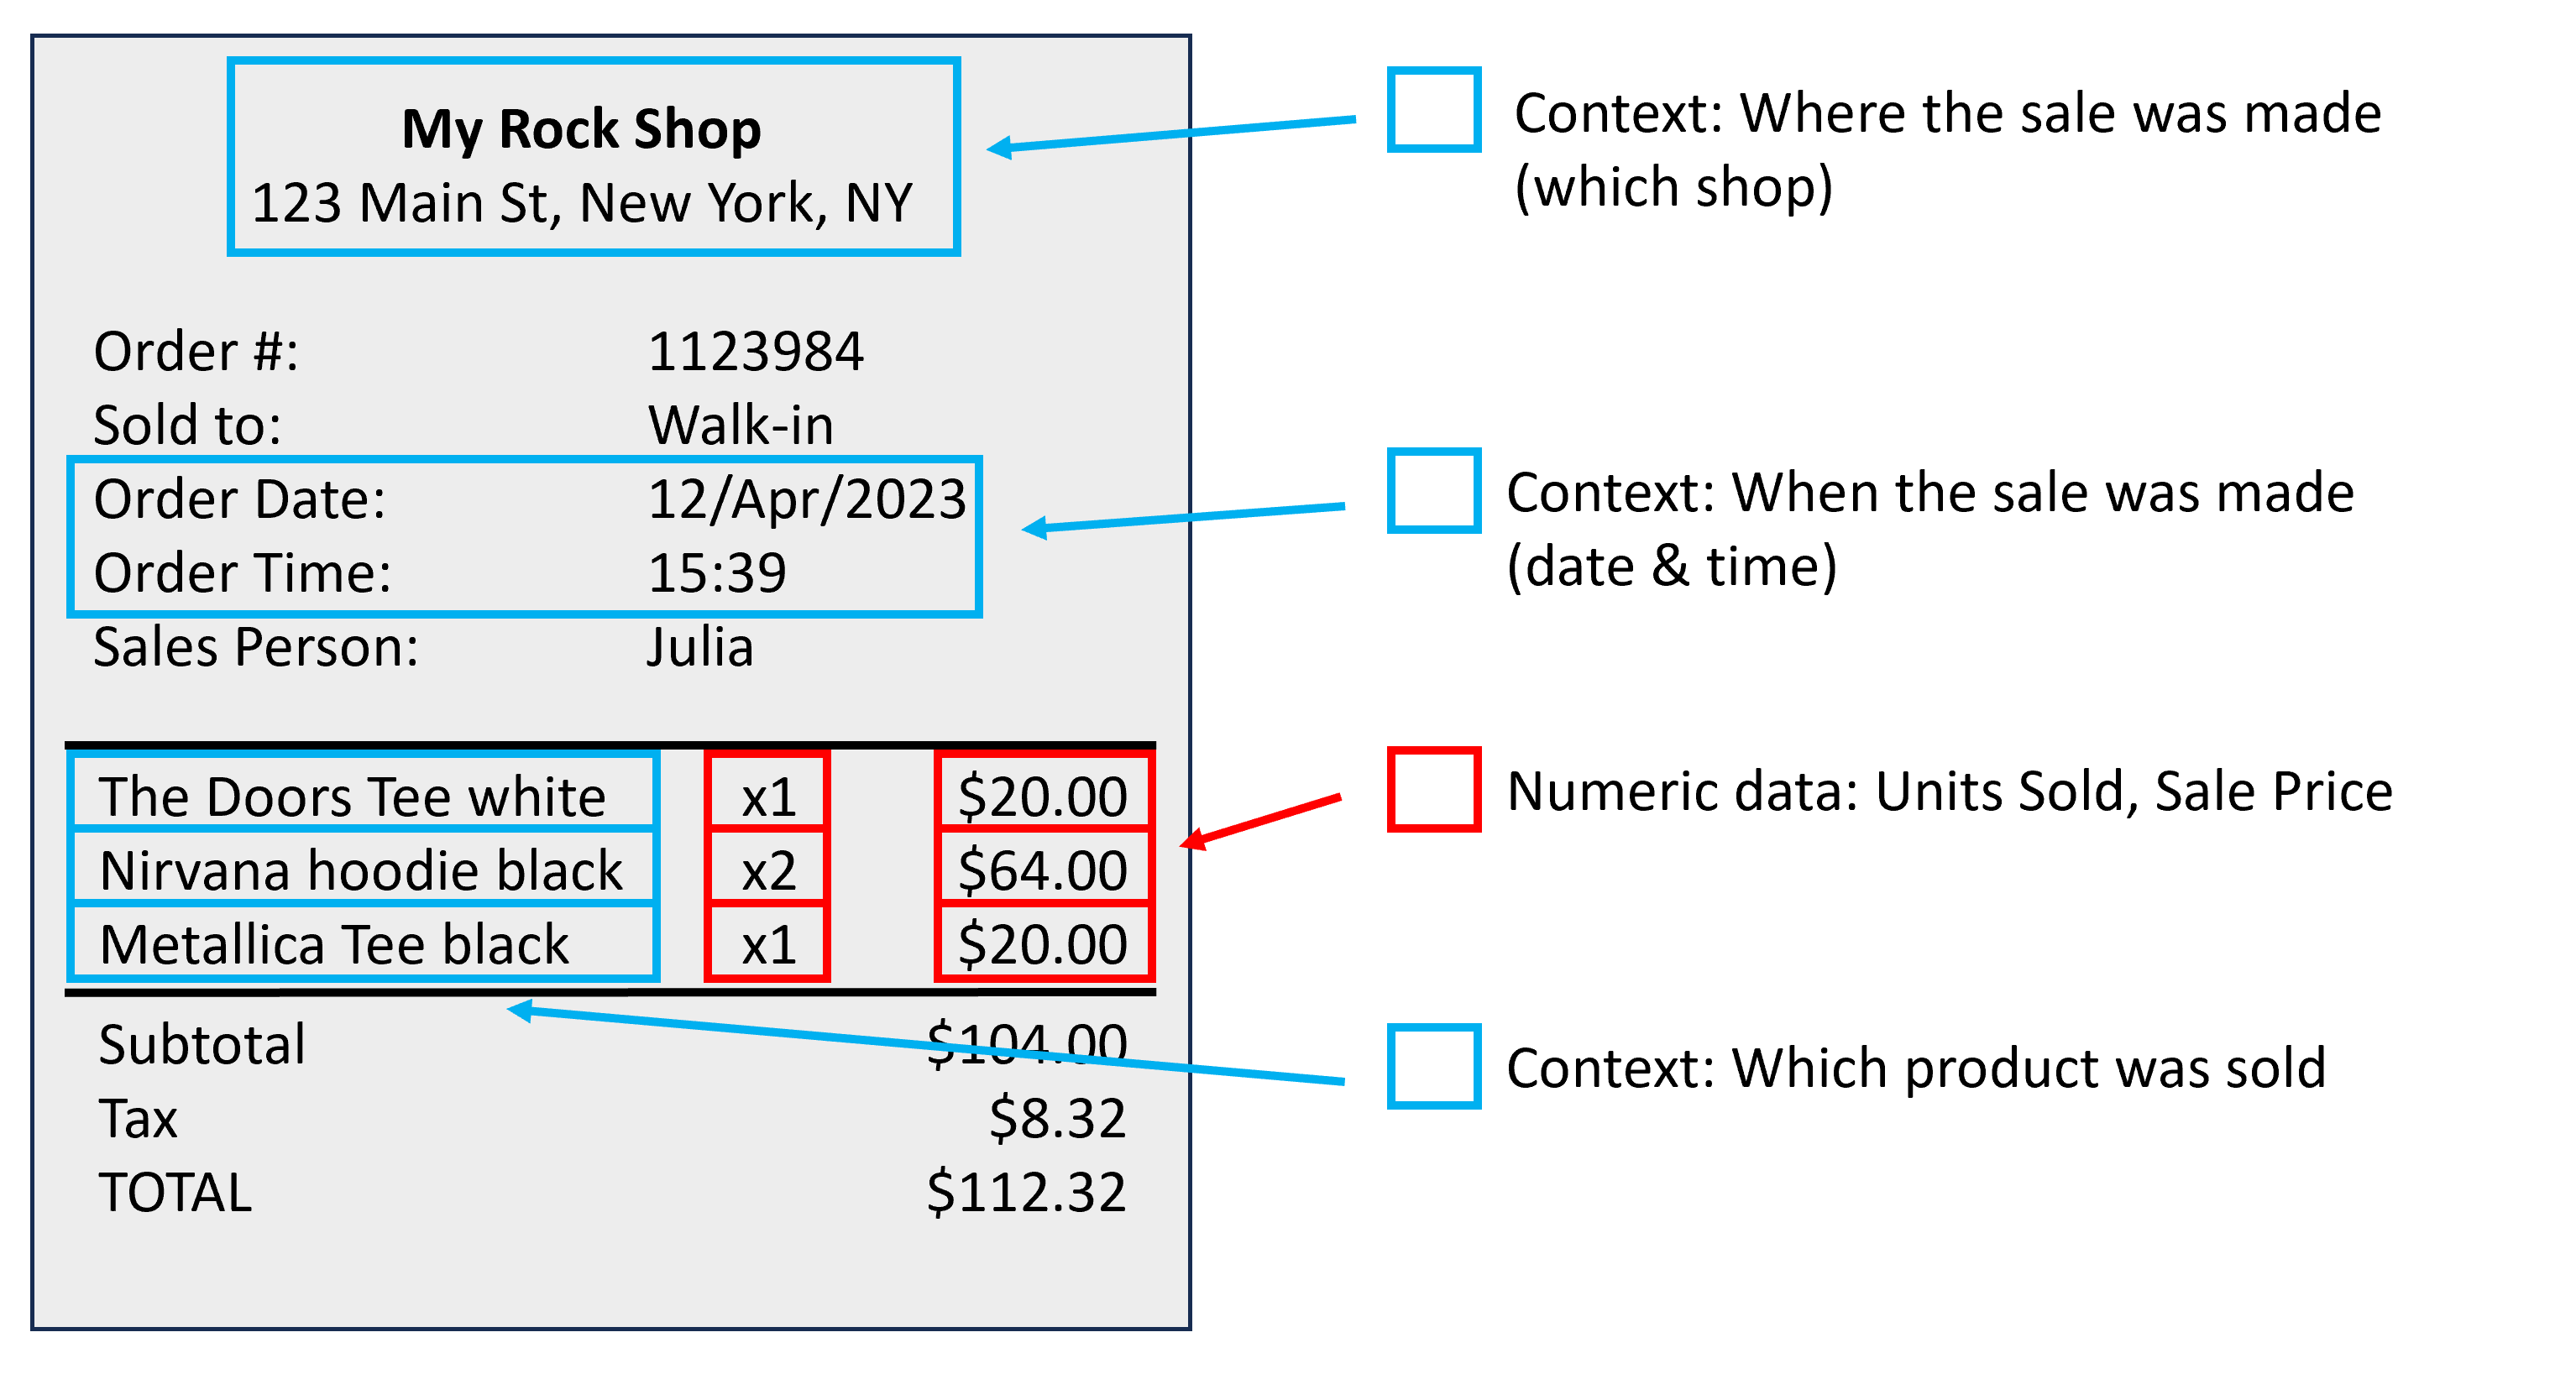
  • Numeric quantifiable data:
    • Number of Units Sold
    • Sale Price
  • Context about the data:
    • Product sold

Image of a sales receipt from a retail store, highlighting the numeric data: Units Sold and Sale Price. It also highlights the contextual data: where the sale was made, date when the sale was made, and which product was sold

Transform and Analyze Data with Microsoft Fabric

Storing event data in tables

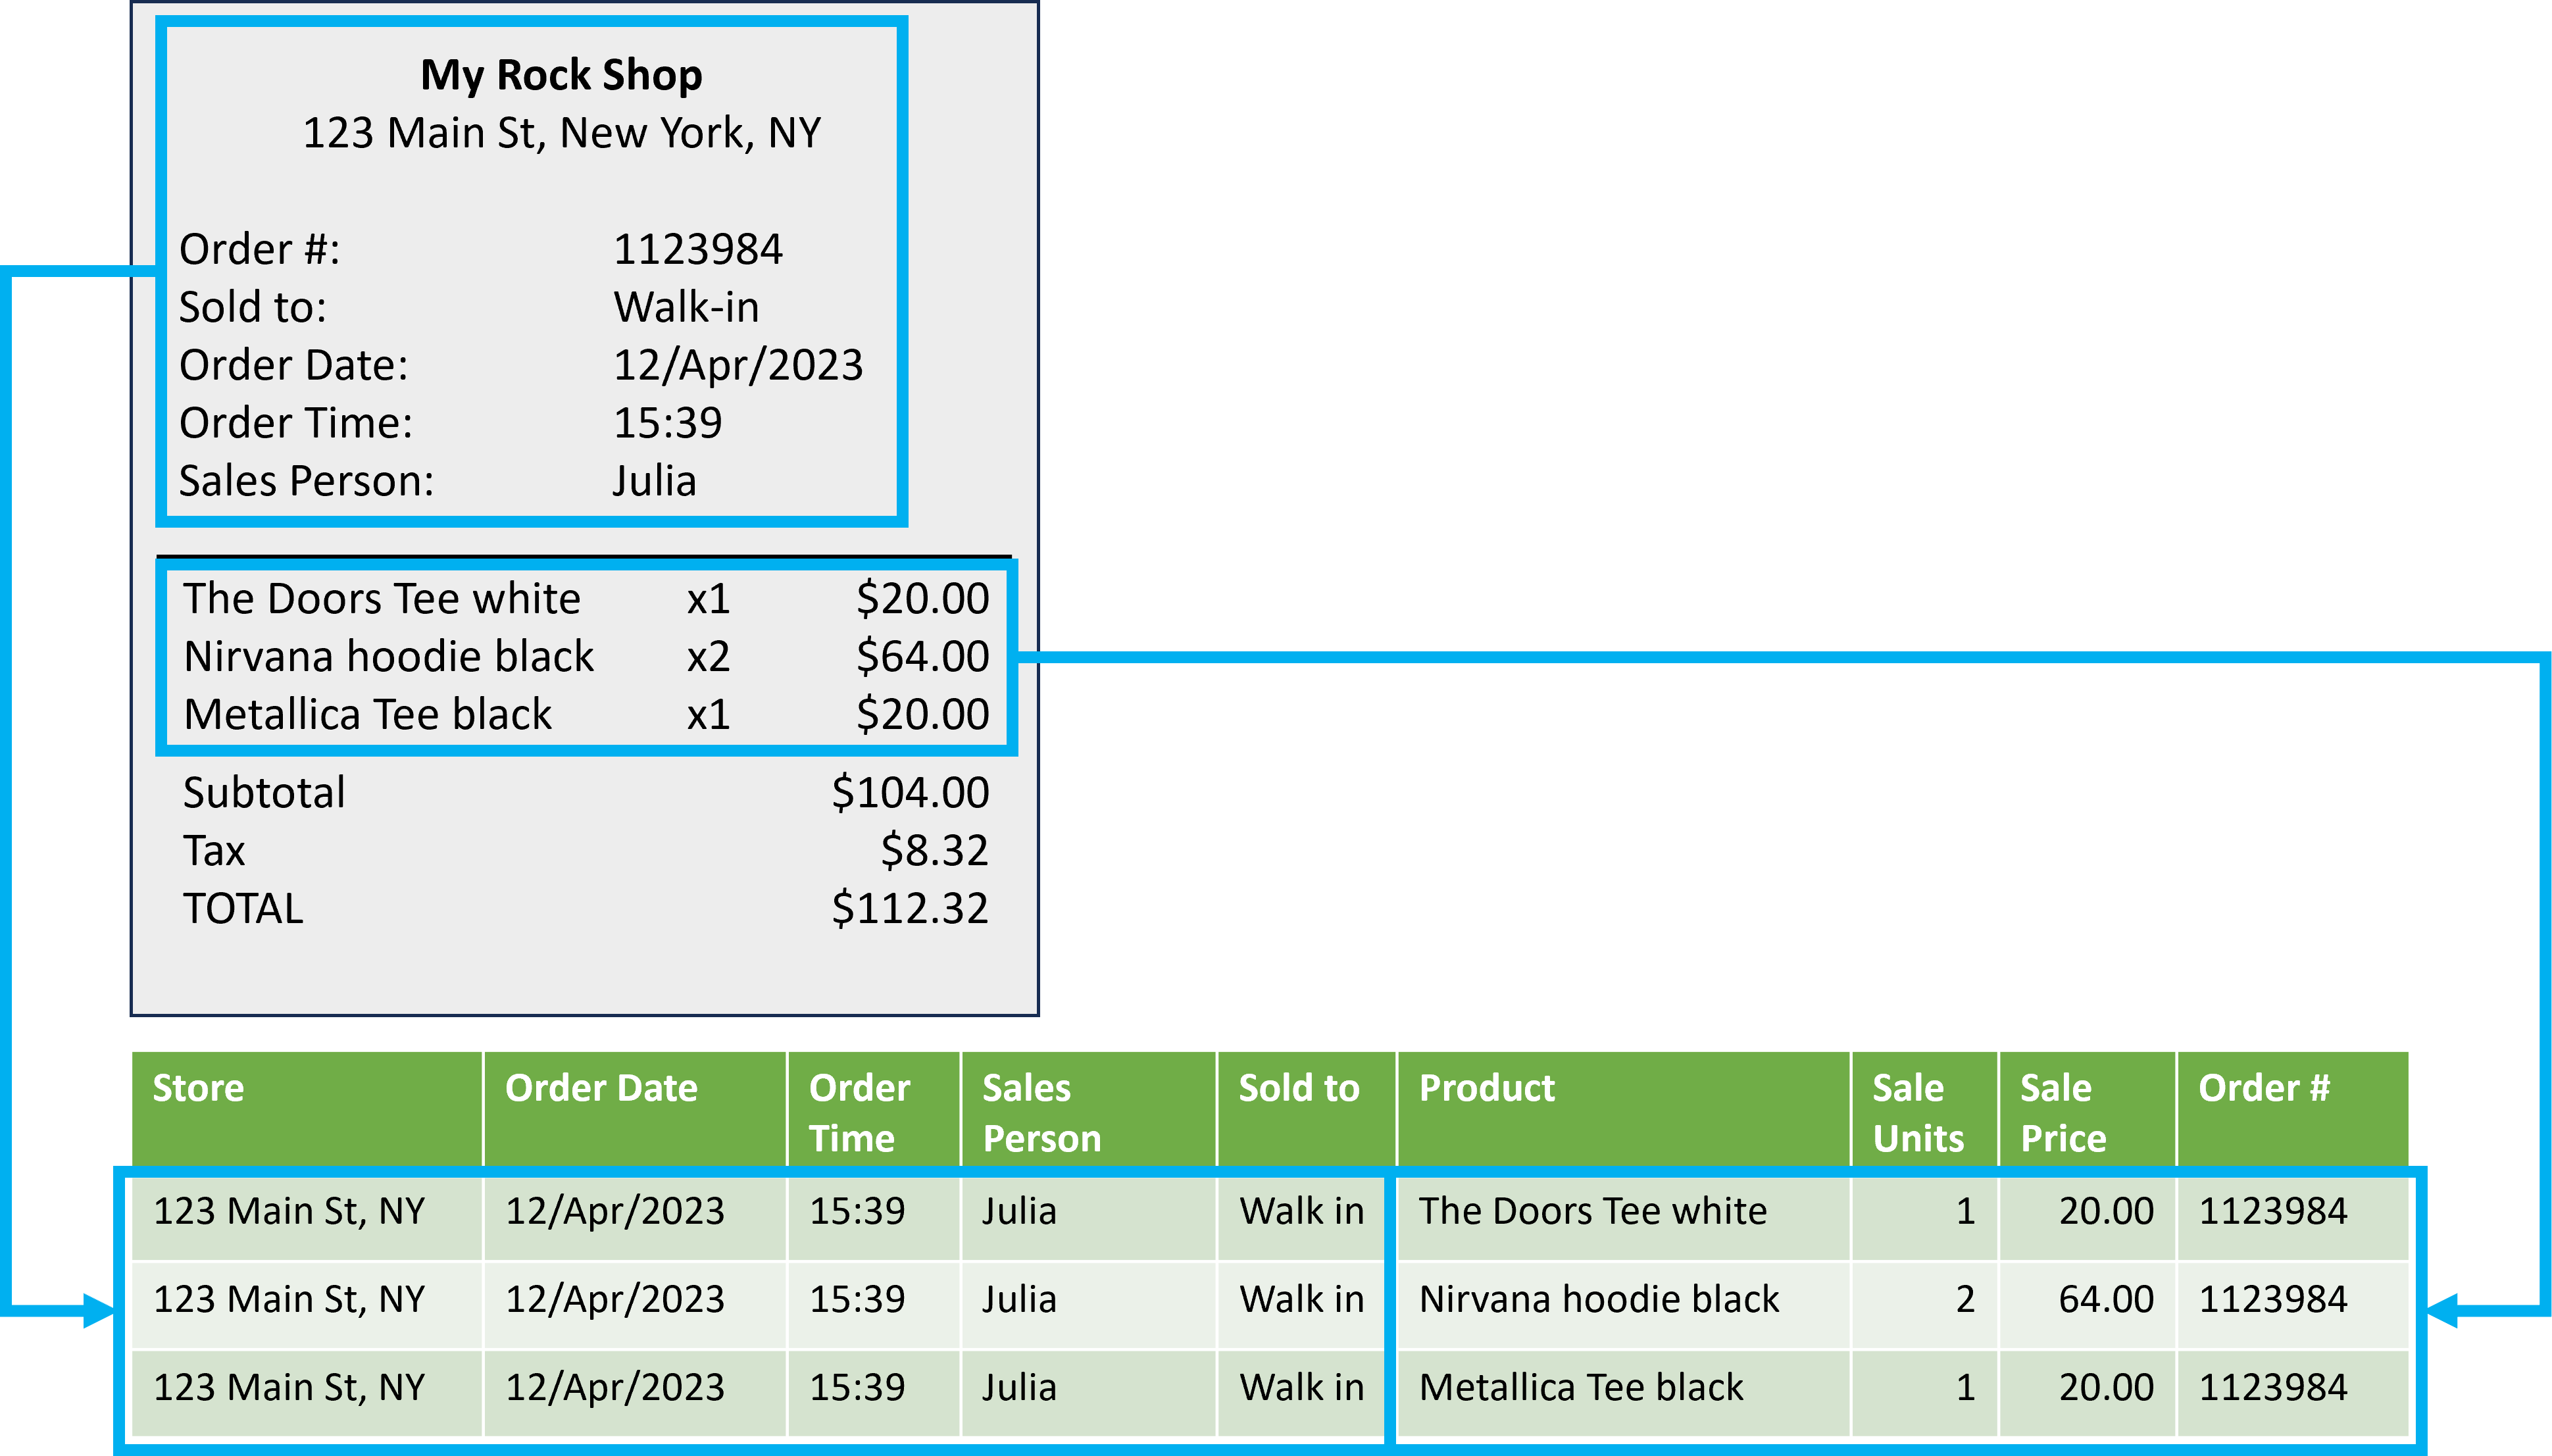
Diagram showing how data in the sales receipt can be mapped to rows in a sales order database table

Transform and Analyze Data with Microsoft Fabric

Storing event data in tables

Fact table showing all entries from the sample receipt

  • Fact table: Contains all transactions.
Transform and Analyze Data with Microsoft Fabric

Storing event data in tables

Fact table showing all entries from the sample receipt, highlighting the columns that relate to the dimensions: Store, Order Date, Order Time, Sales Person, Sold To, Product

  • Fact table: Contains all transactions.
  • Dimensions: Context of the transaction (when, where, what, who).
Transform and Analyze Data with Microsoft Fabric

Storing event data in tables

Fact table showing all entries from the sample receipt, highlighting the columns that relate to the measures: Sale Units, Sale Price

  • Fact table: Contains all transactions.
  • Dimensions: Context of the transaction (when, where, what, who).
  • Measures: Numeric data (how many).
Transform and Analyze Data with Microsoft Fabric

Storing event data in tables

Fact table showing all entries from the sample receipt, highlighting the column for the additional attribute: Order Number

  • Fact table: Contains all transactions.
  • Dimensions: Context of the transaction (when, where, what, who).
  • Measures: Numeric data (how many).
  • Attributes: Additional information about the transaction record.
Transform and Analyze Data with Microsoft Fabric

Normalization

Fact table, highlighting the Store column containing the name of the store for each record

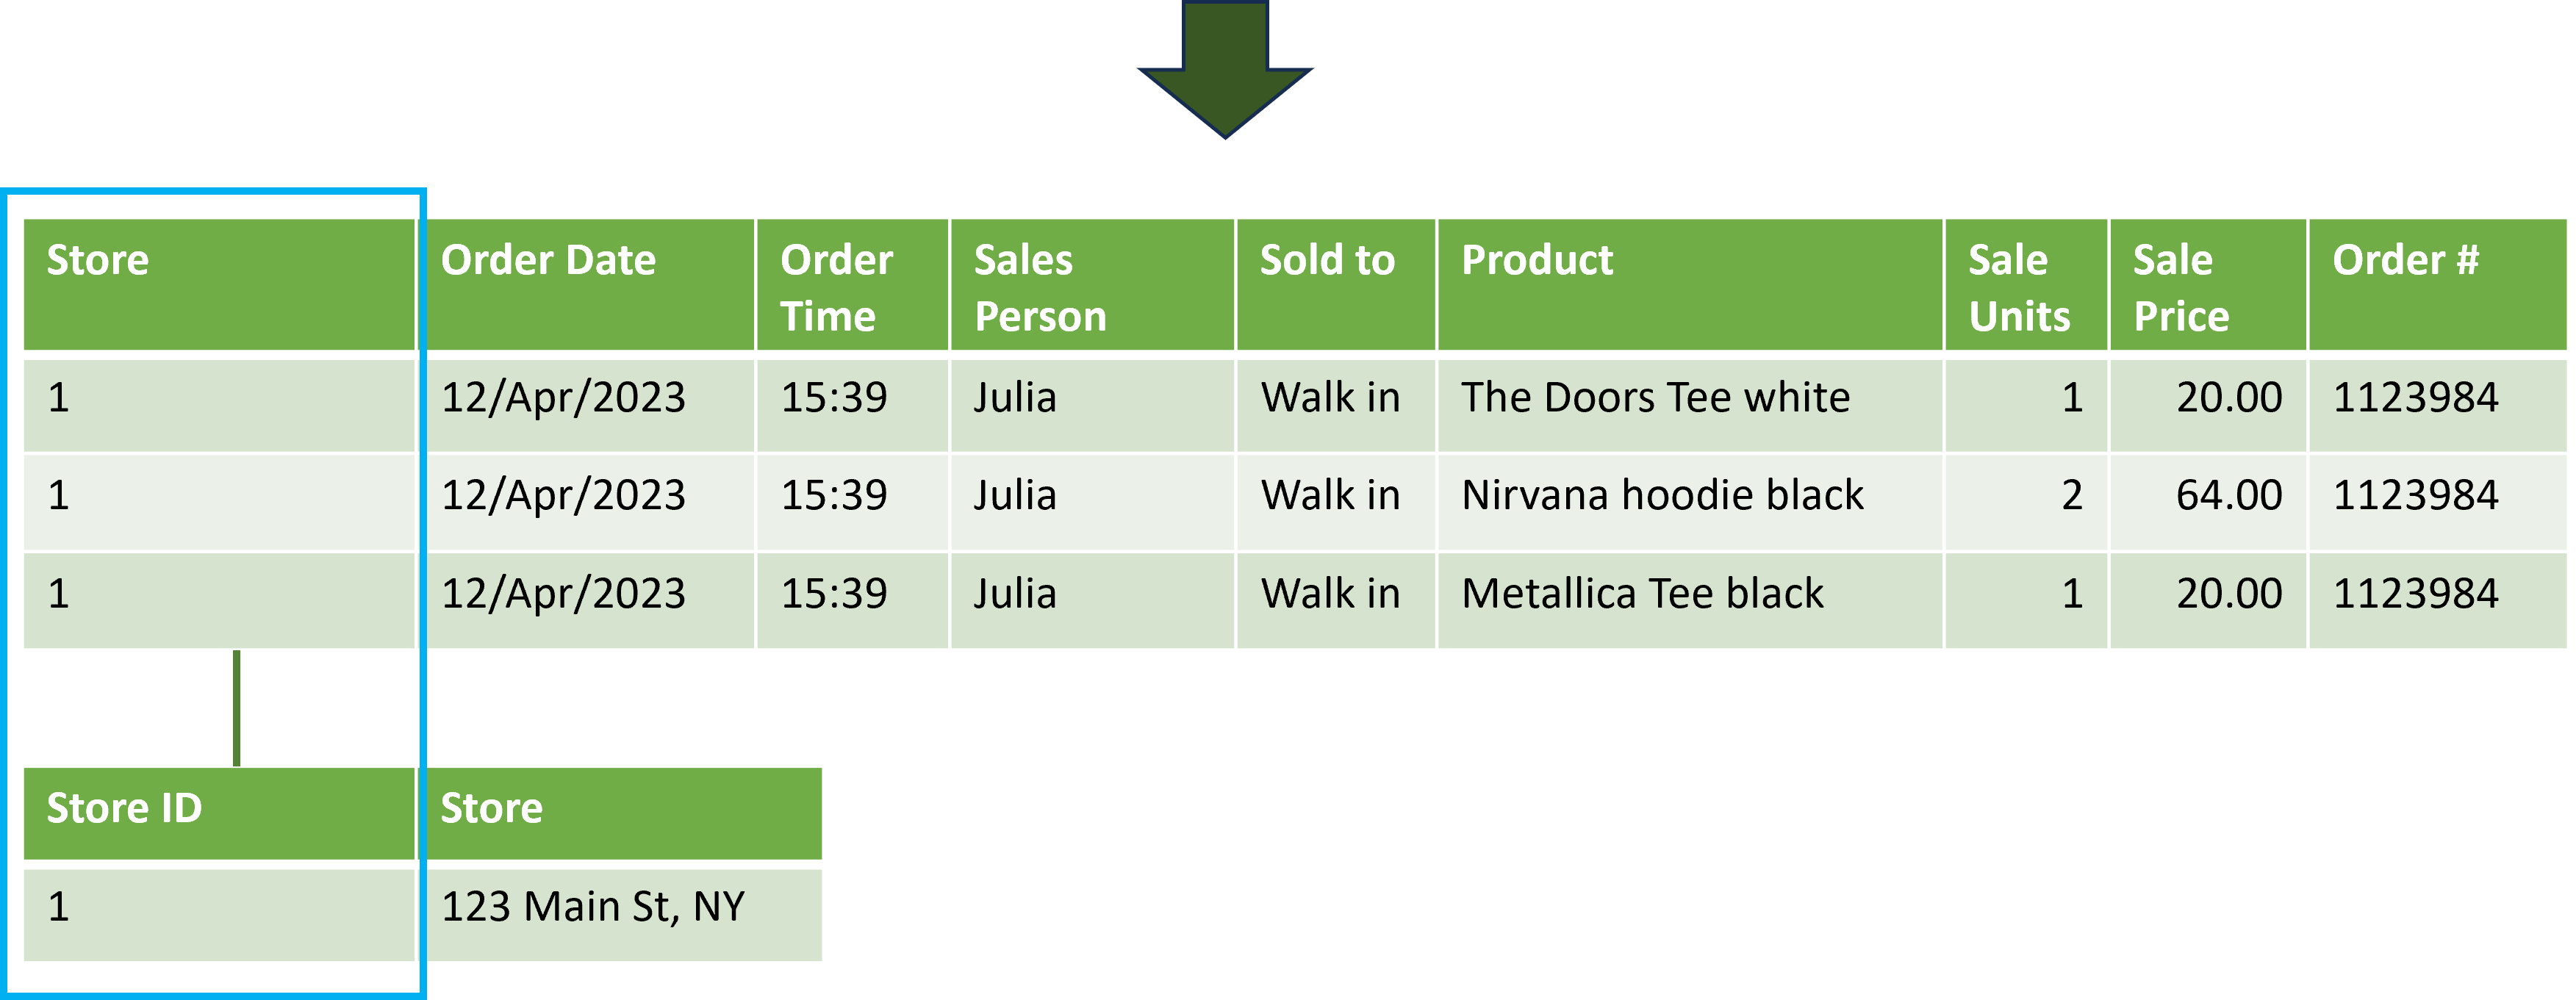
Fact table with one dimension table, highlighting that the Store column of the fact table now contains only codes of the stores,and the actual names of the stores are in a separate dimension table

Transform and Analyze Data with Microsoft Fabric

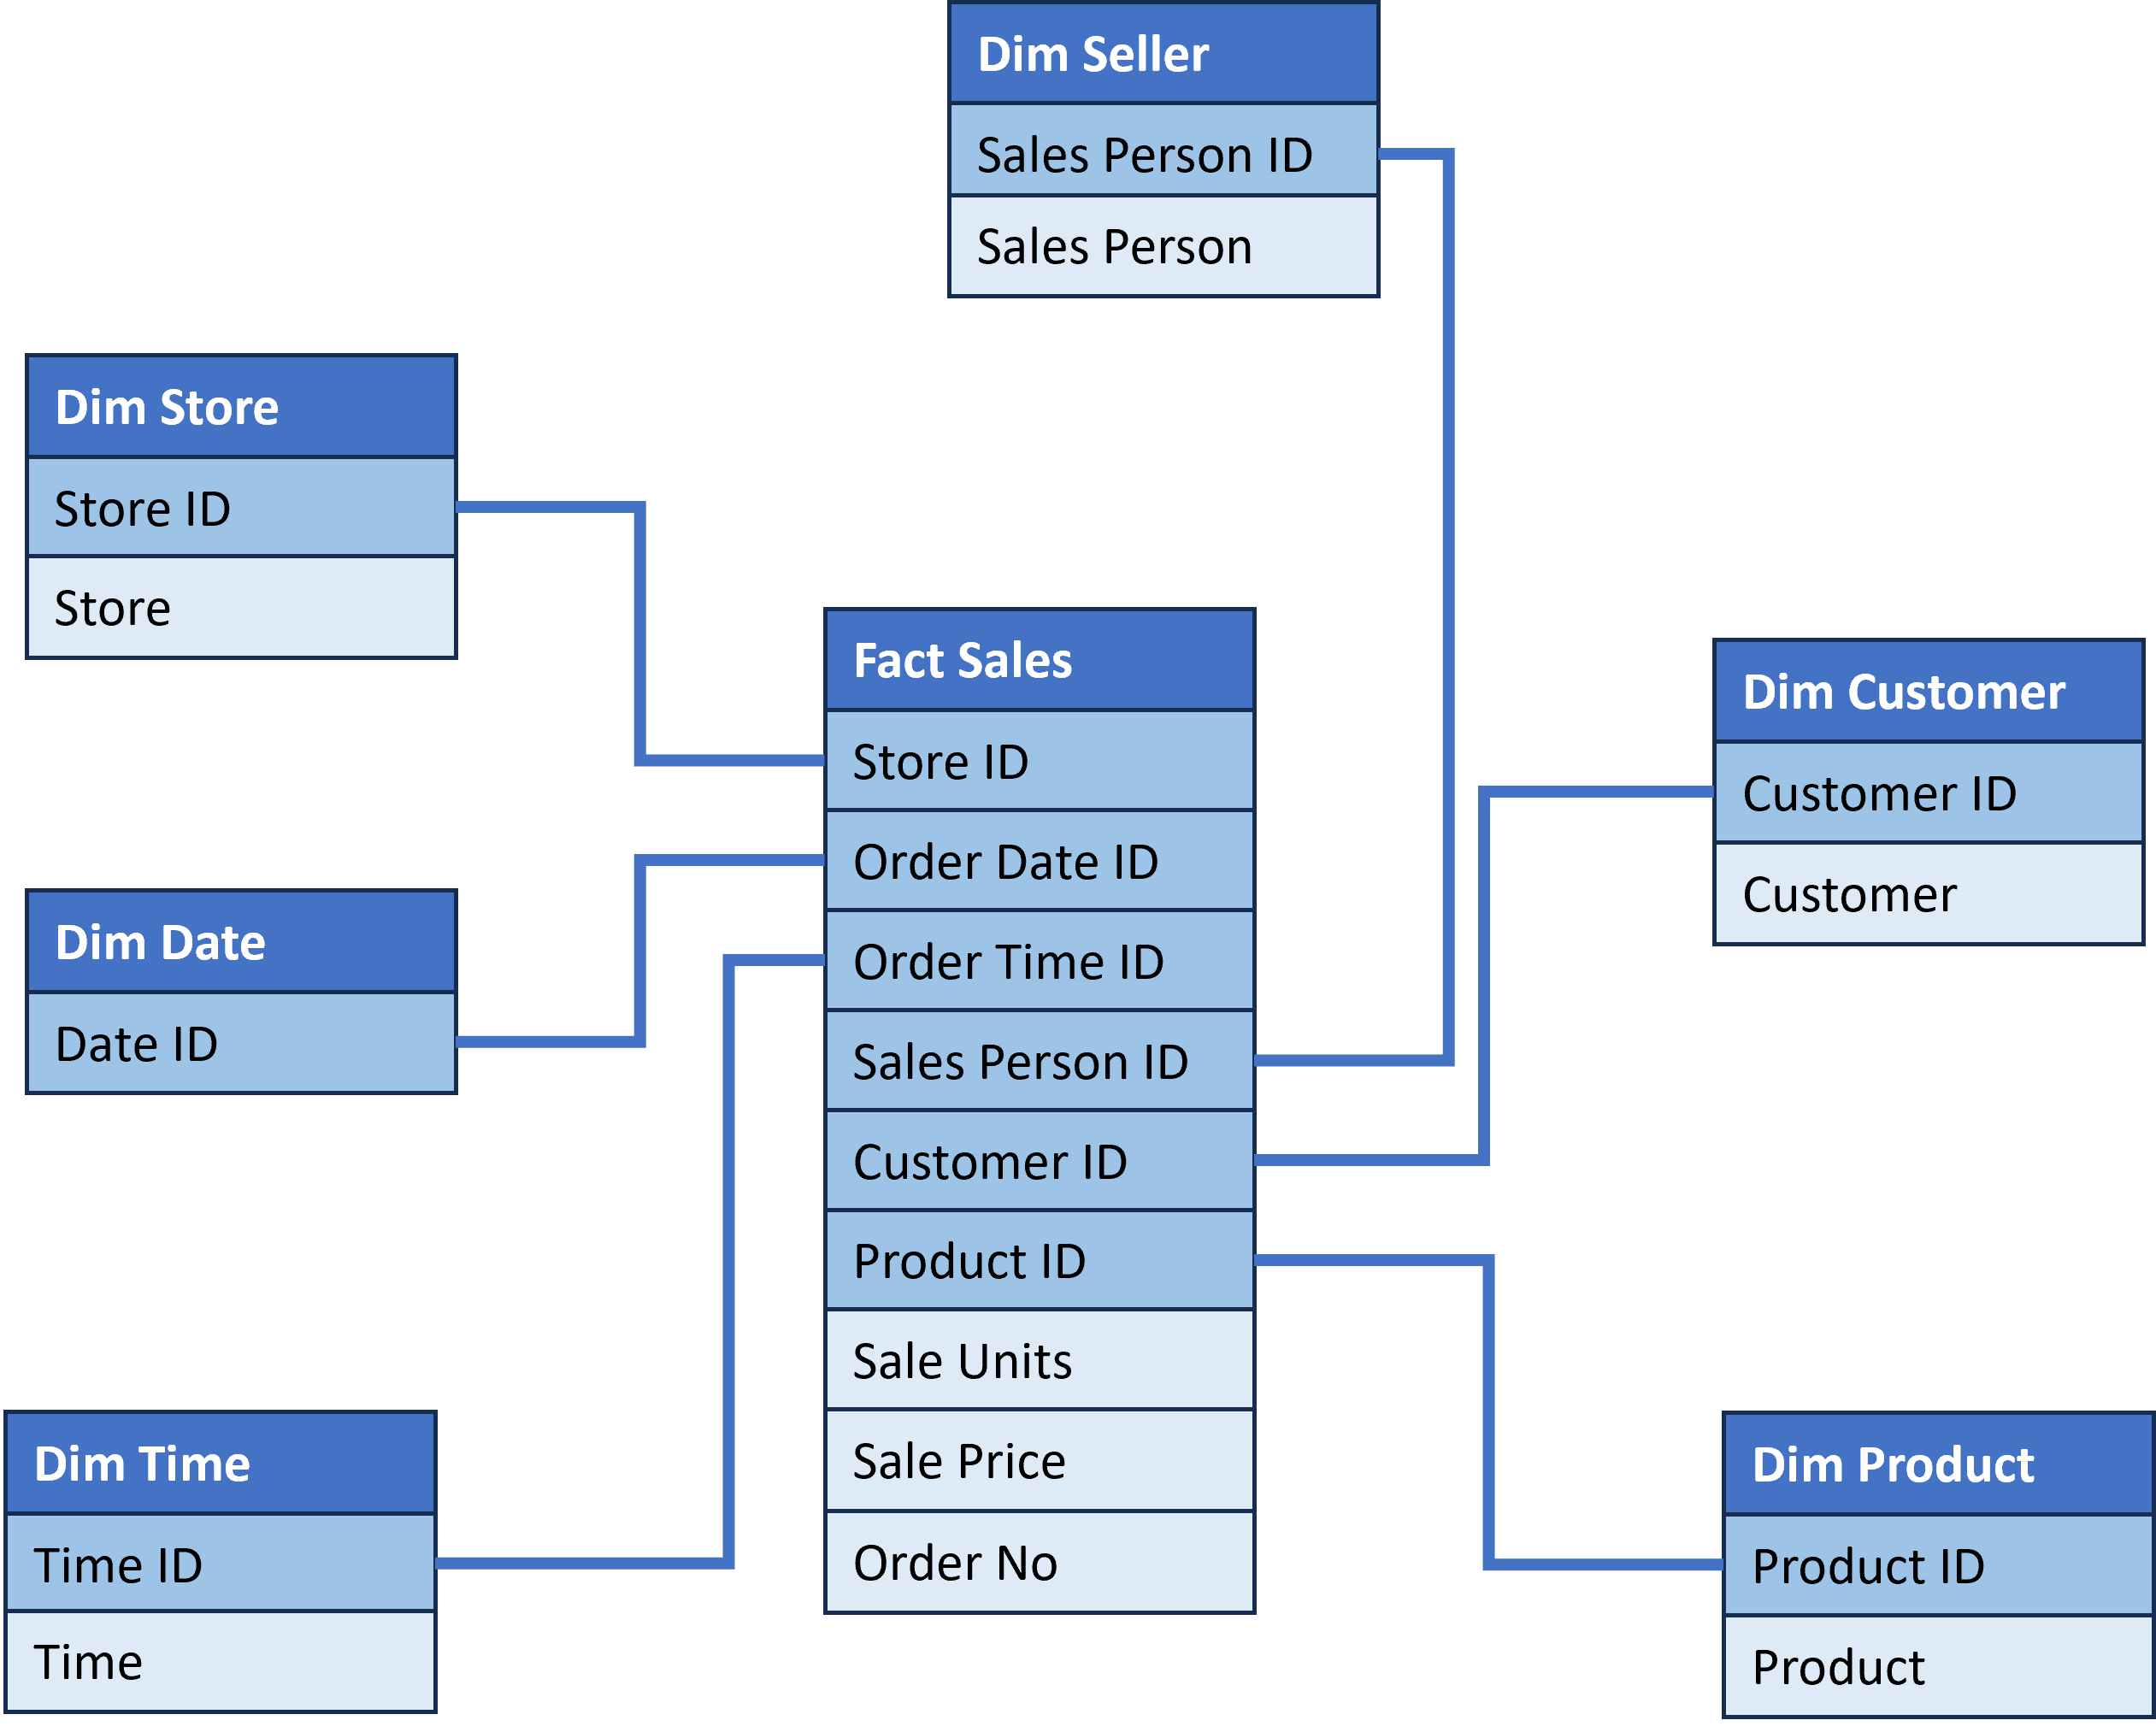
Fact Tables + Dimension Tables

Fact table with Dimensions

Transform and Analyze Data with Microsoft Fabric

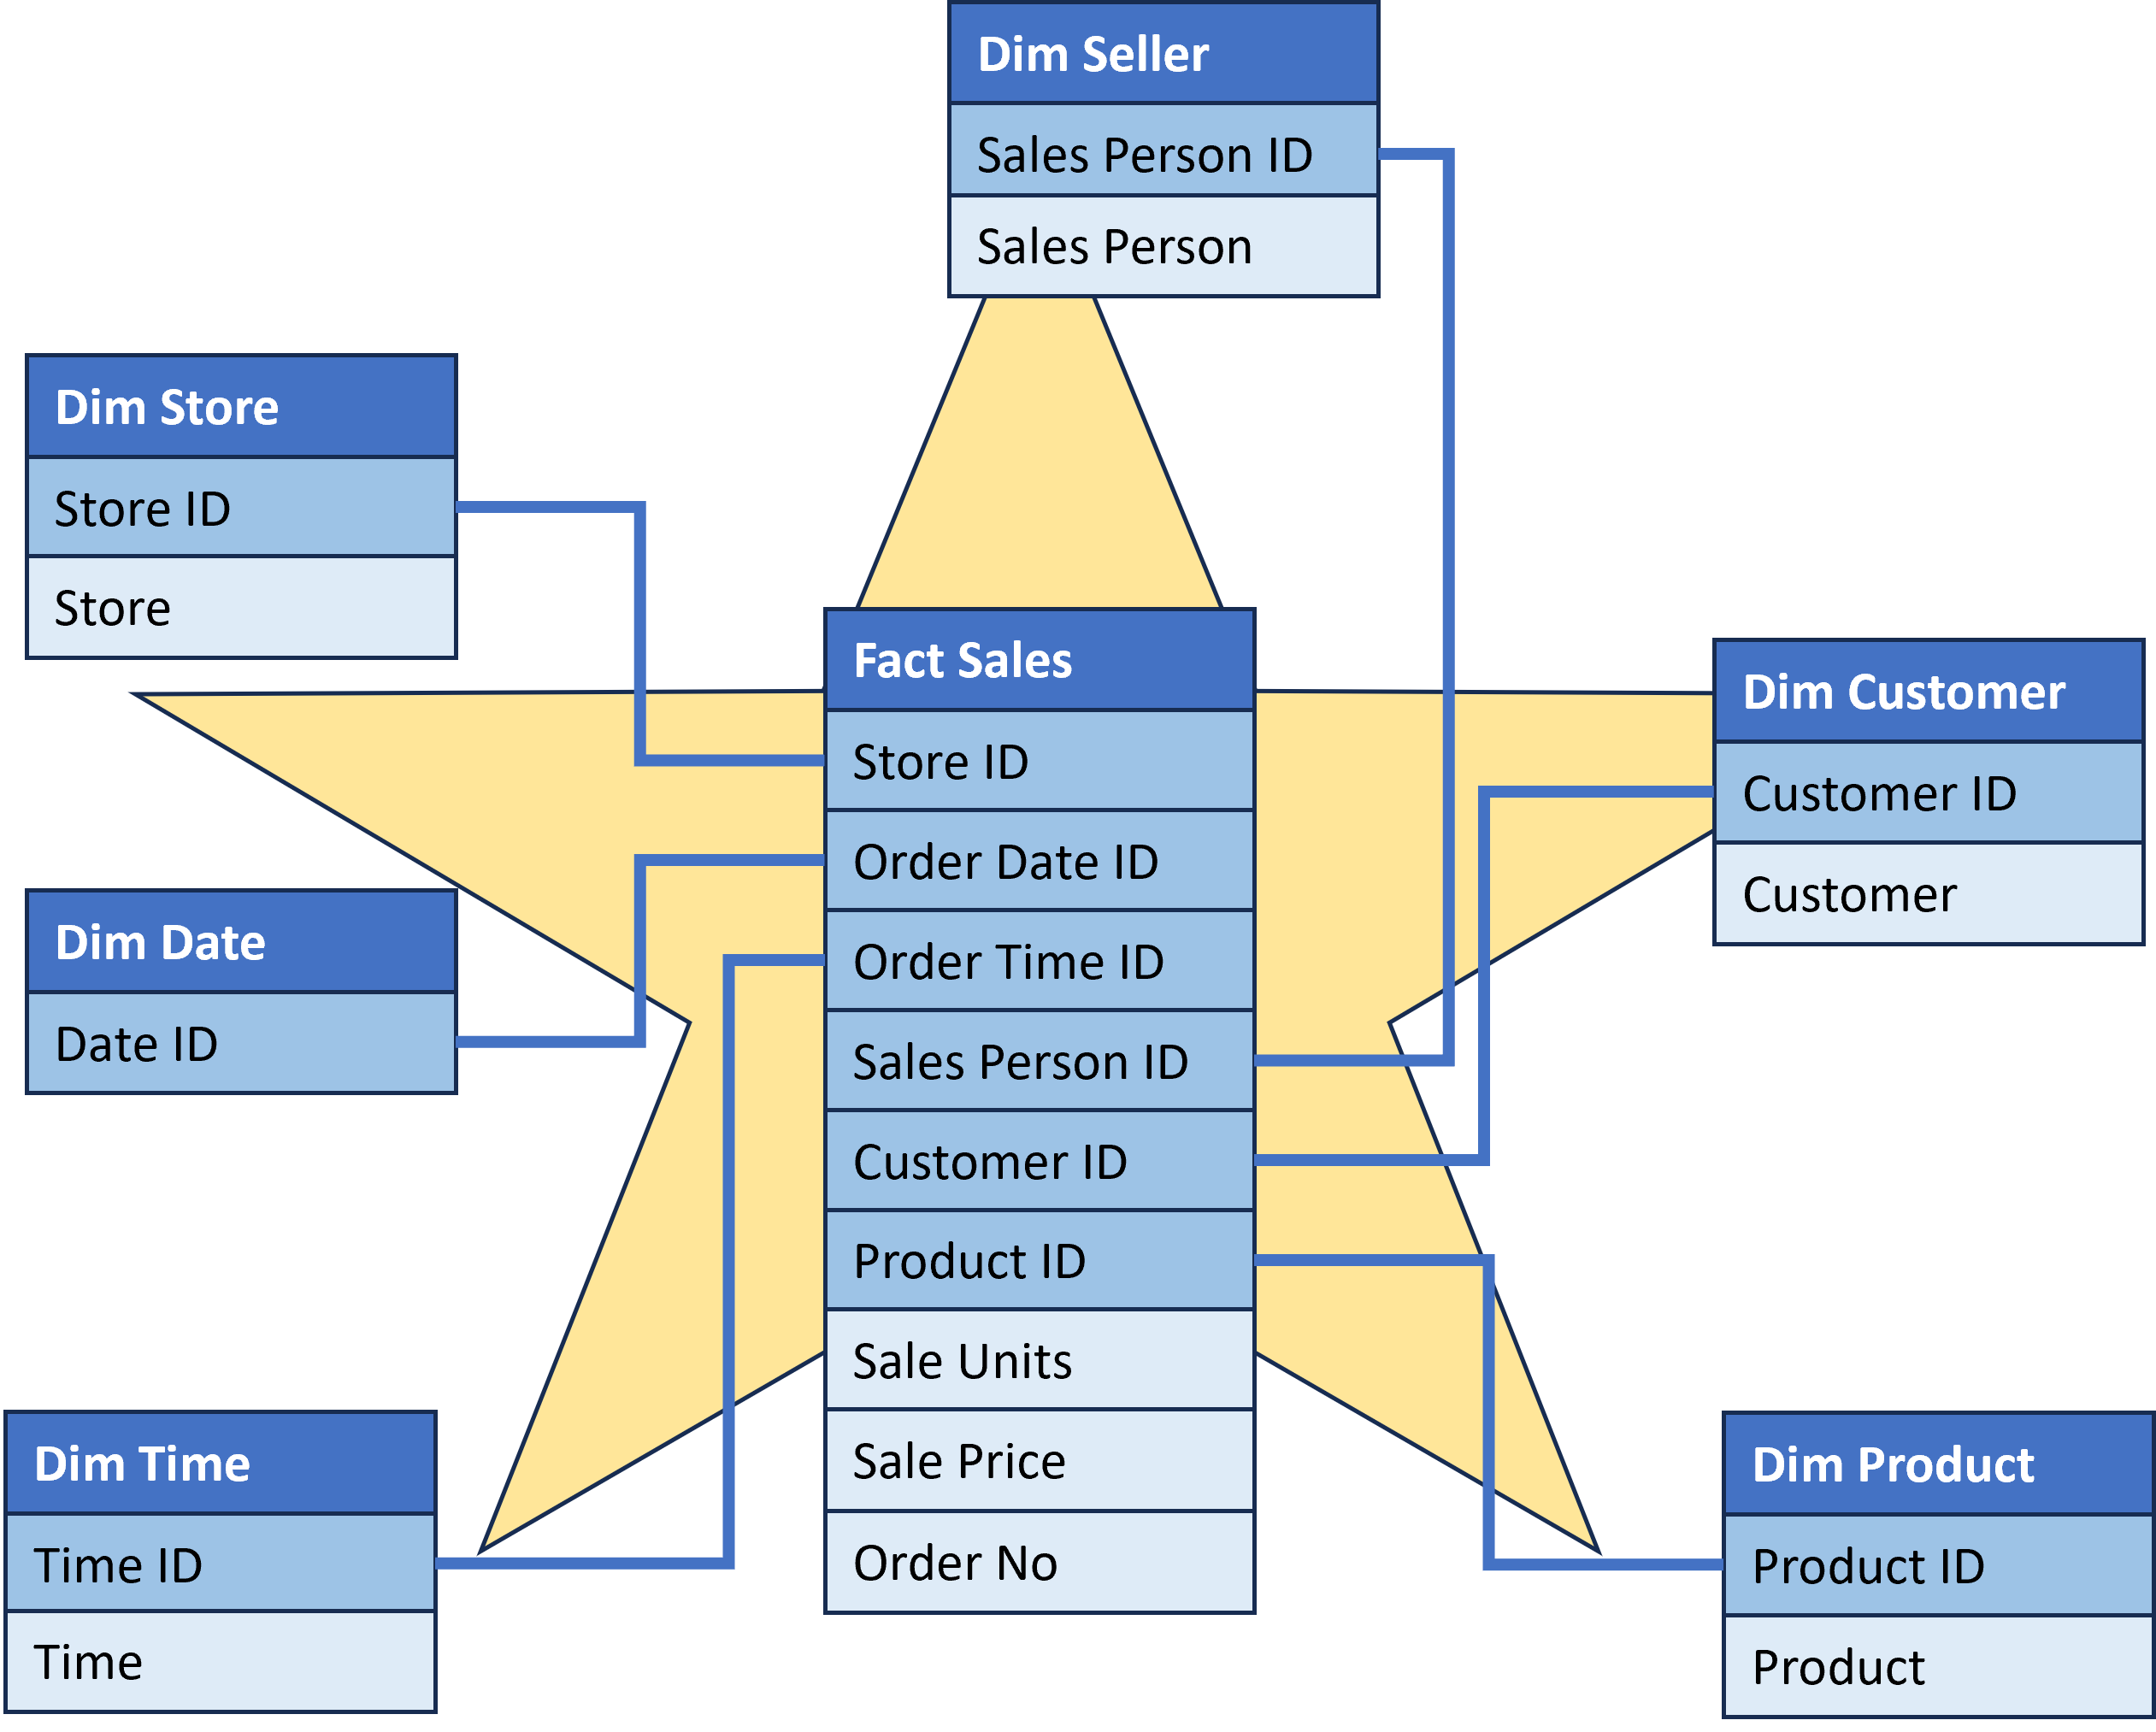
Star Schema

Sample Star Schema

Transform and Analyze Data with Microsoft Fabric

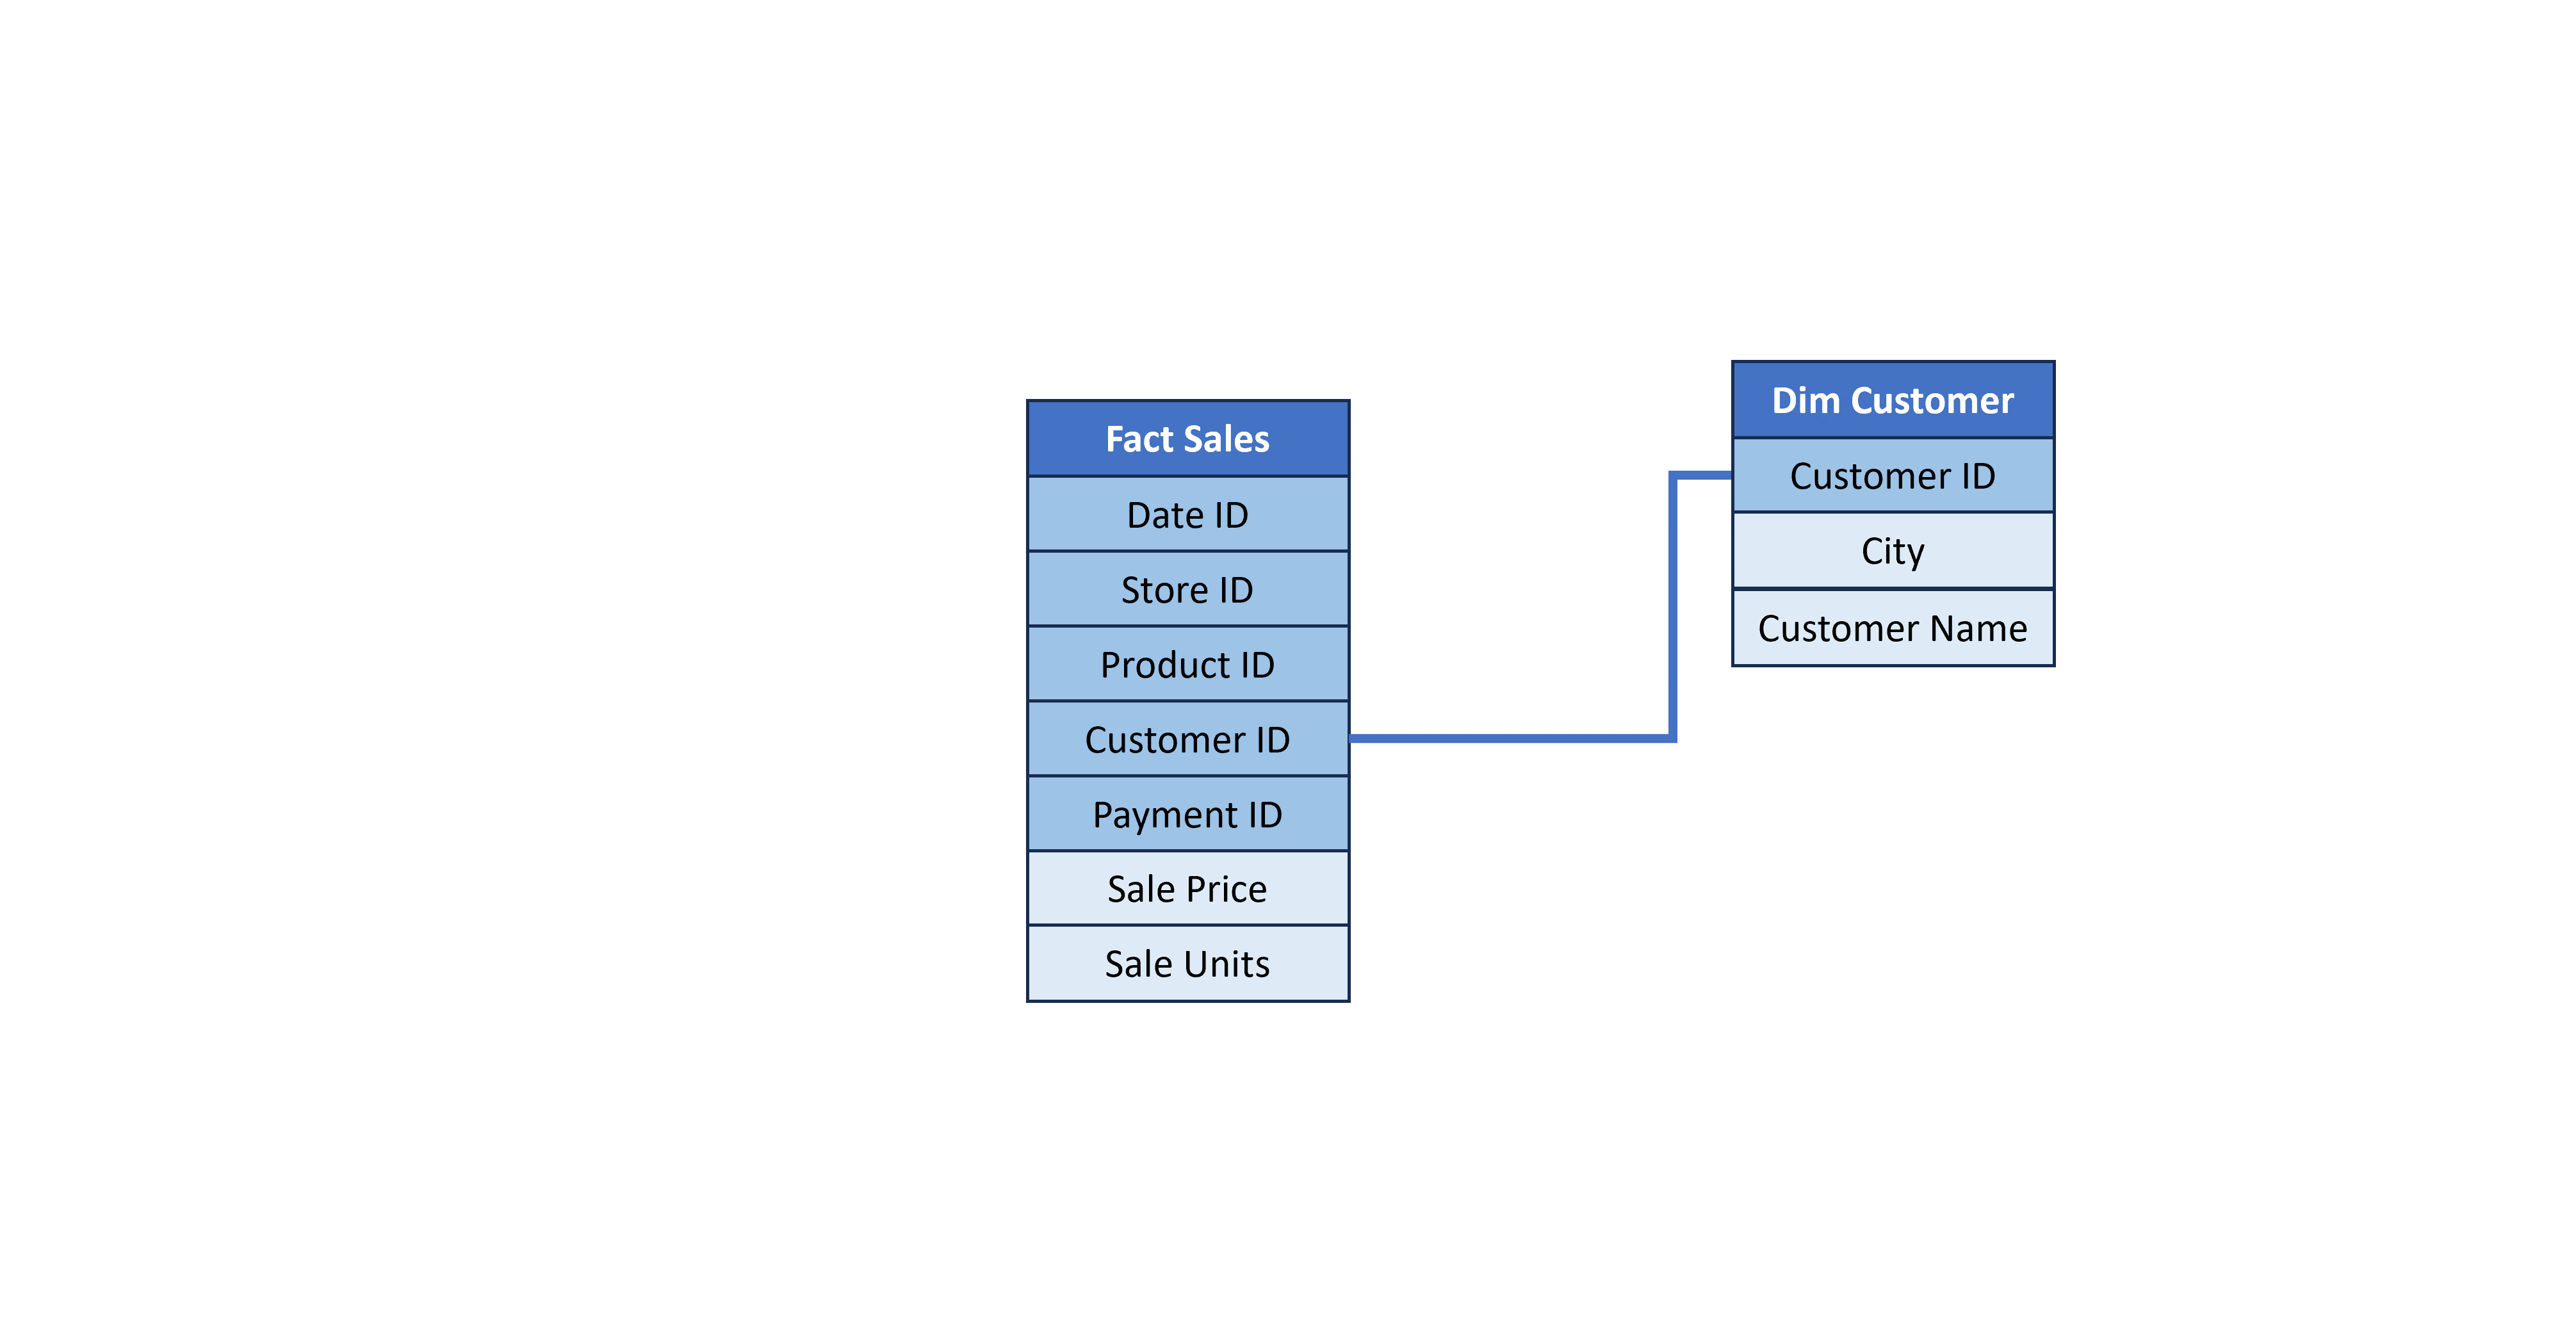
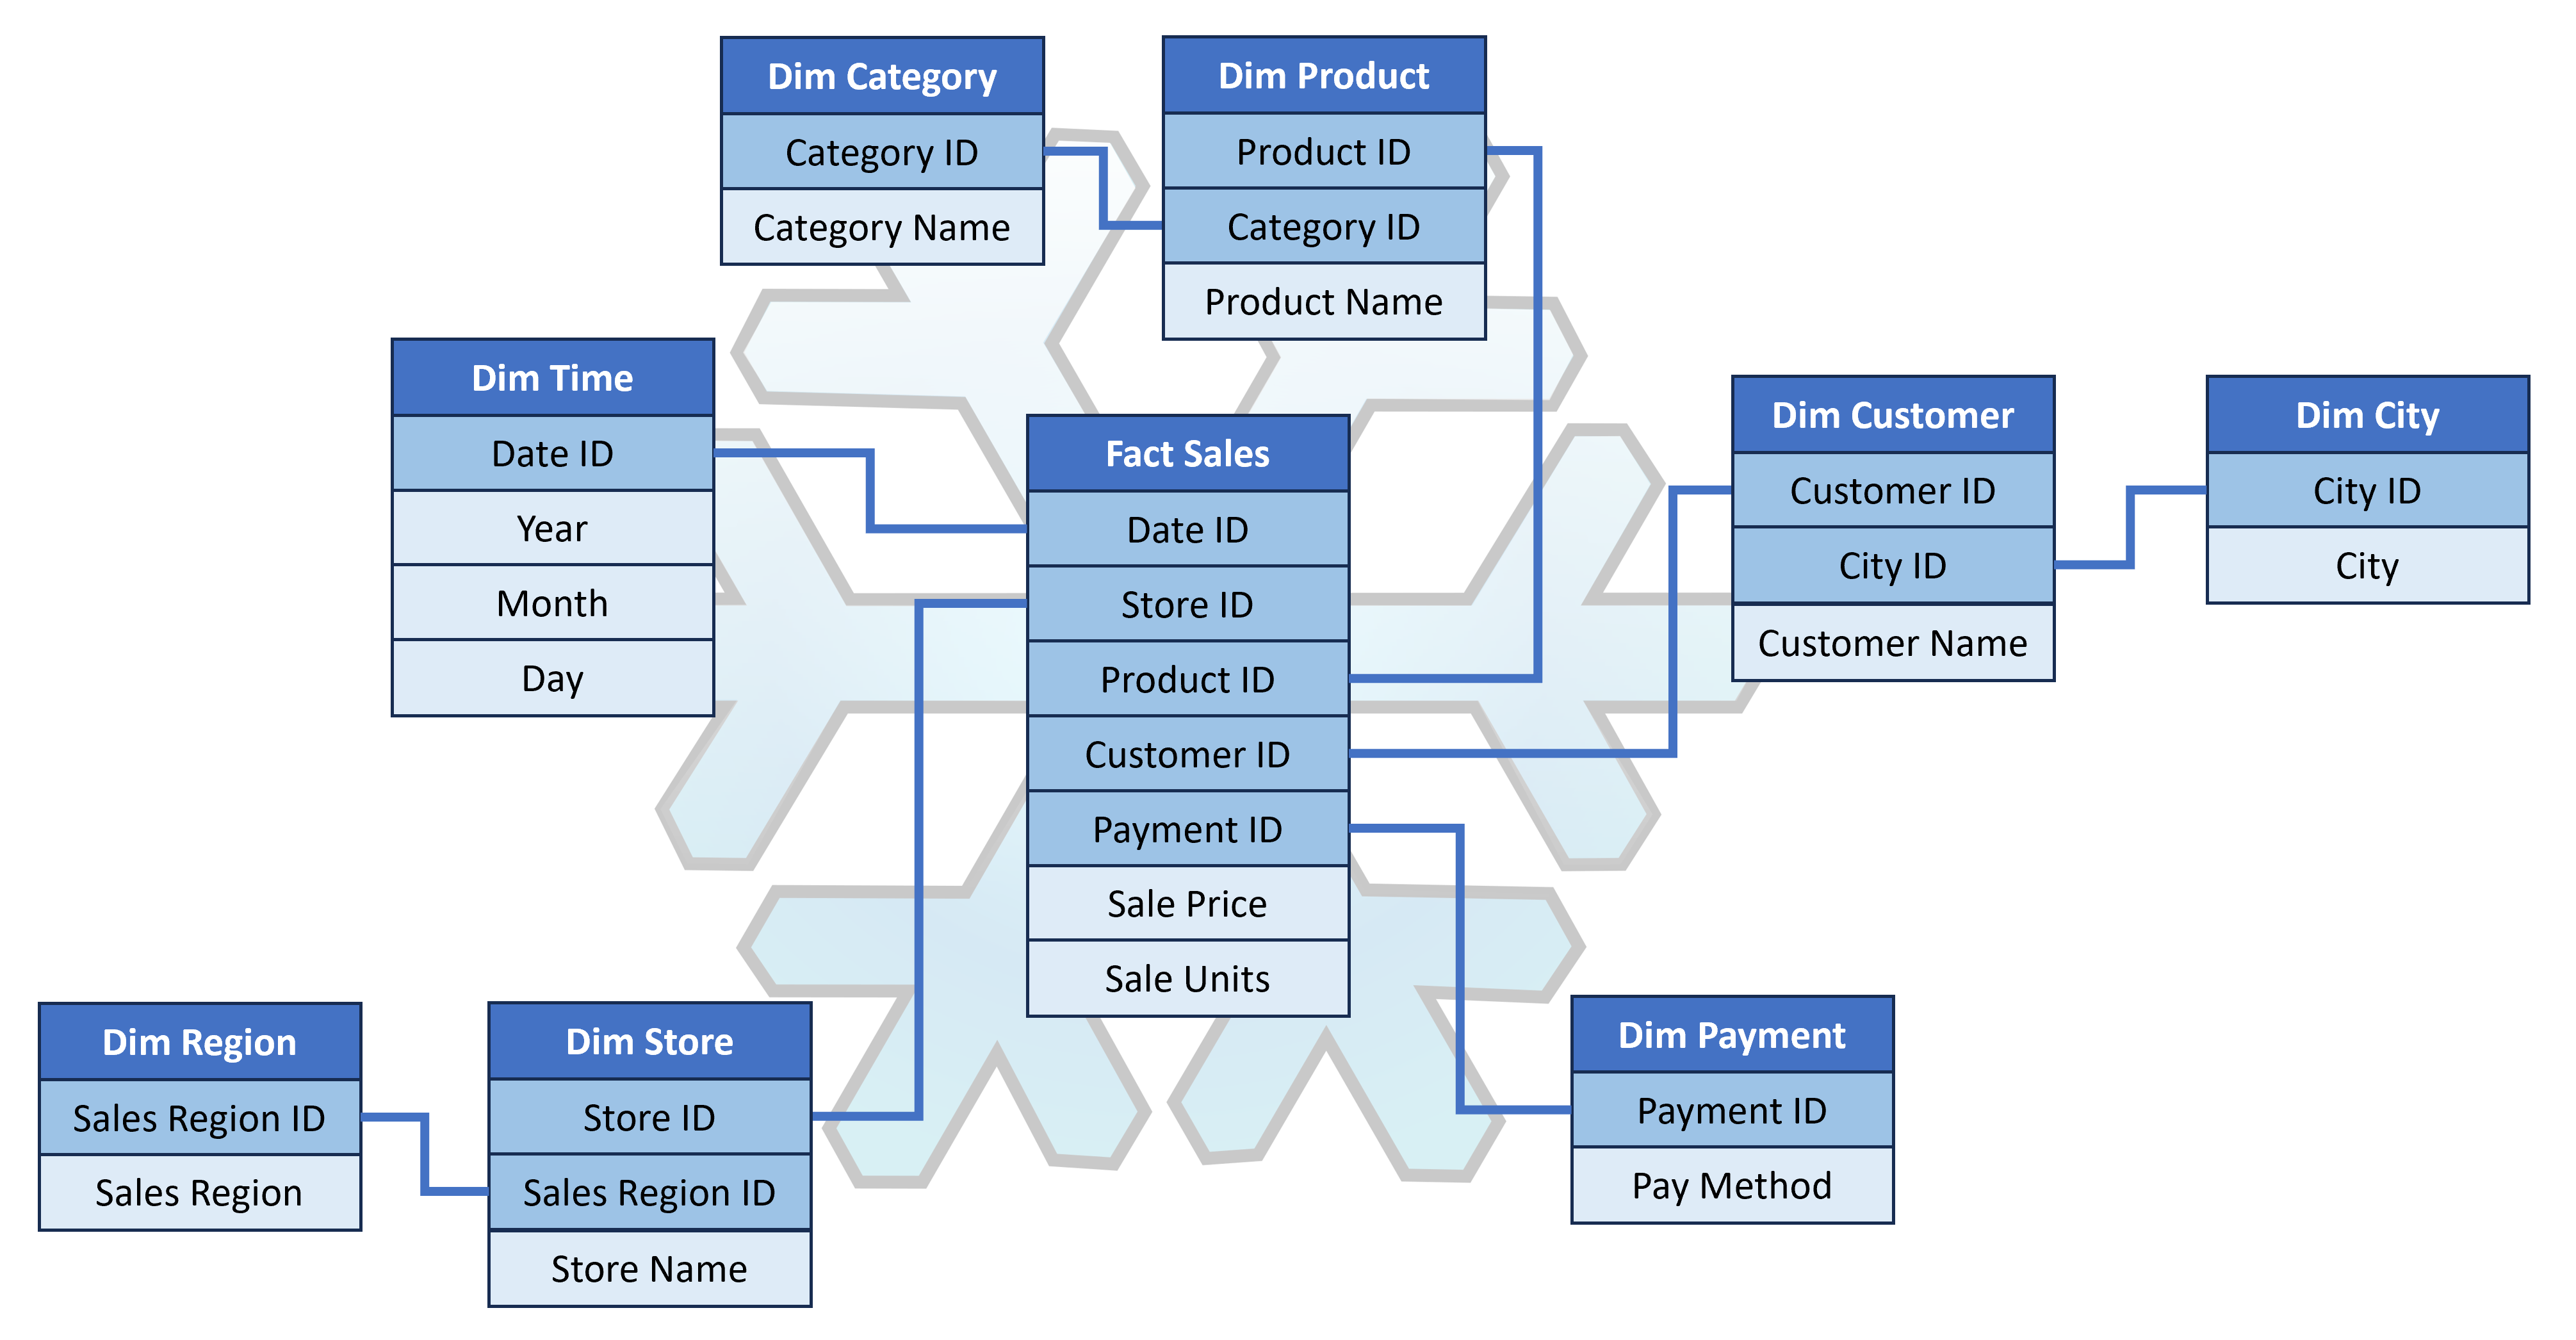
Snowflake Schema

Sample Snowflake Schema

Transform and Analyze Data with Microsoft Fabric

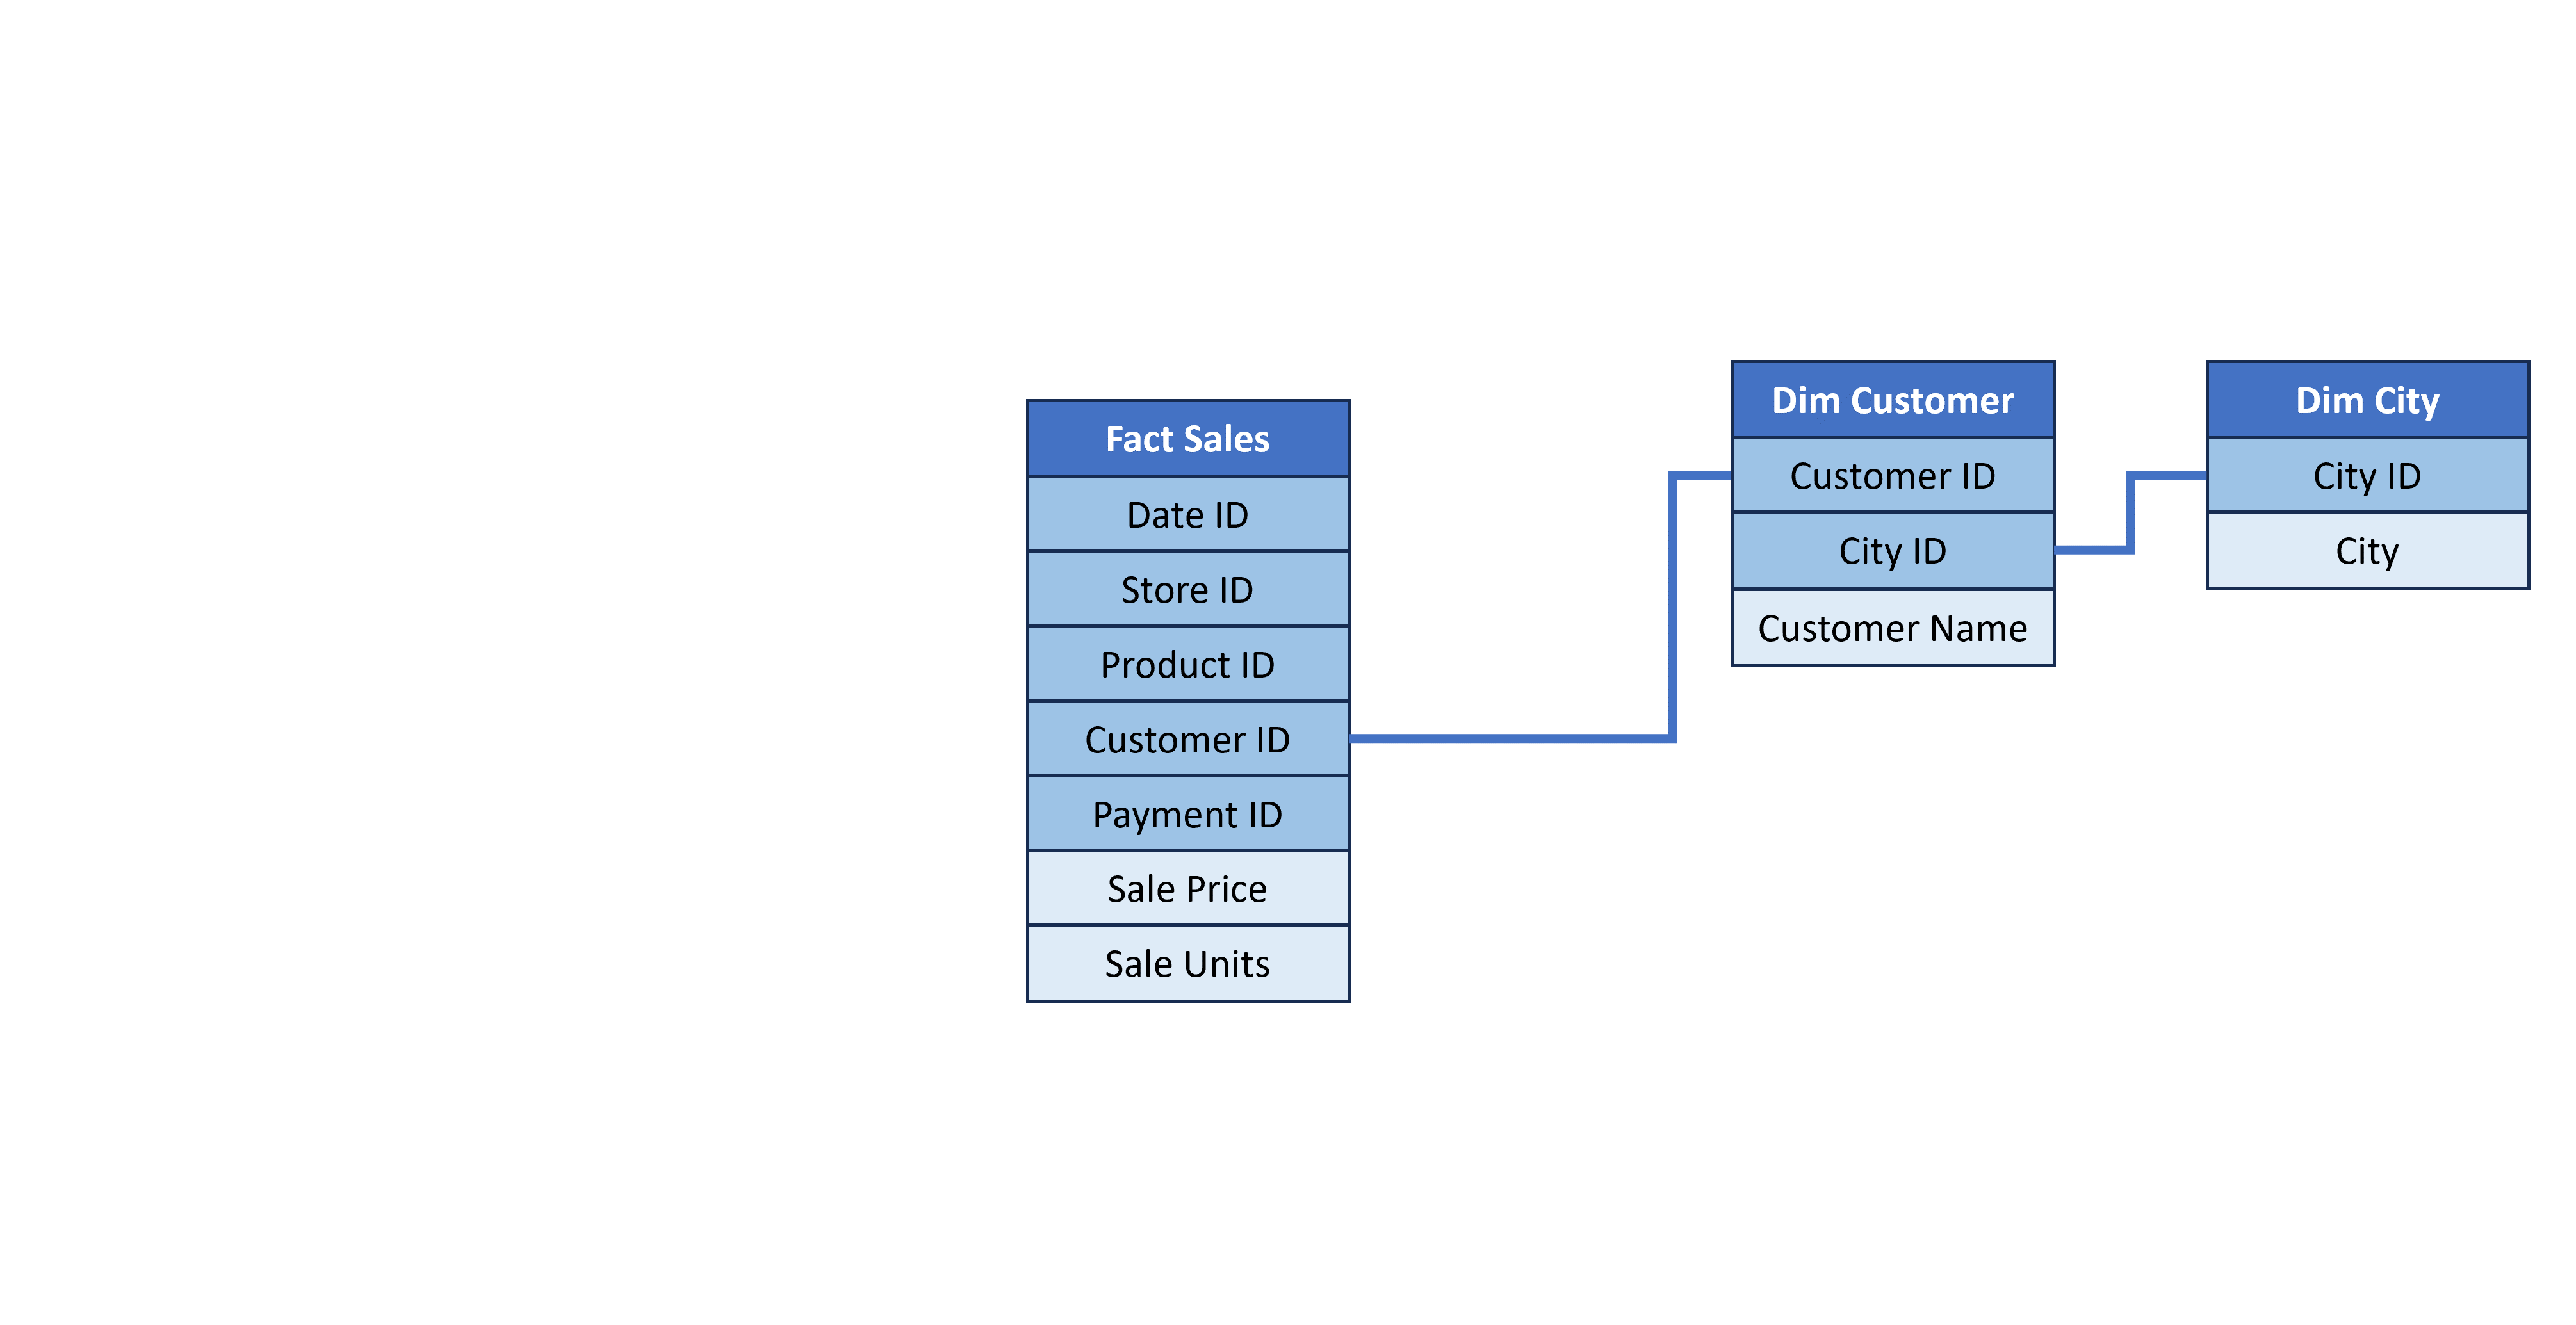
Snowflake Schema

Sample Snowflake Schema

Transform and Analyze Data with Microsoft Fabric

Snowflake Schema

Sample Snowflake Schema

Transform and Analyze Data with Microsoft Fabric

Star Schema vs Snowflake Schema

Key differences

Area Star Schema Snowflake Schema
Storage More storage required Less storage required
Normalization Denormalized (One table per dimension) Normalized (Multiple tables per dimension)
Model Complexity Lower Higher
Query performance Fewer JOINs required, resulting in faster query performance More JOINs required, resulting in slower query performance


Choose the model most suitable for your needs. Generally, Star Schema is preferred because it results in simpler, faster models.

Transform and Analyze Data with Microsoft Fabric

Let's practice!

Transform and Analyze Data with Microsoft Fabric

Preparing Video For Download...