Special Dimension Scenarios
Transform and Analyze Data with Microsoft Fabric

Luis Silva
Solution Architect - Data & AI
Date dimension
- Date field is generally present in fact tables
- Date dimension is the most commonly used dimension for analysis
- Supports filtering and aggregating by date
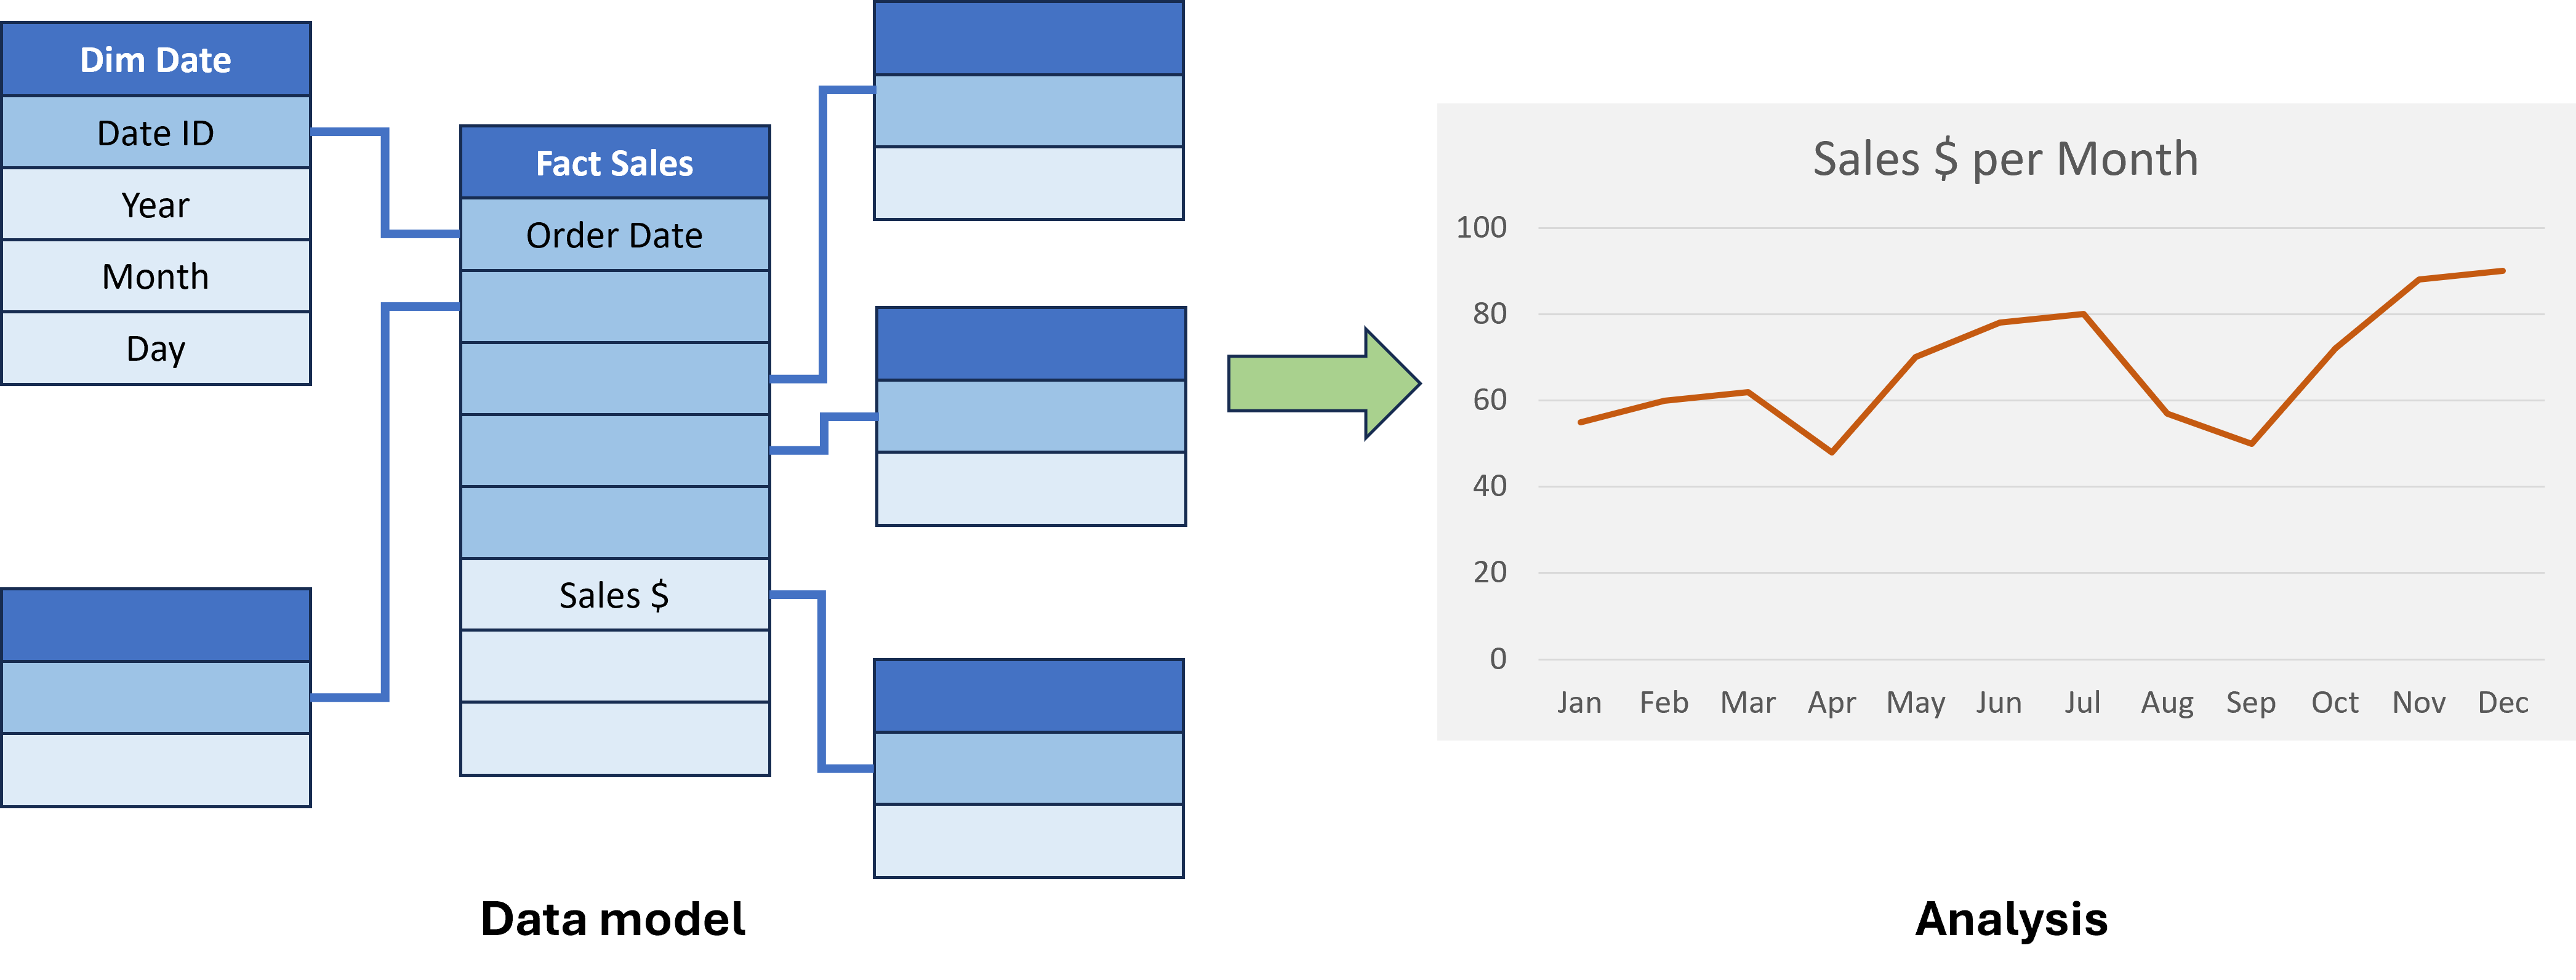
Date dimension

- Natural Key: date data type
- Surrogate key: integer data type (ISO 8601 date format
YYYYMMDD).- Space efficient
- Automatically Sorted
- Human readable
- Should include fields for
Year,MonthandDay. - Other attributes useful for analysis
Time dimension
- Some facts might require data to be at the time-of-day level.
- Dedicated time dimension table.
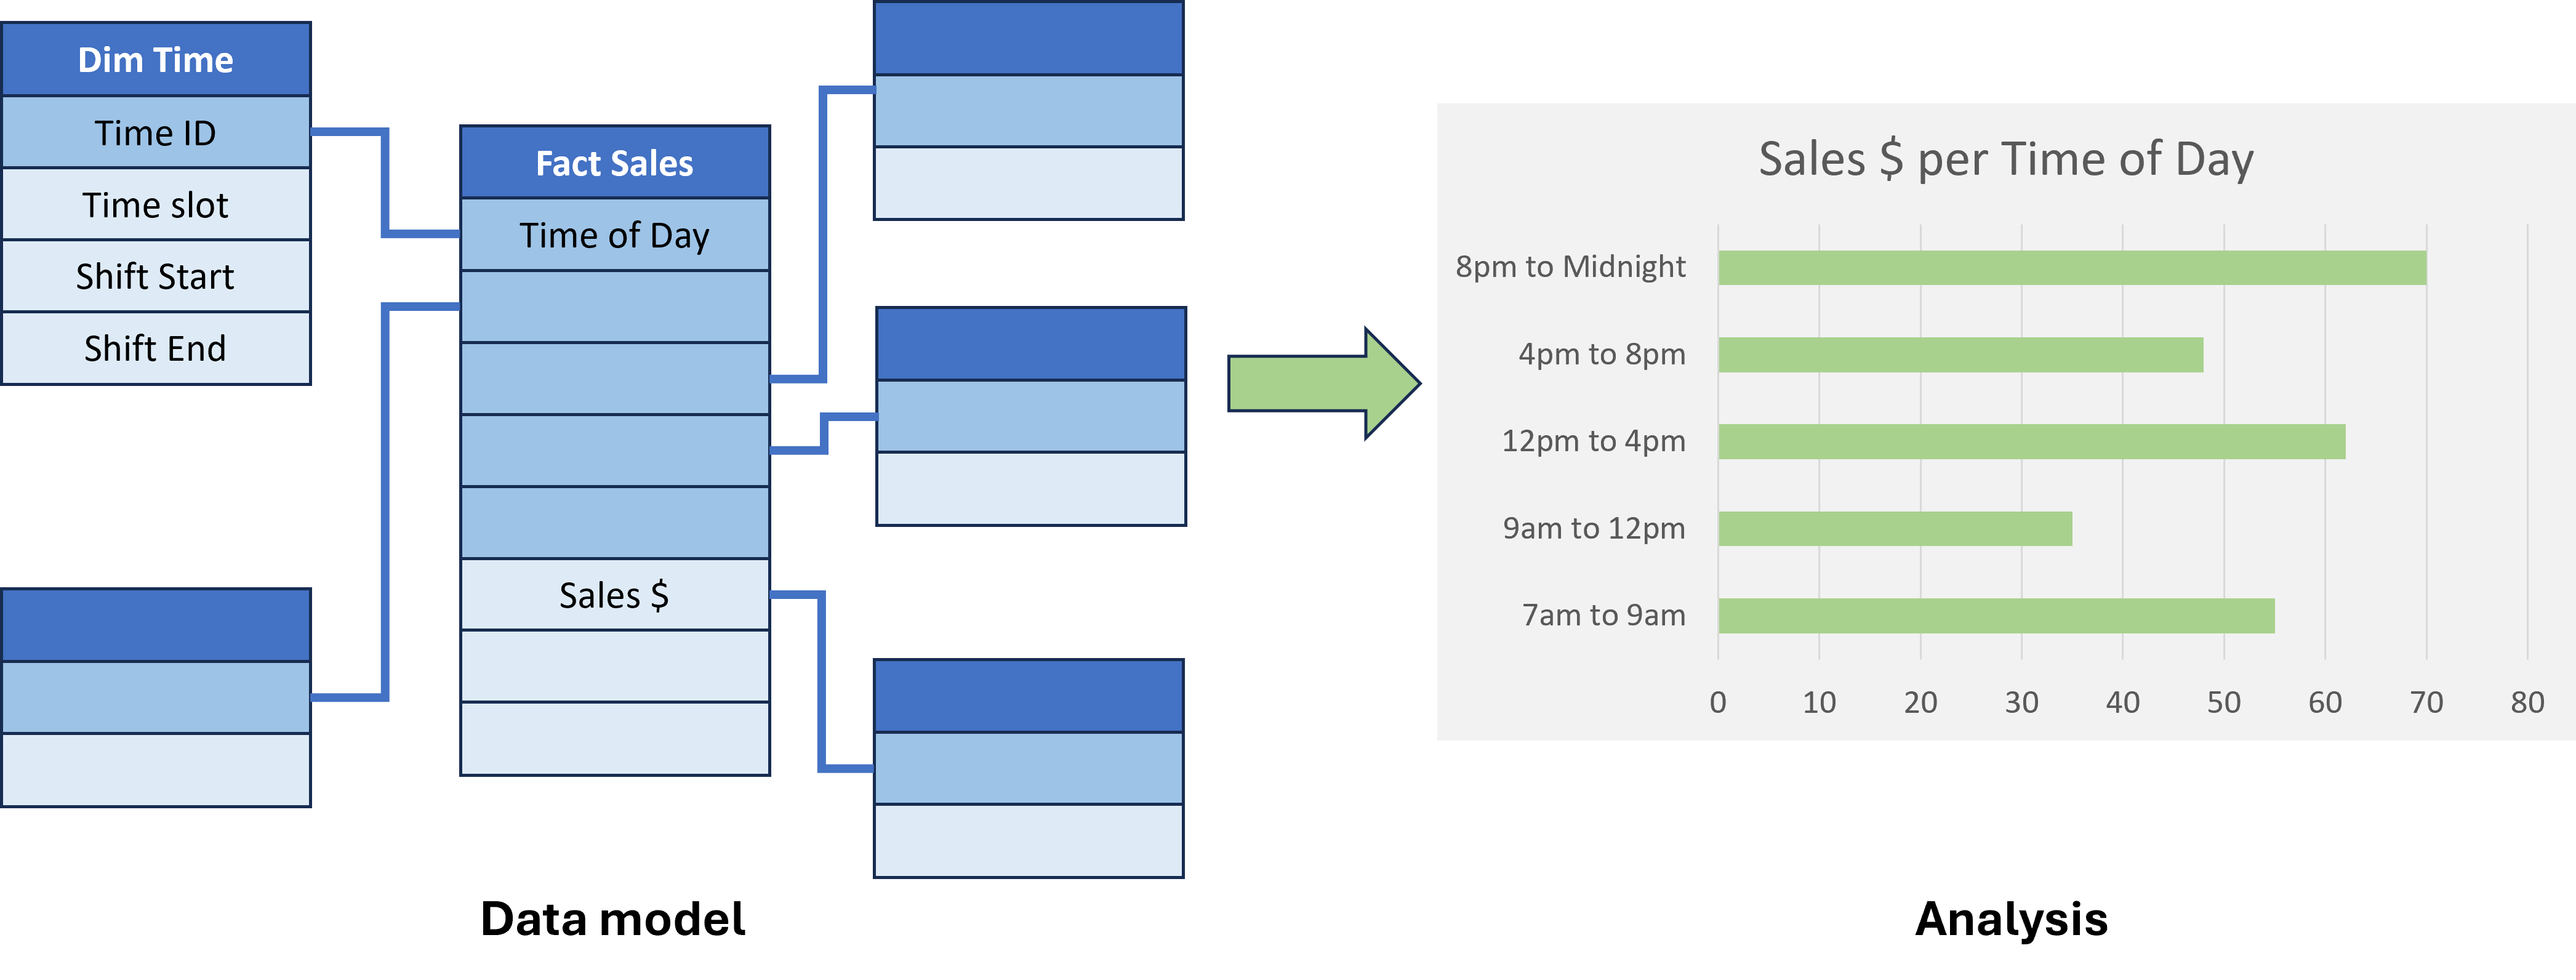
Time dimension
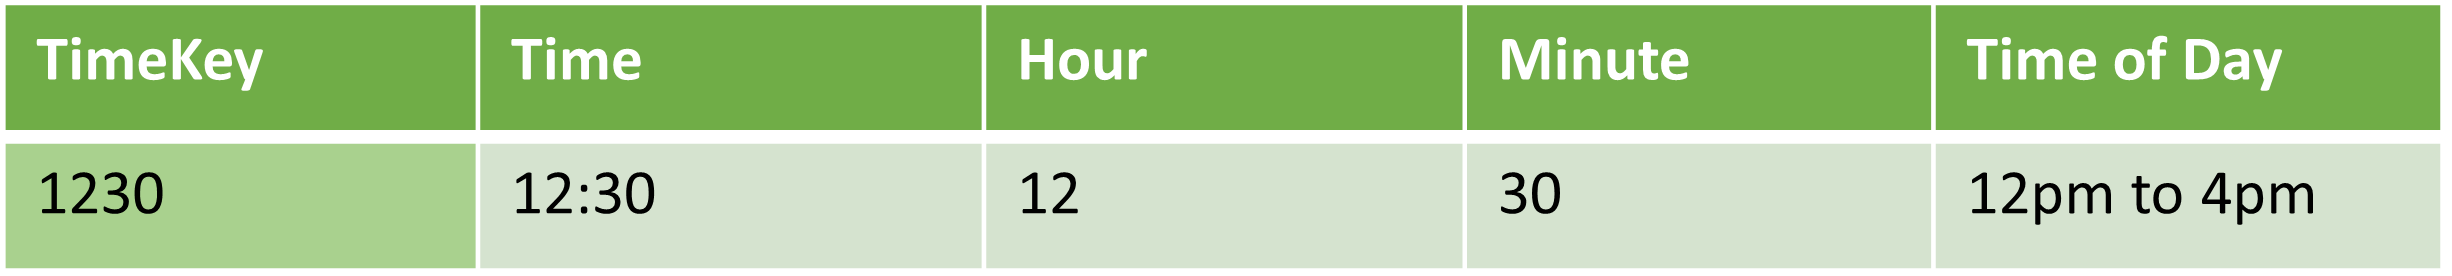
- Natural key: time data type
- Surrogate key: integer data type, using
HHMMorHHMMSSformat - Grain of minutes: 60 x 24 = 1,440 rows
- Grain of seconds: 60 x 60 x 24 = 86,400 rows
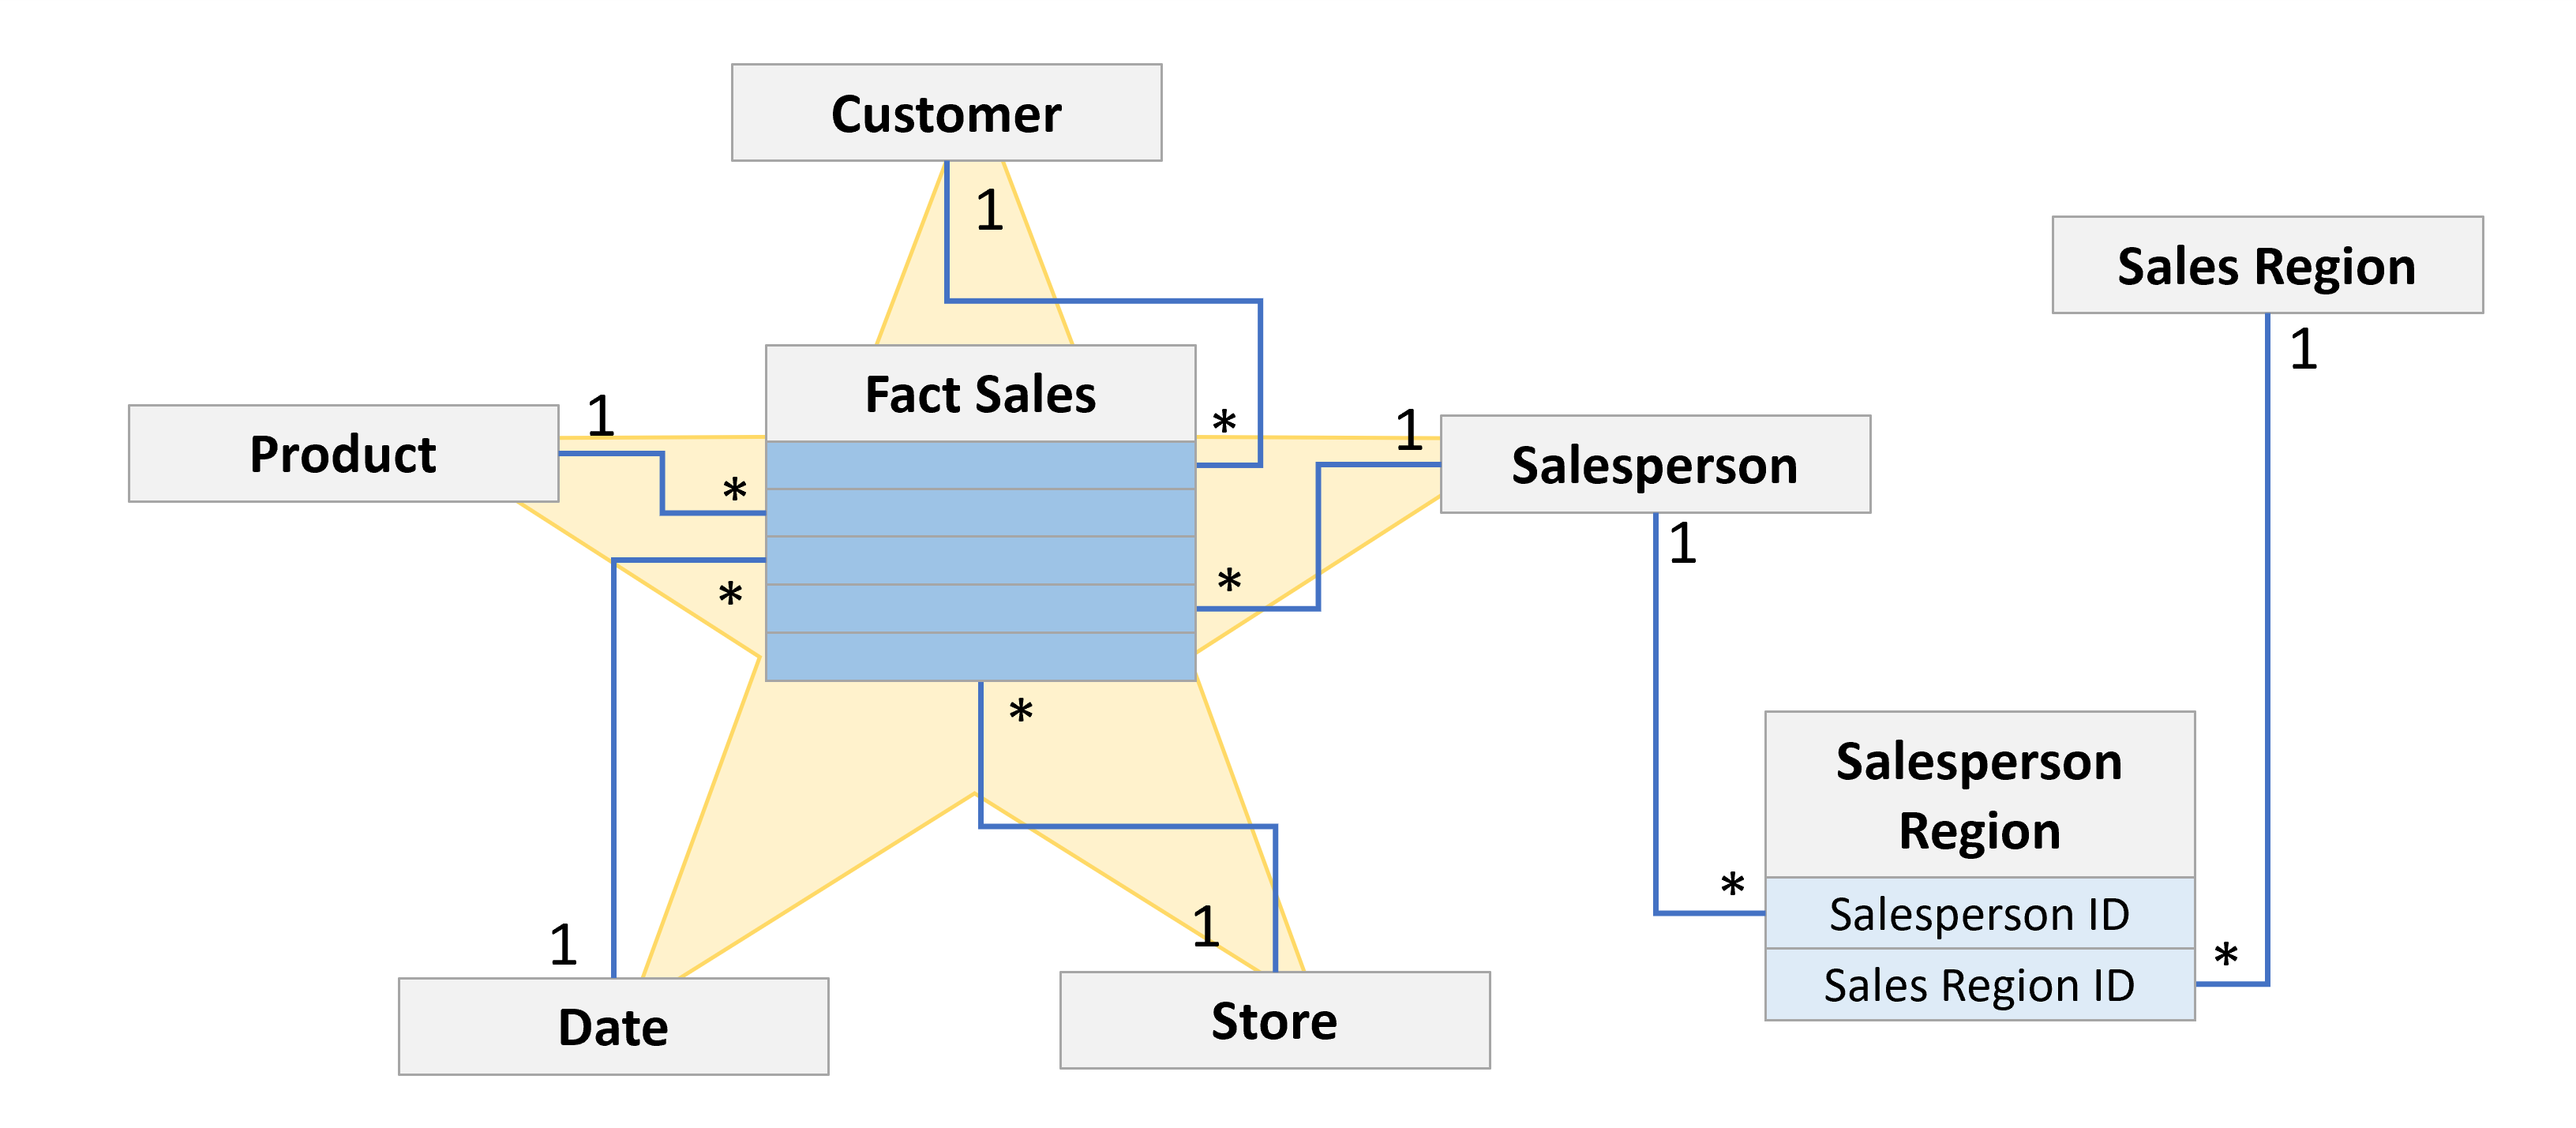
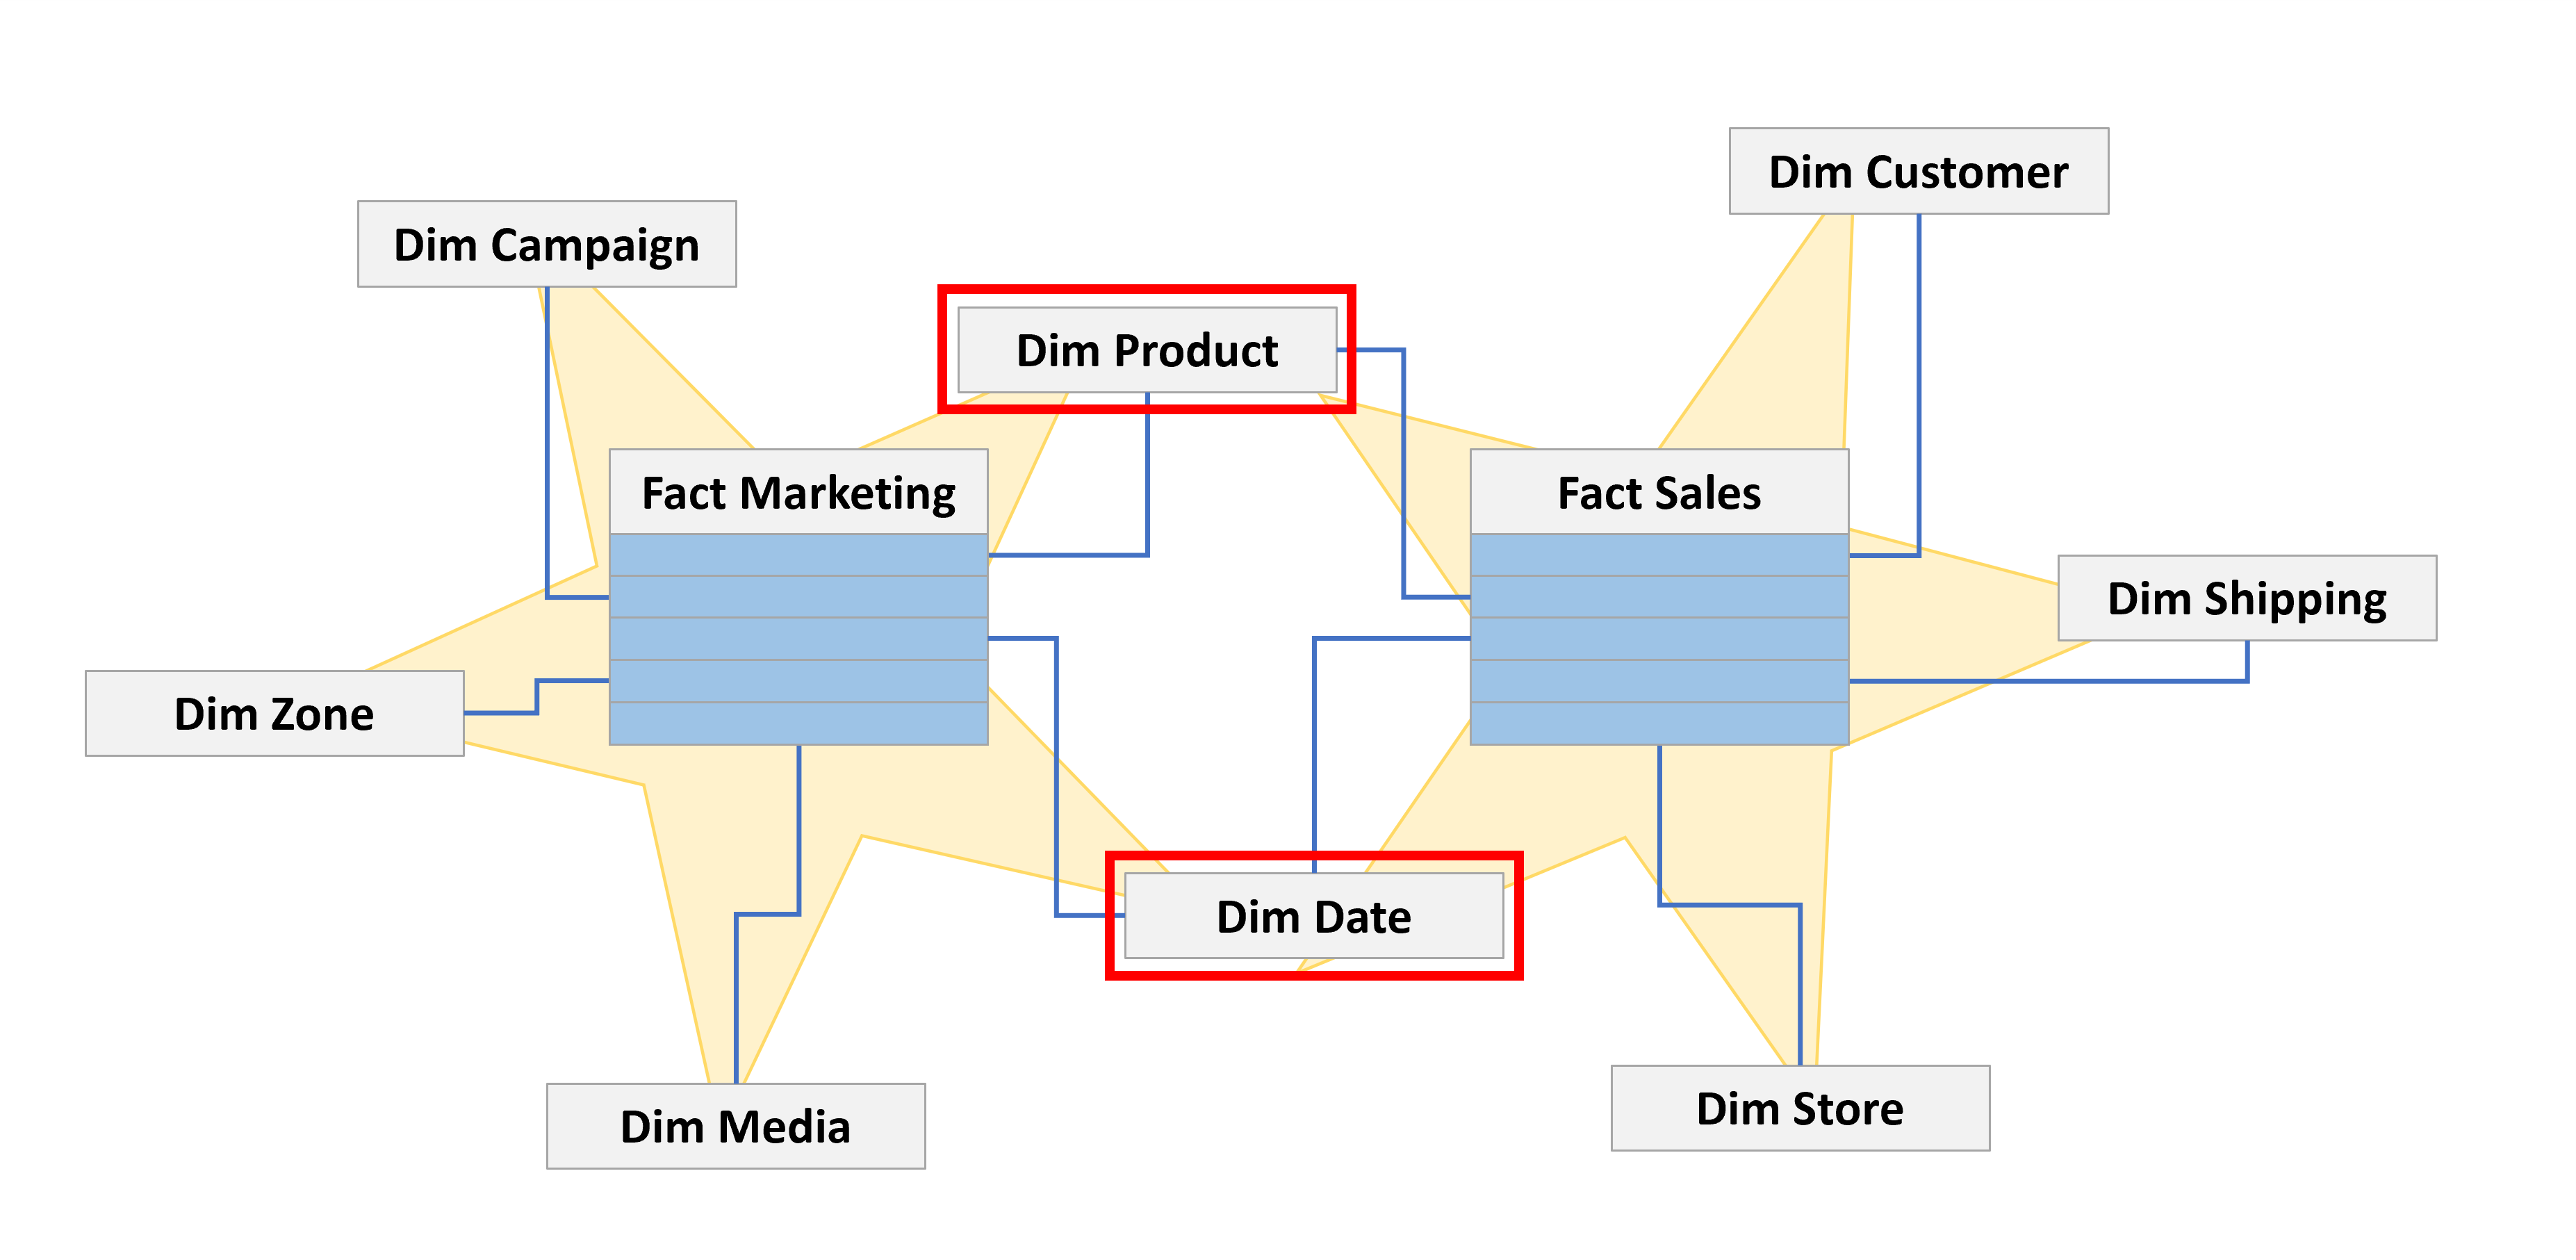
Conformed dimensions
- Conformed dimensions relate to many fact tables
- Common example: Date dimension
- Help to ensure consistency across models supporting different areas.
- Example, product and date dimension shared by sales and marketing star schemas.
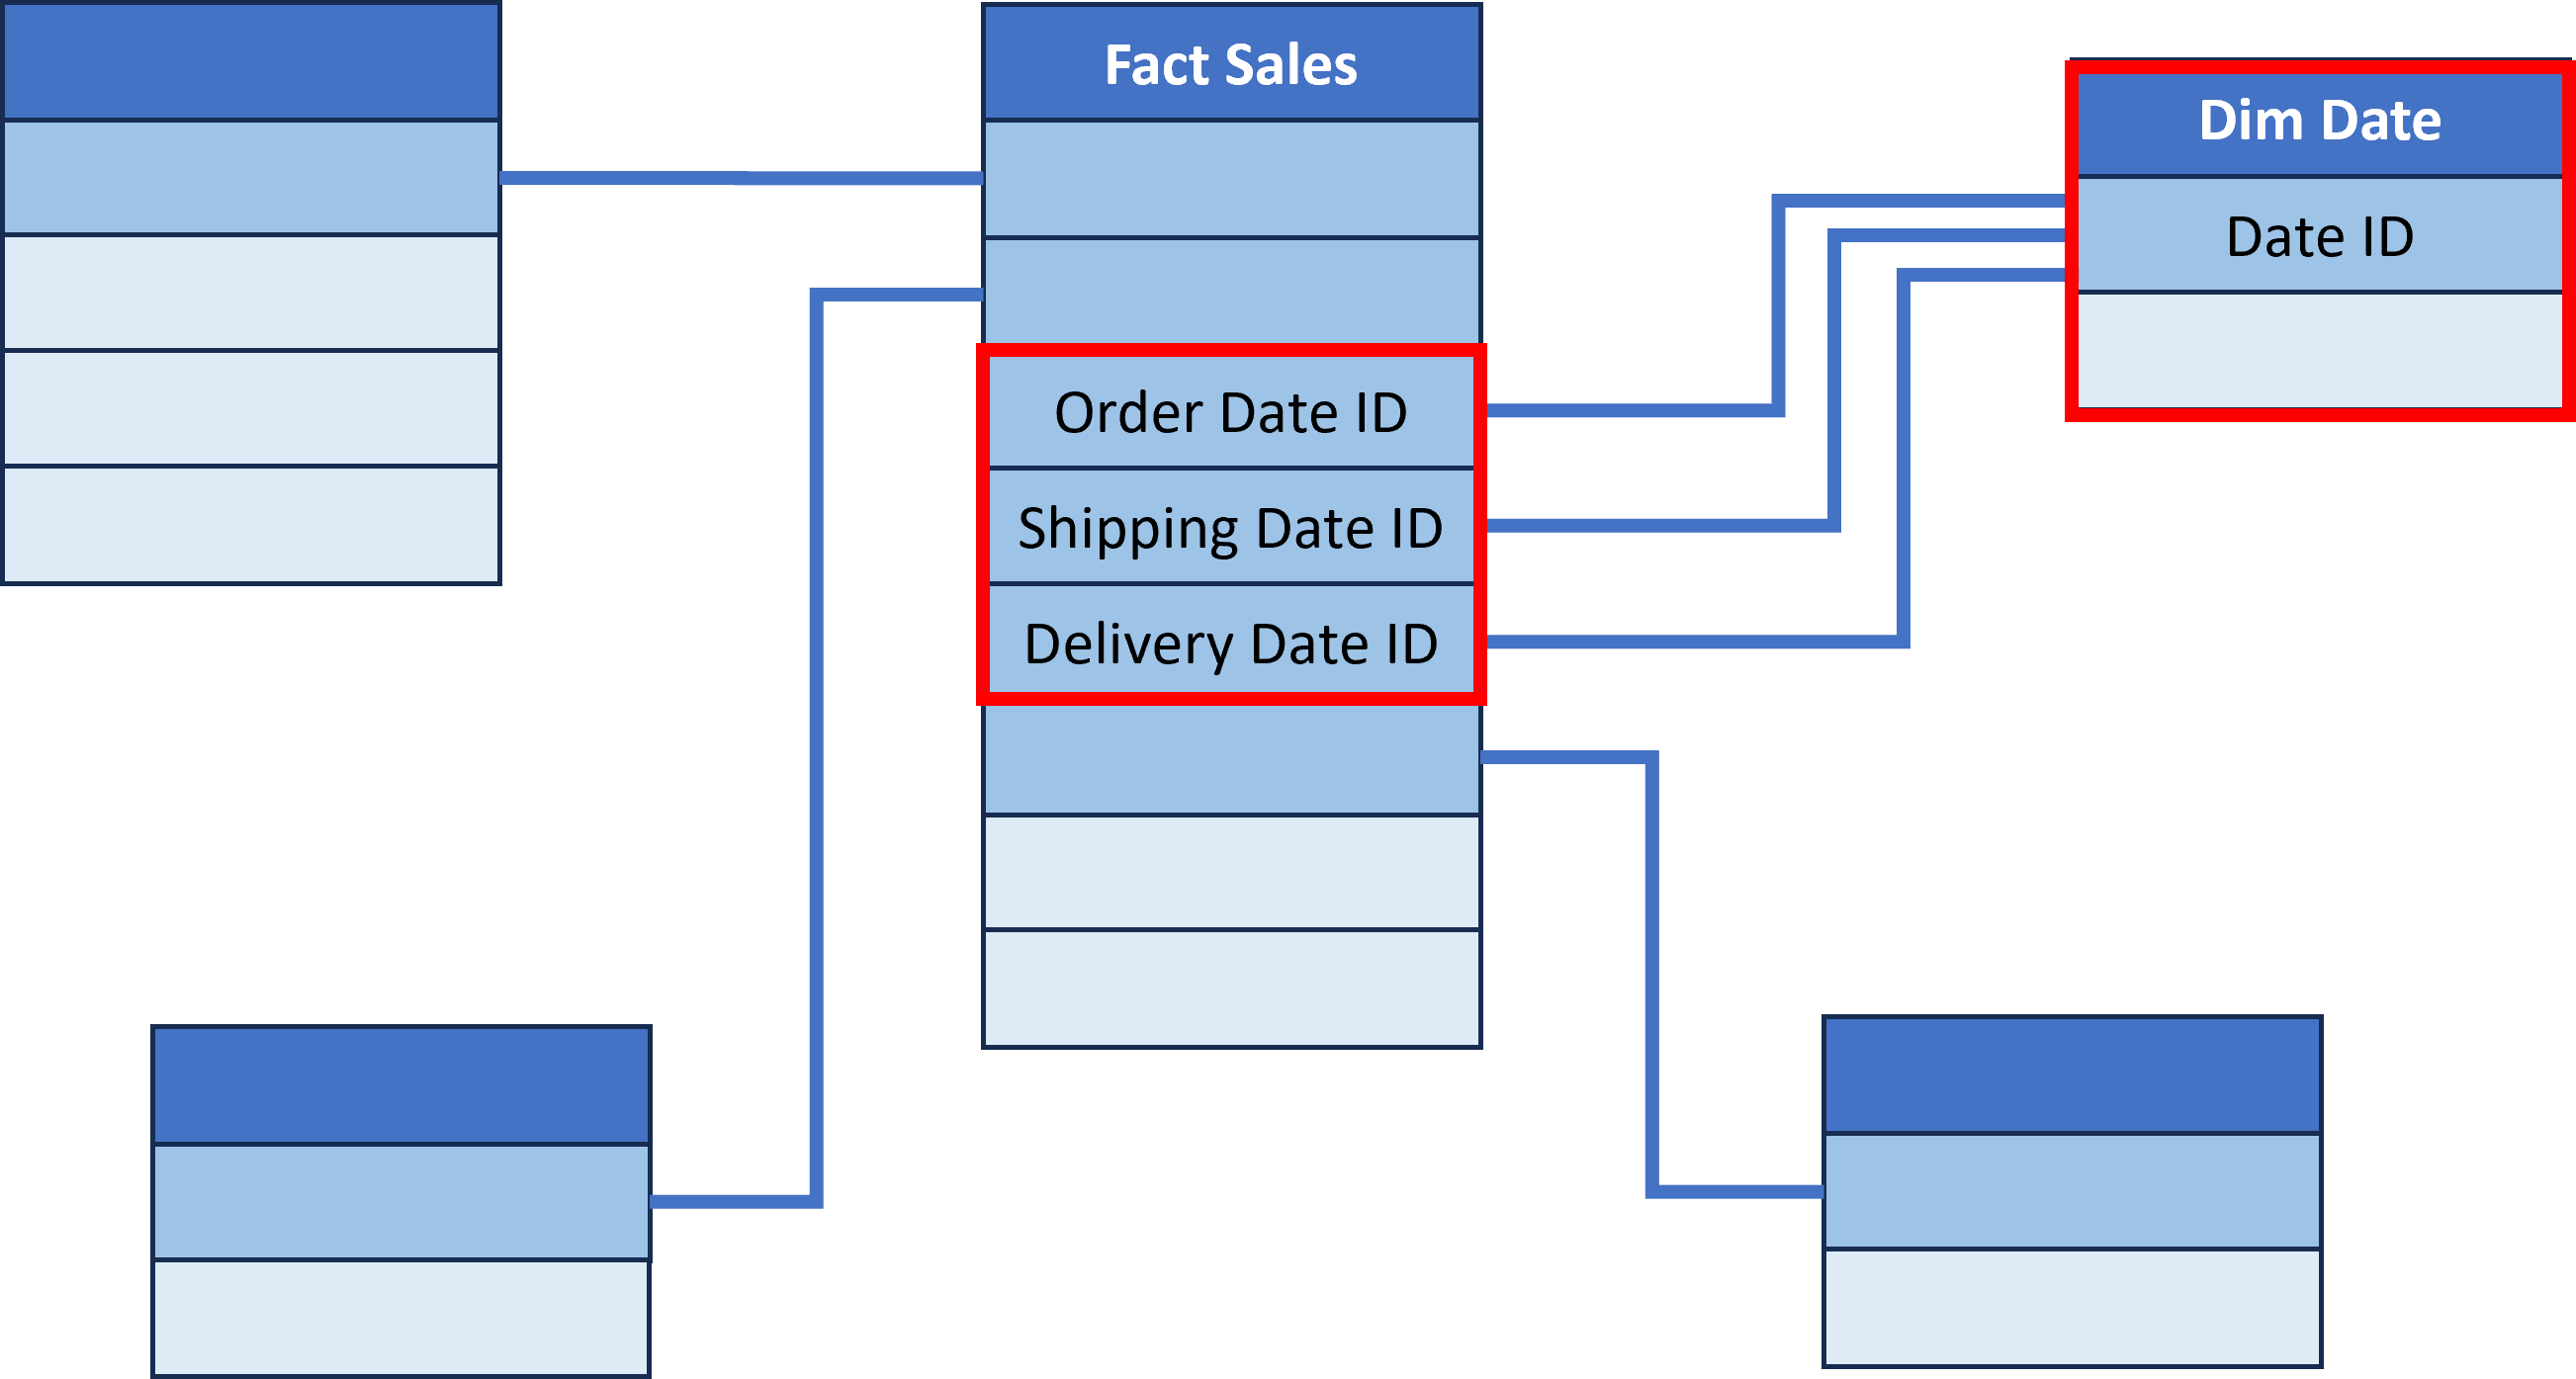
Role-Playing dimensions
- Dimension that is referenced multiple times in a fact table
- Instead of duplicating the dimension table, the same dimension plays different roles
- Example: Order Date, Shipping Date and Delivery Date
Multivalued dimensions
Multivalued dimensions