Identifying performance issues
Transform and Analyze Data with Microsoft Fabric

Luis Silva
Solution Architect - Data & AI
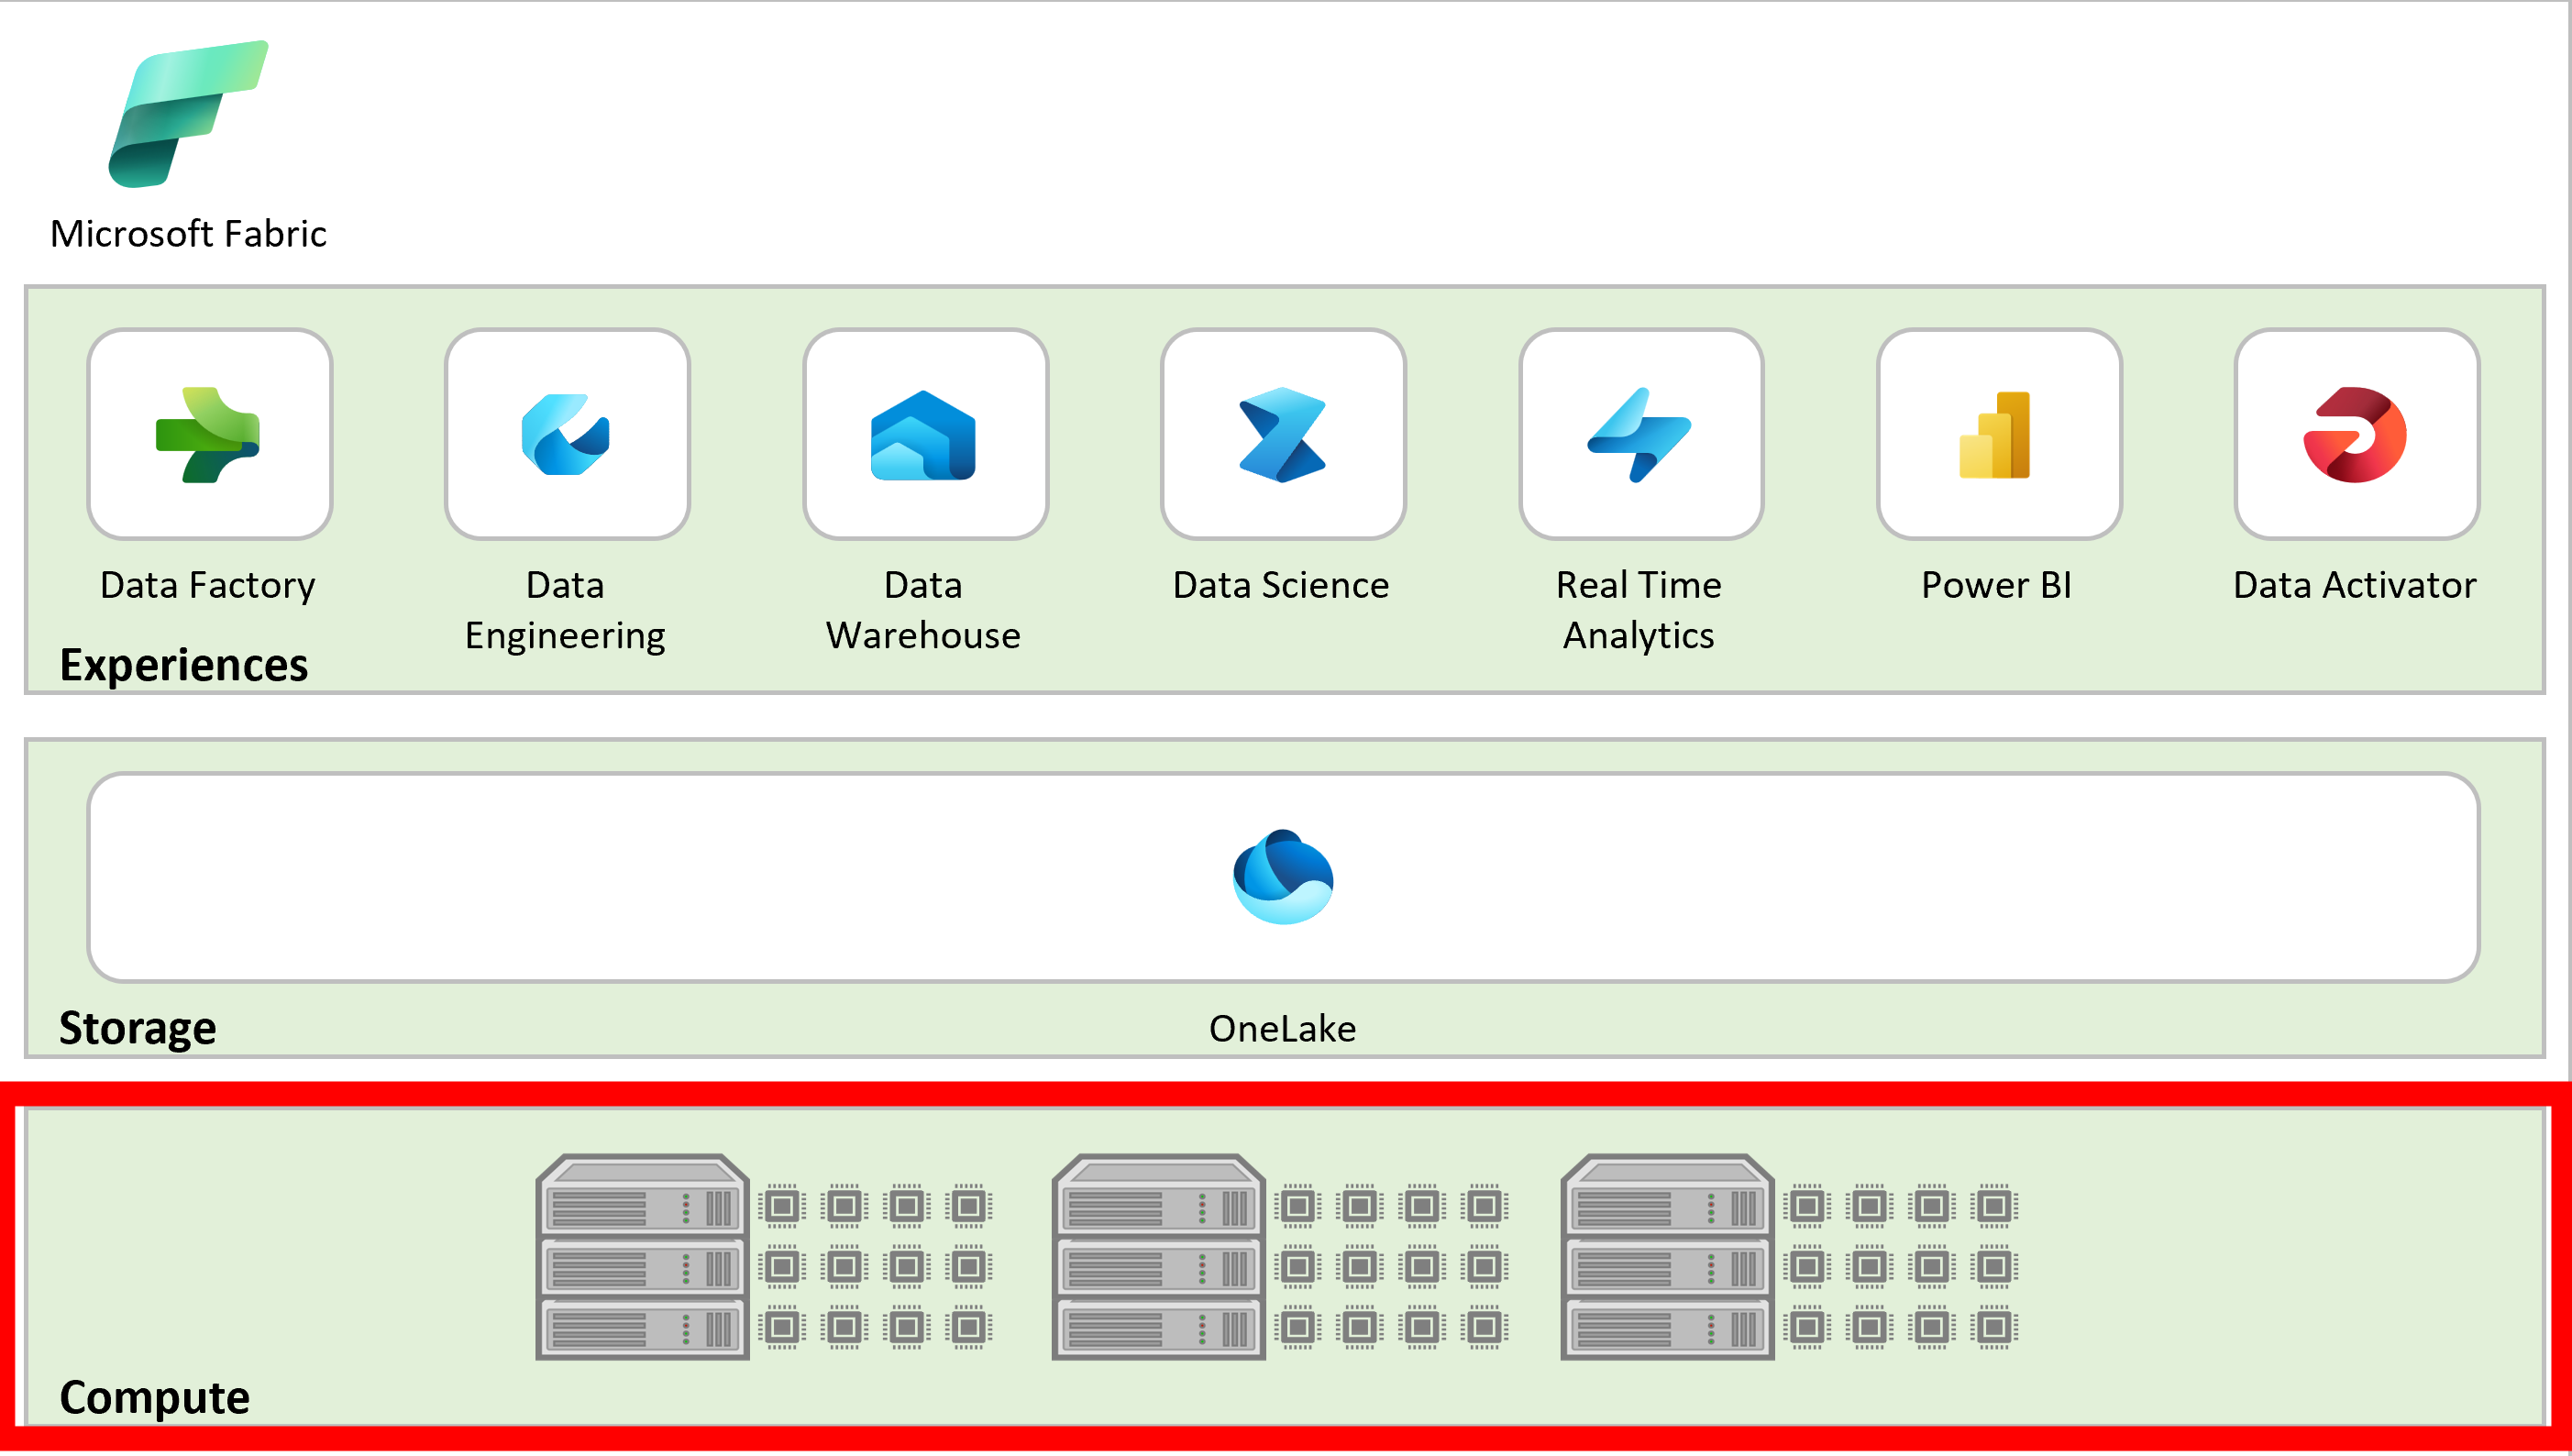
Fabric capacities
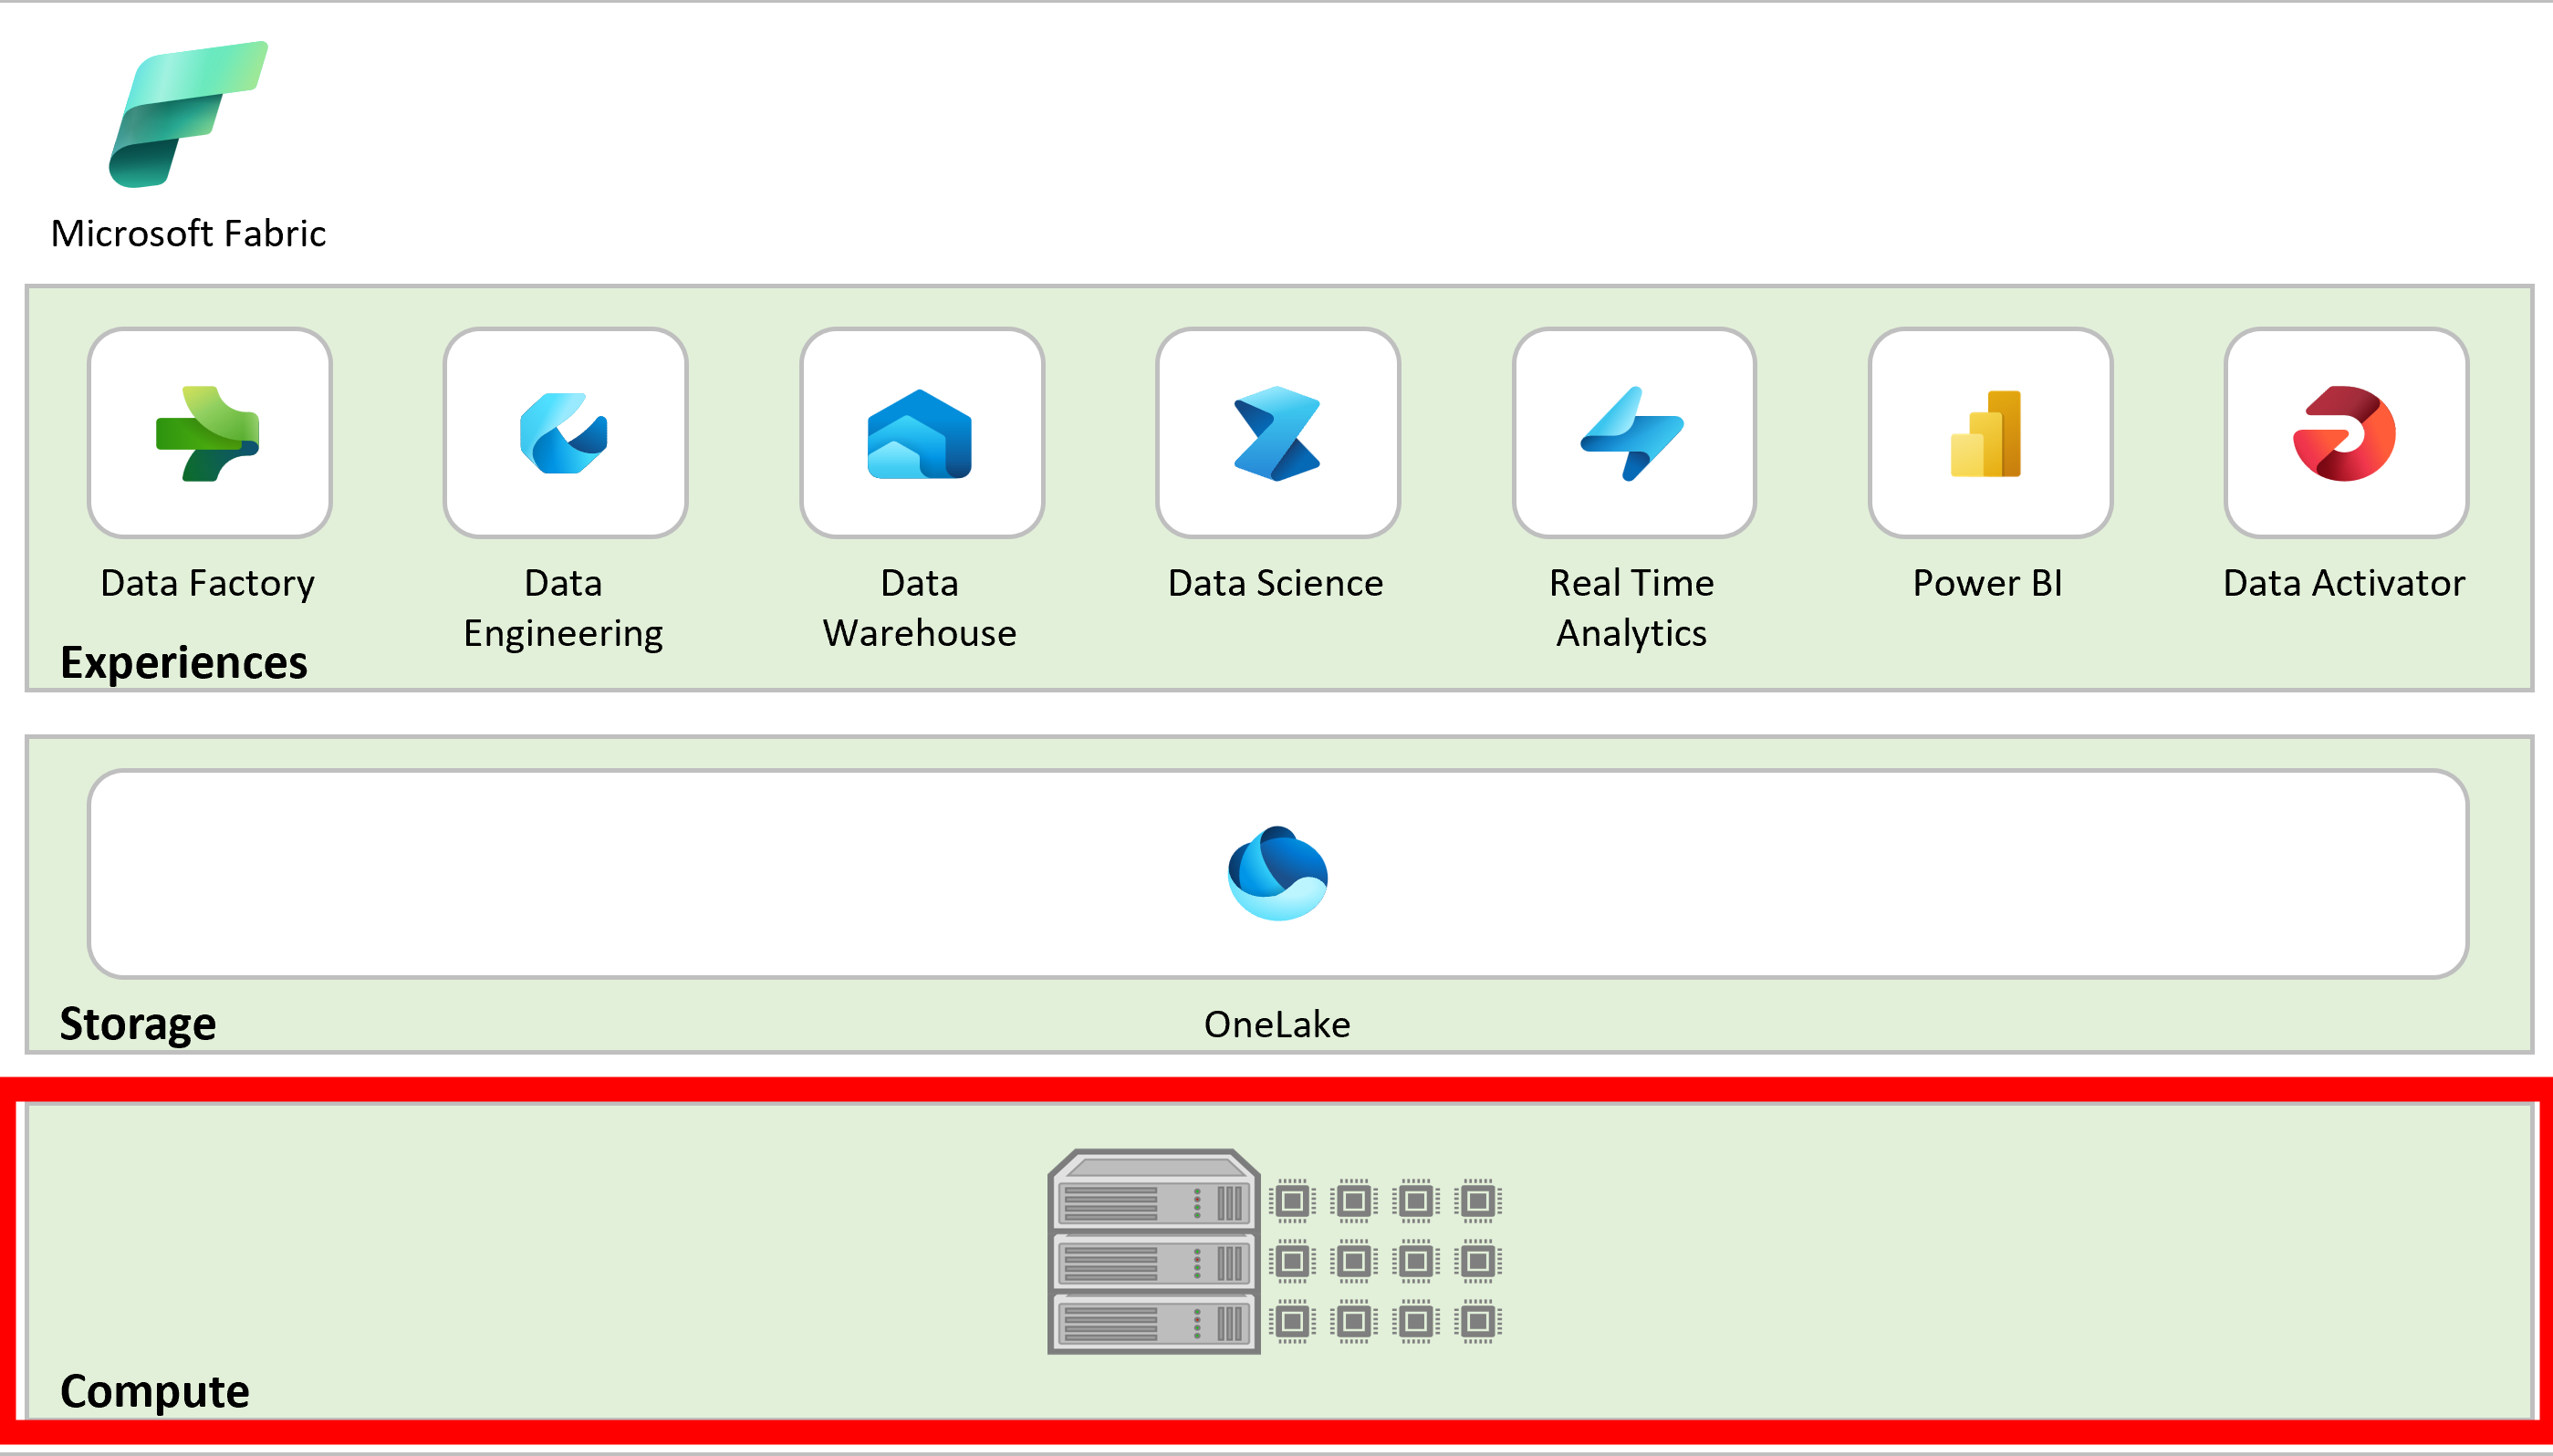
Fabric capacities
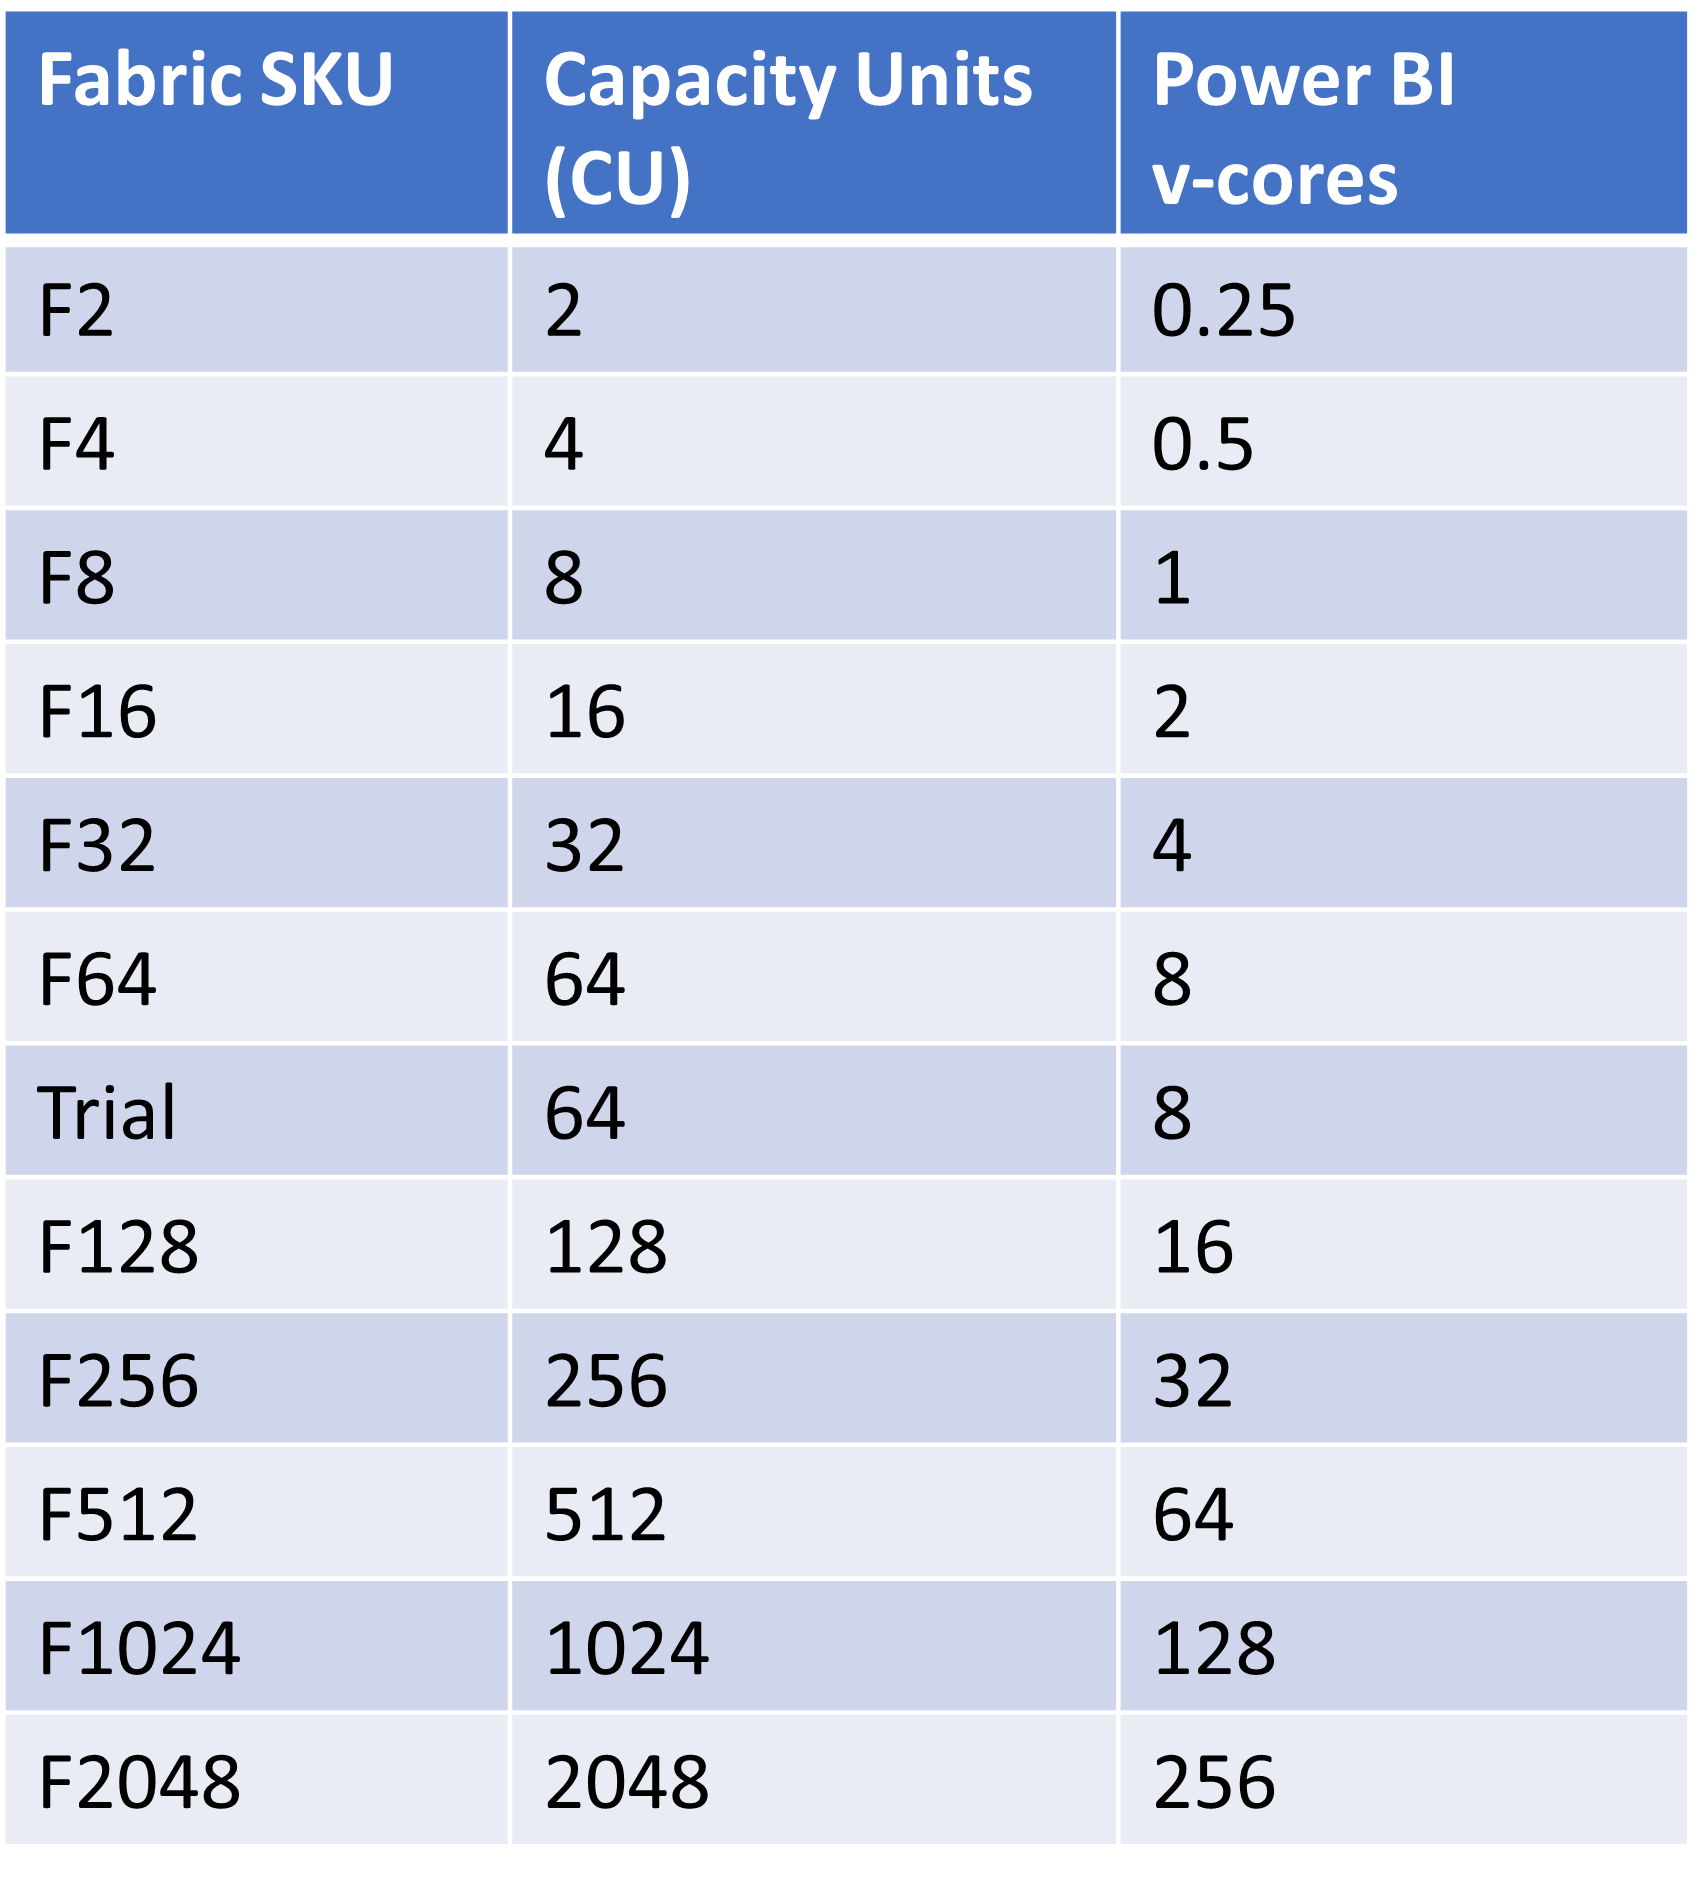
Fabric SKUs
Resource sizing challenges
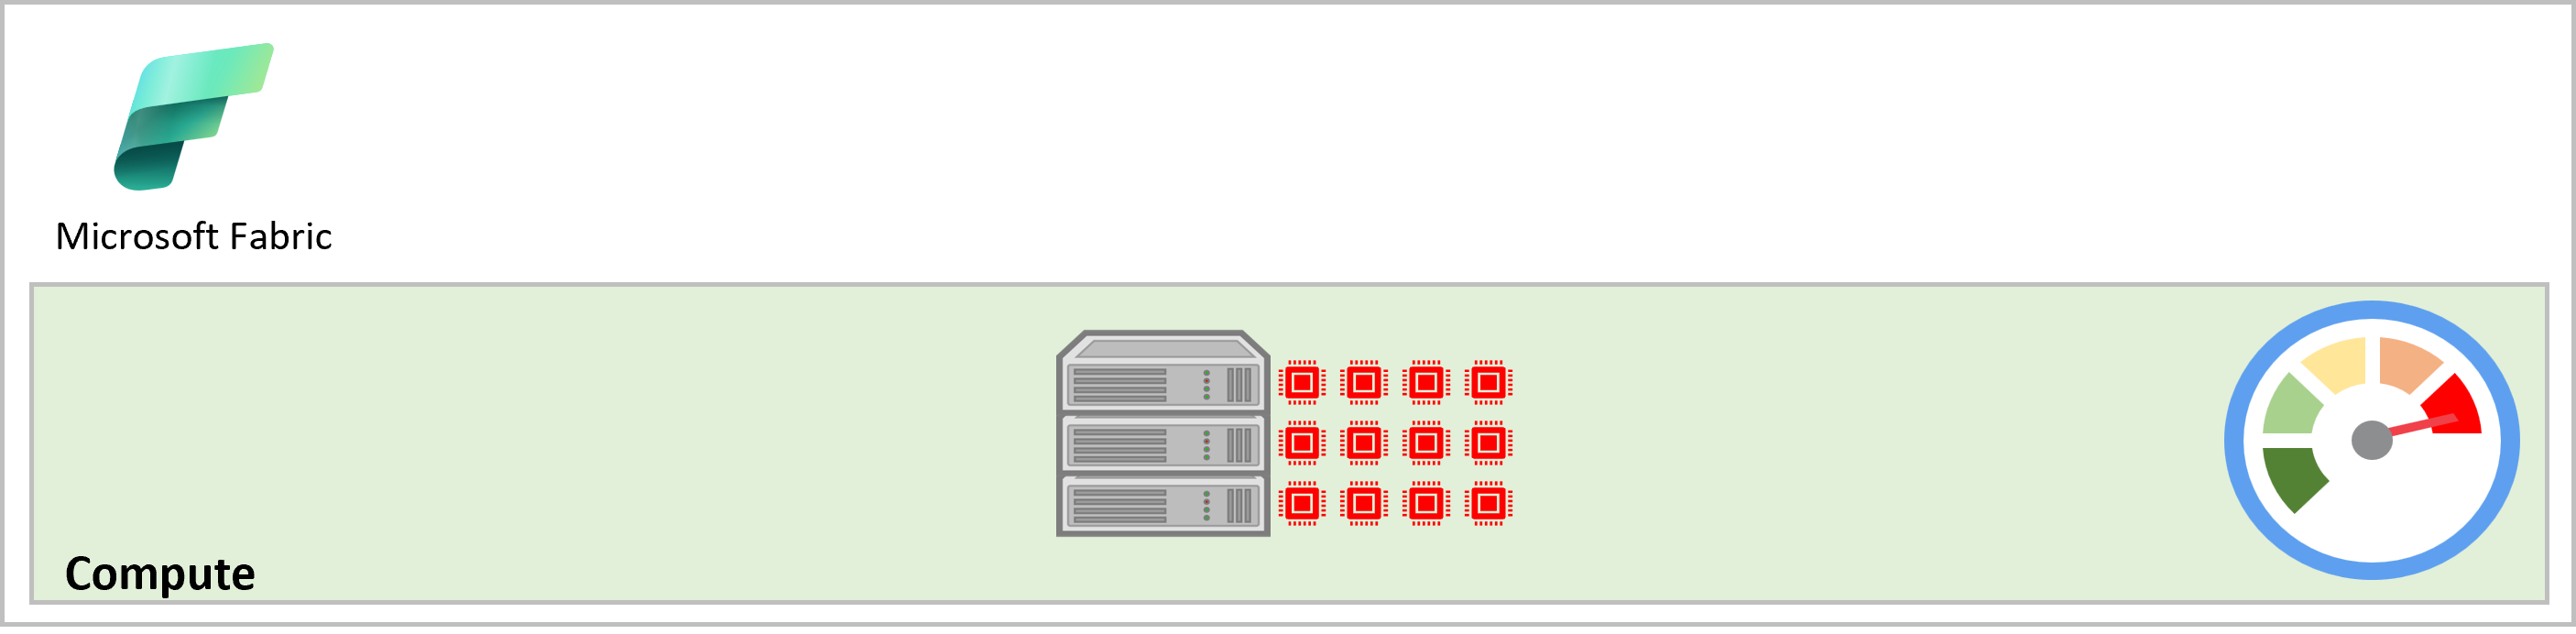
Resource sizing challenges
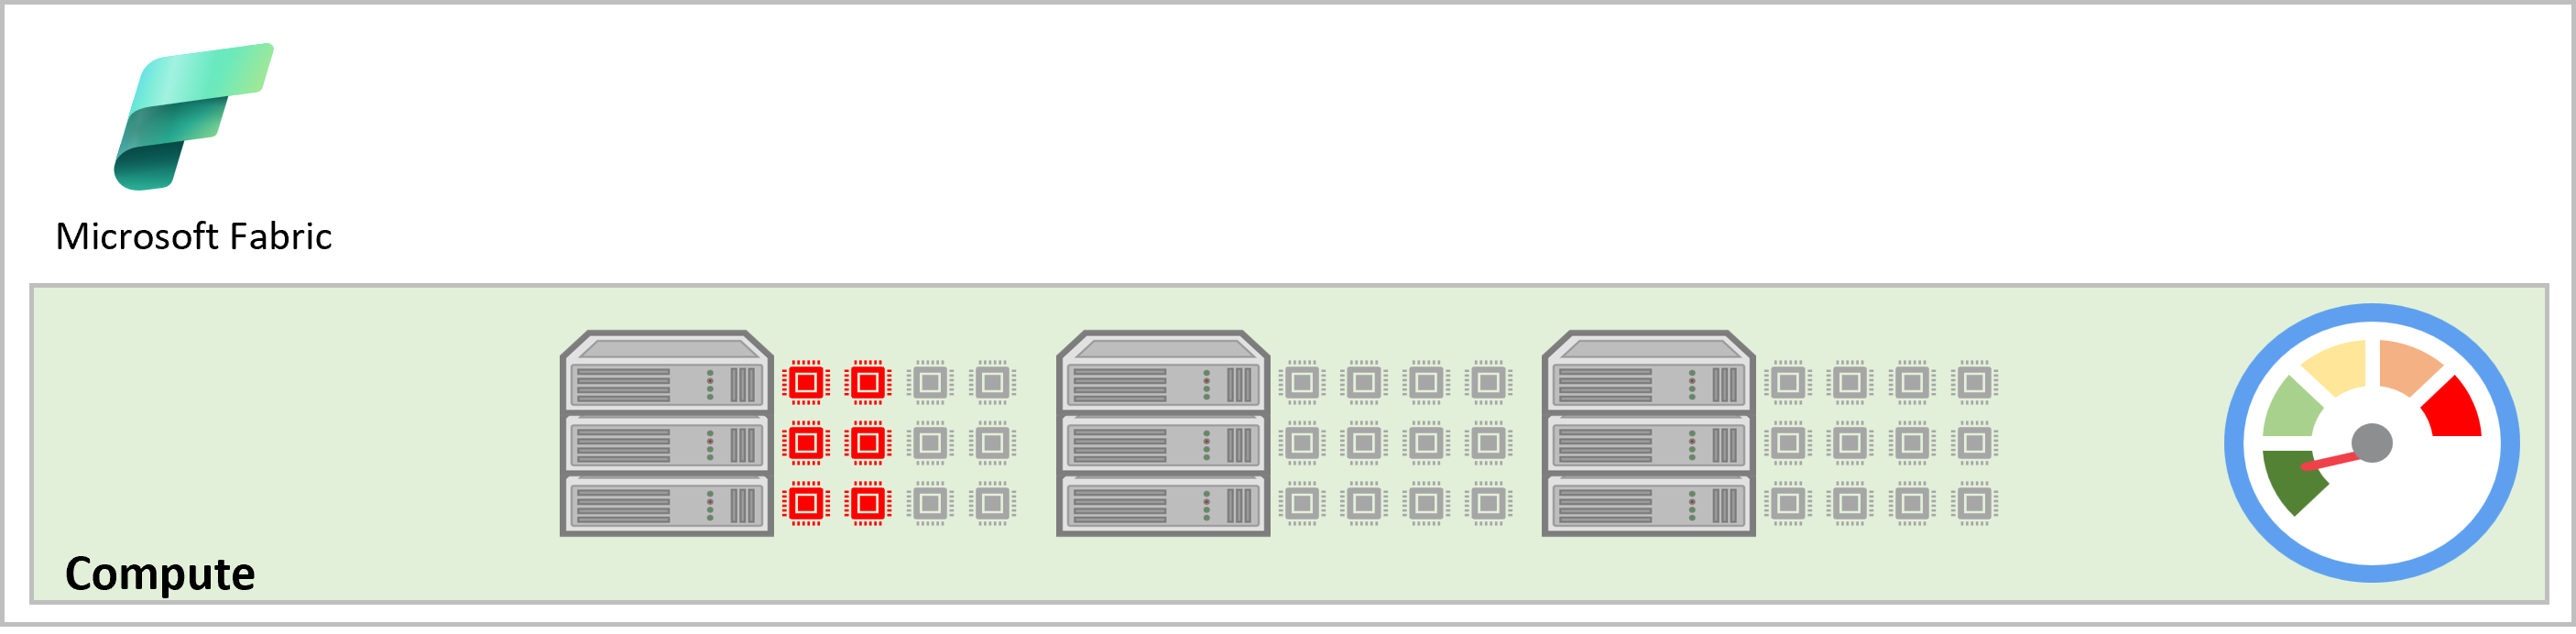
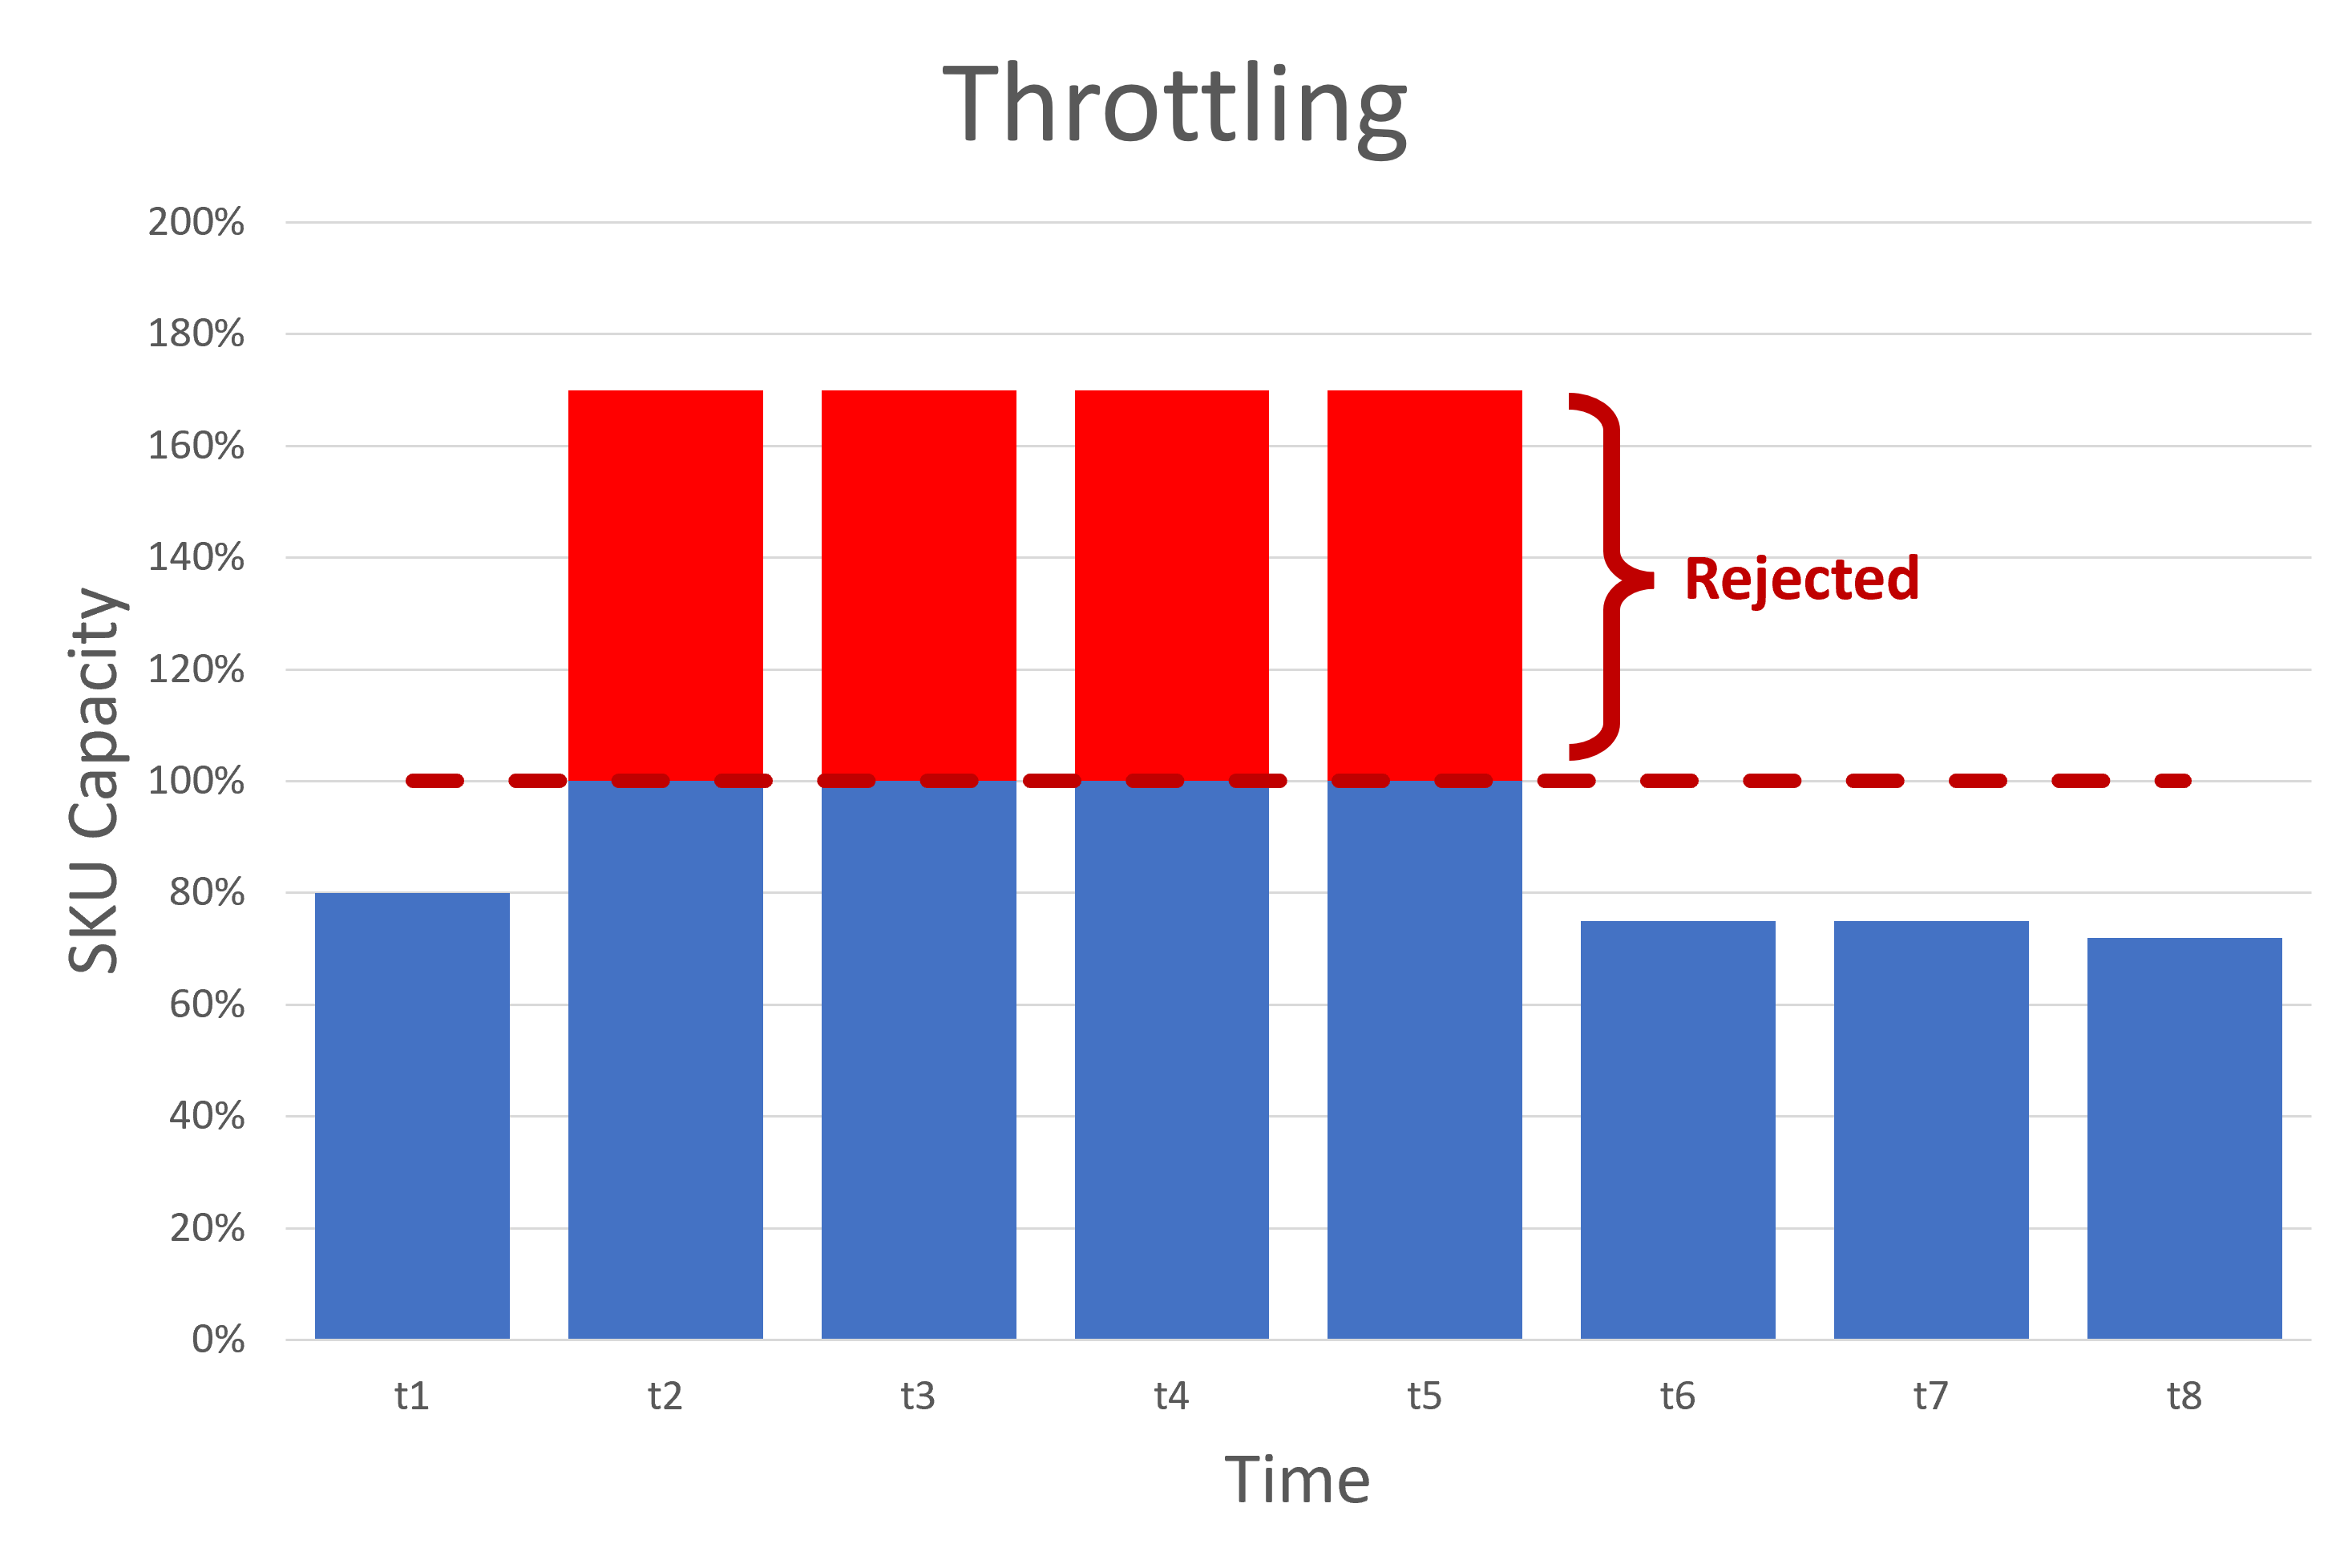
Automatic resource management
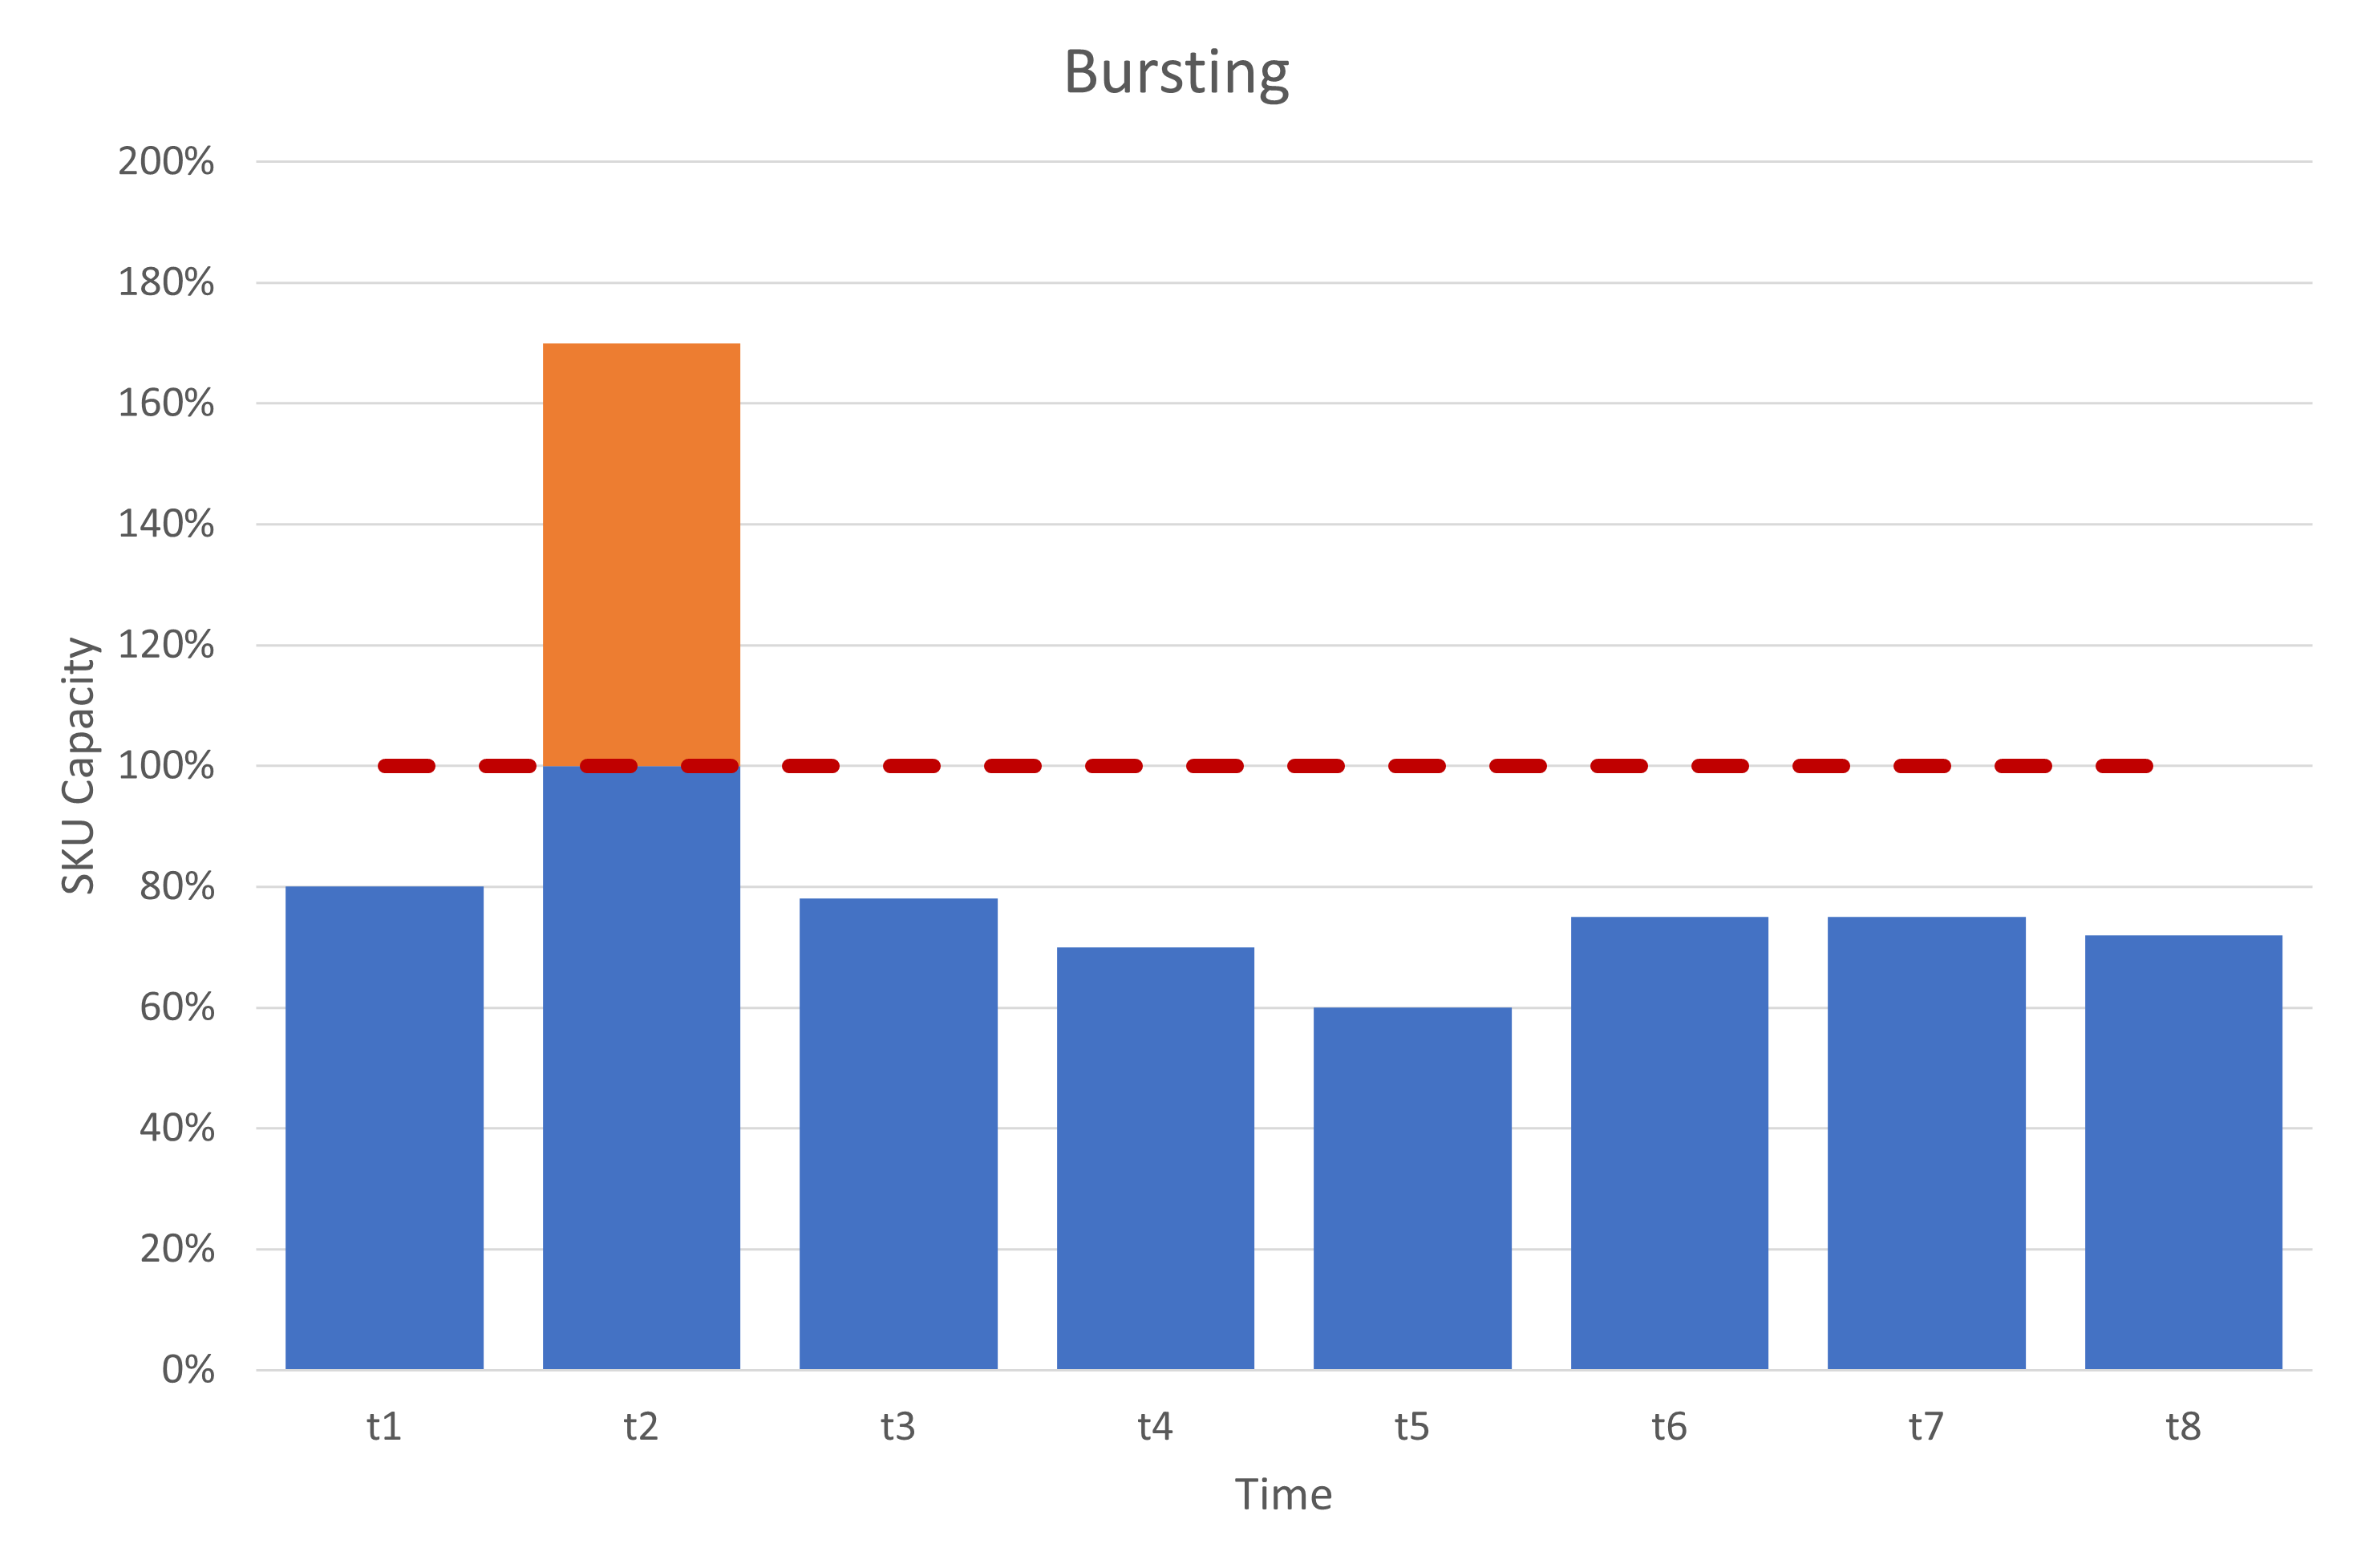
Automatic resource management
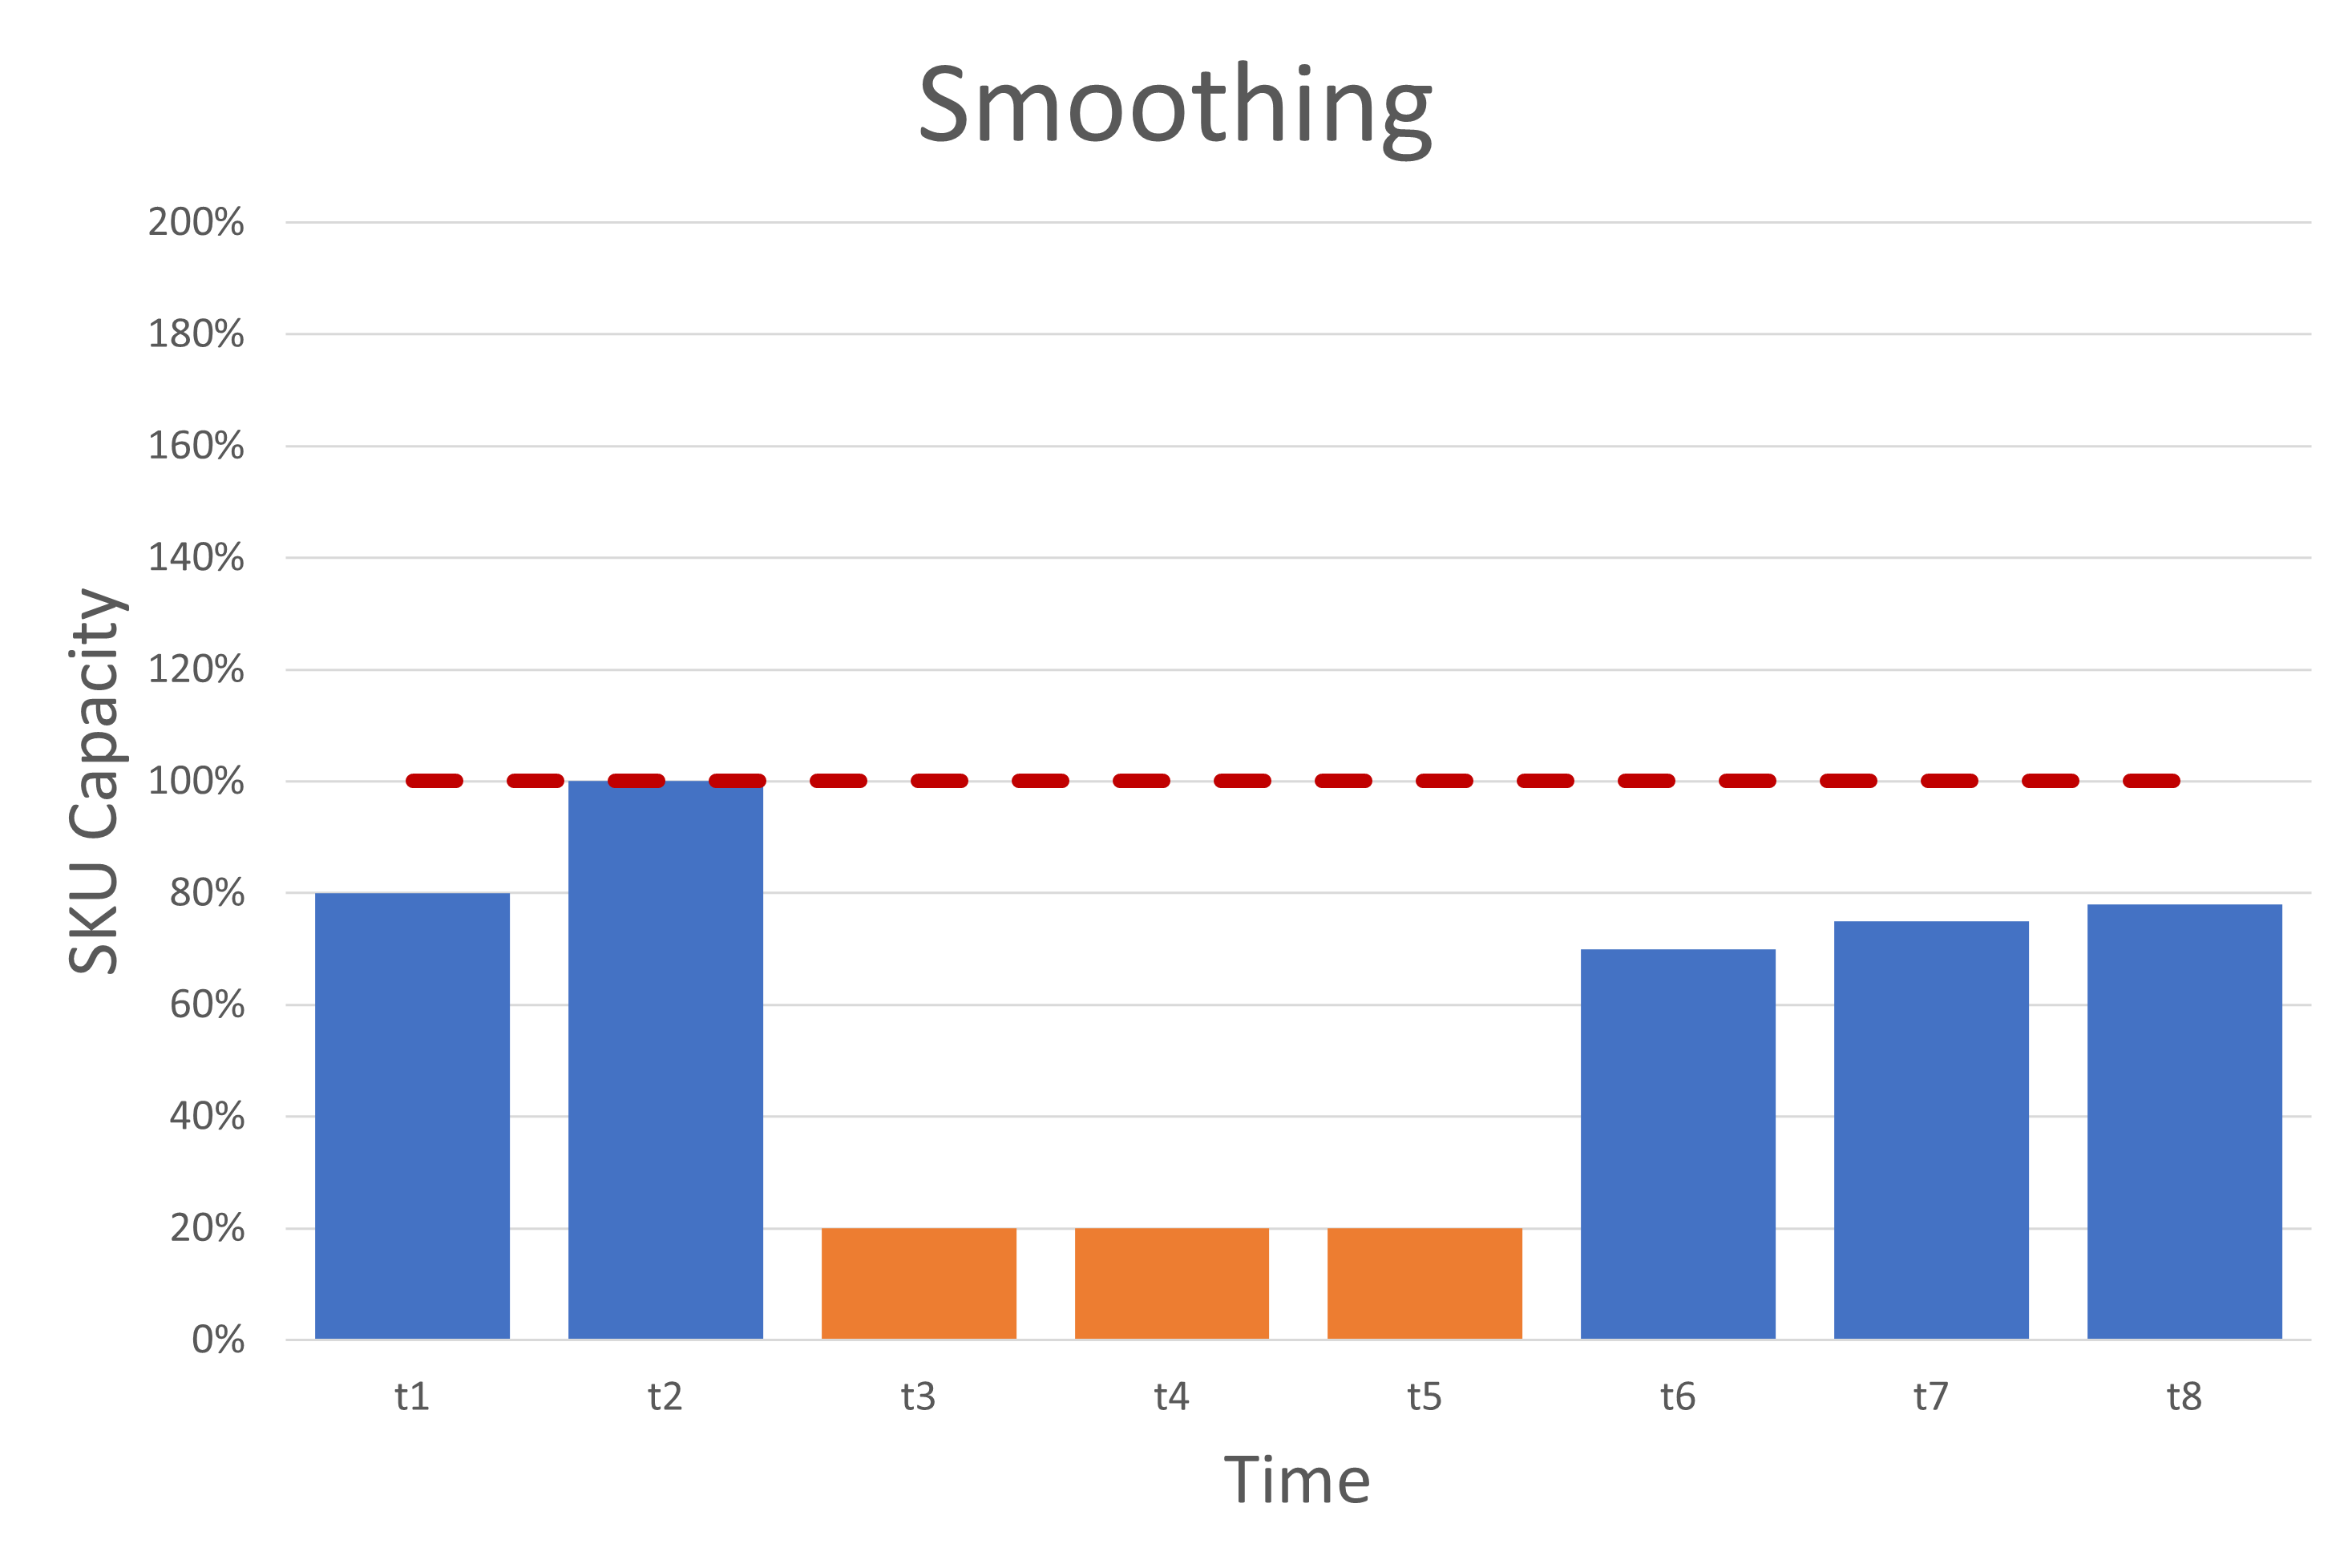
Automatic resource management
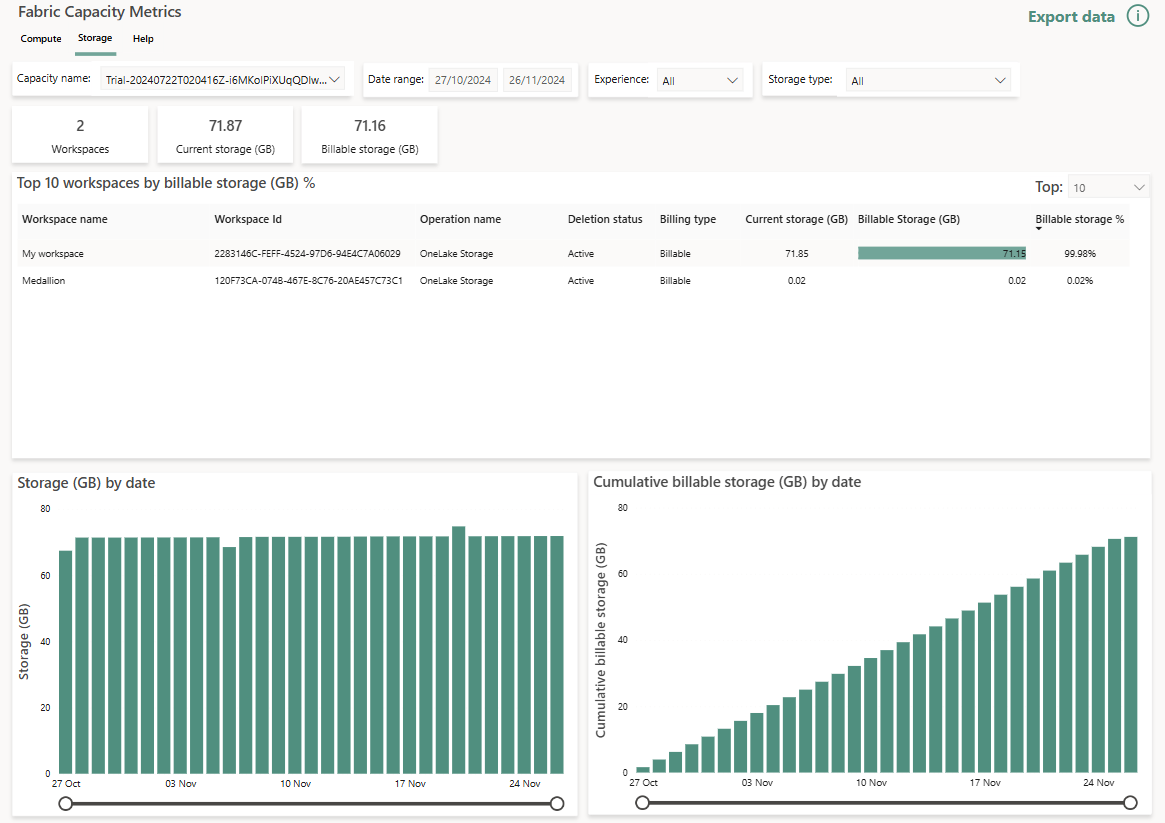
Monitoring capacity usage

Fabric Capacity Metrics app
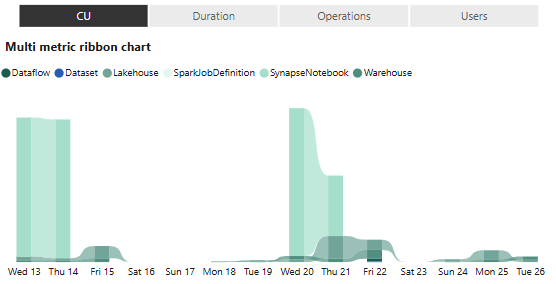
Monitoring capacity usage
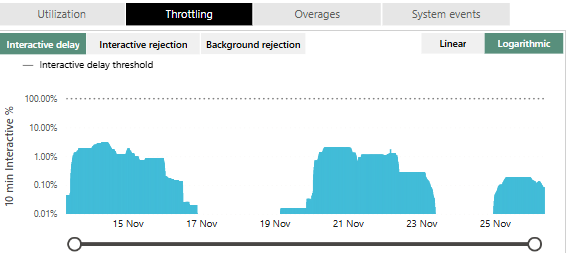
Monitoring capacity usage
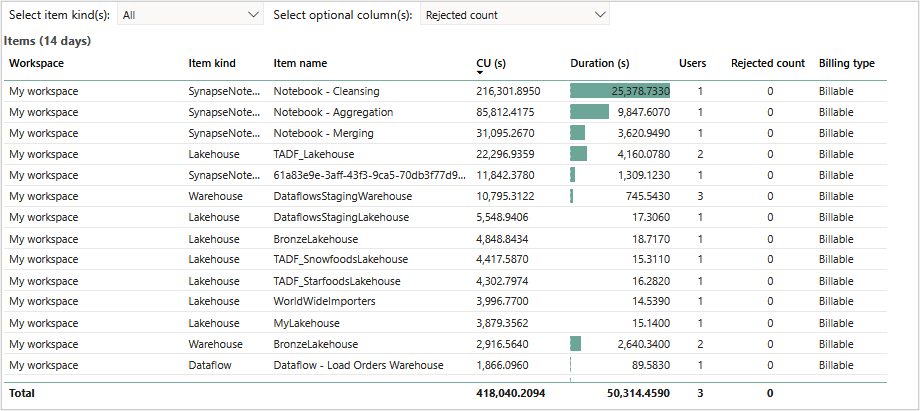
Monitoring capacity usage
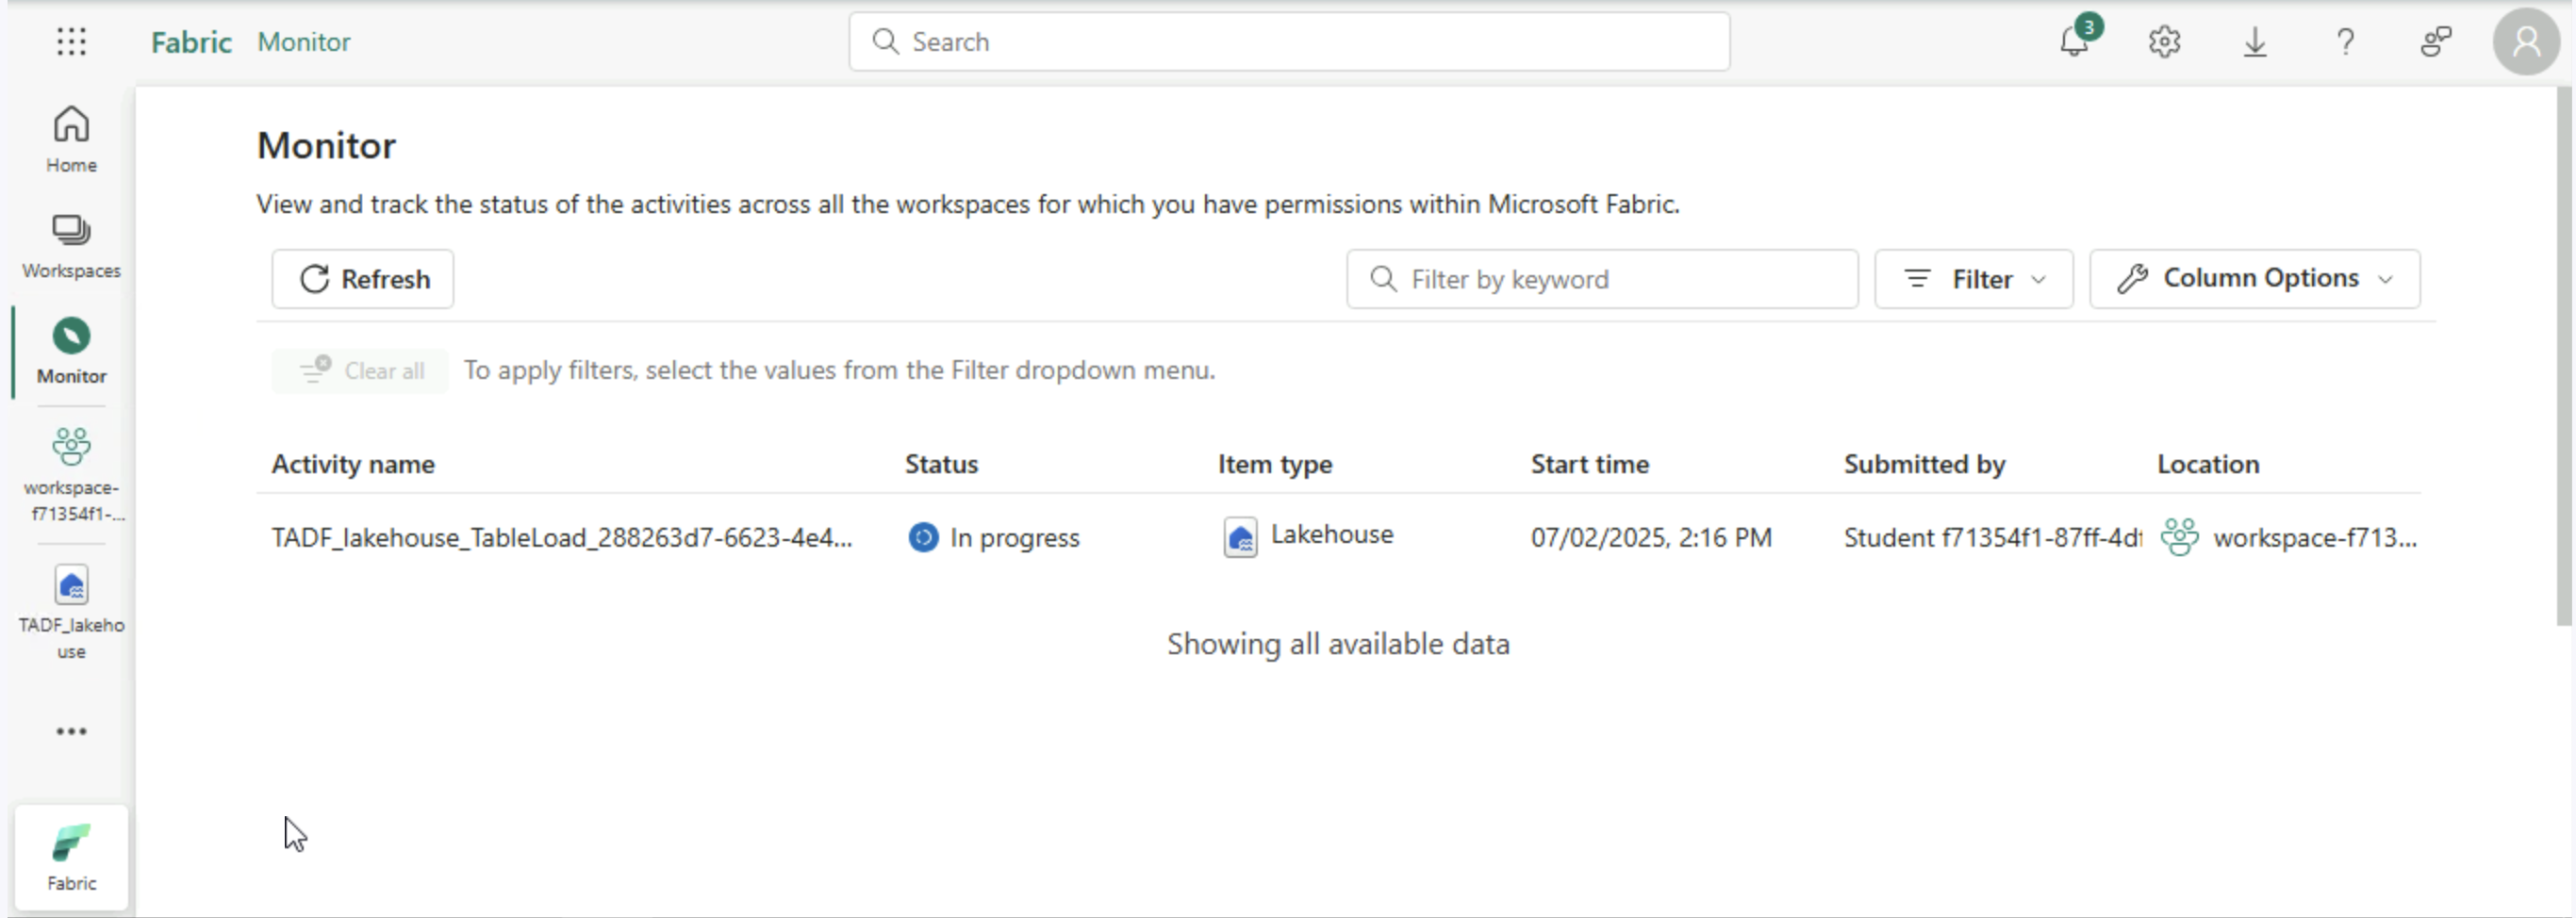
Monitoring hub
- More detailed view than Capacity Metrics app
- Capacity Metrics app: Focus on aggregated resource consumption over time
- Monitoring hub: Focus on execution time of individual activities
![]()
Monitoring hub