Anpassung von Darstellungen
Python für Fortgeschrittene

Hugo Bowne-Anderson
Data Scientist at DataCamp
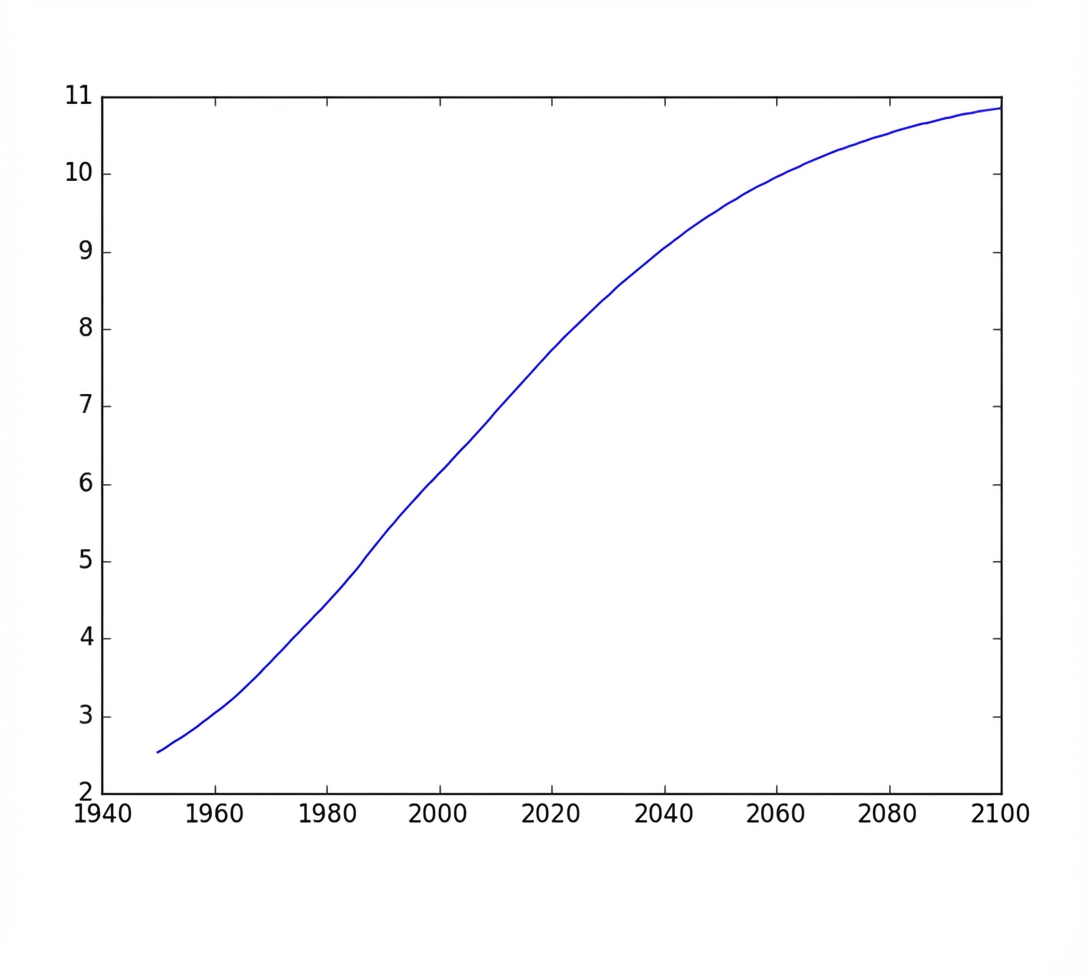
Einfacher Plot
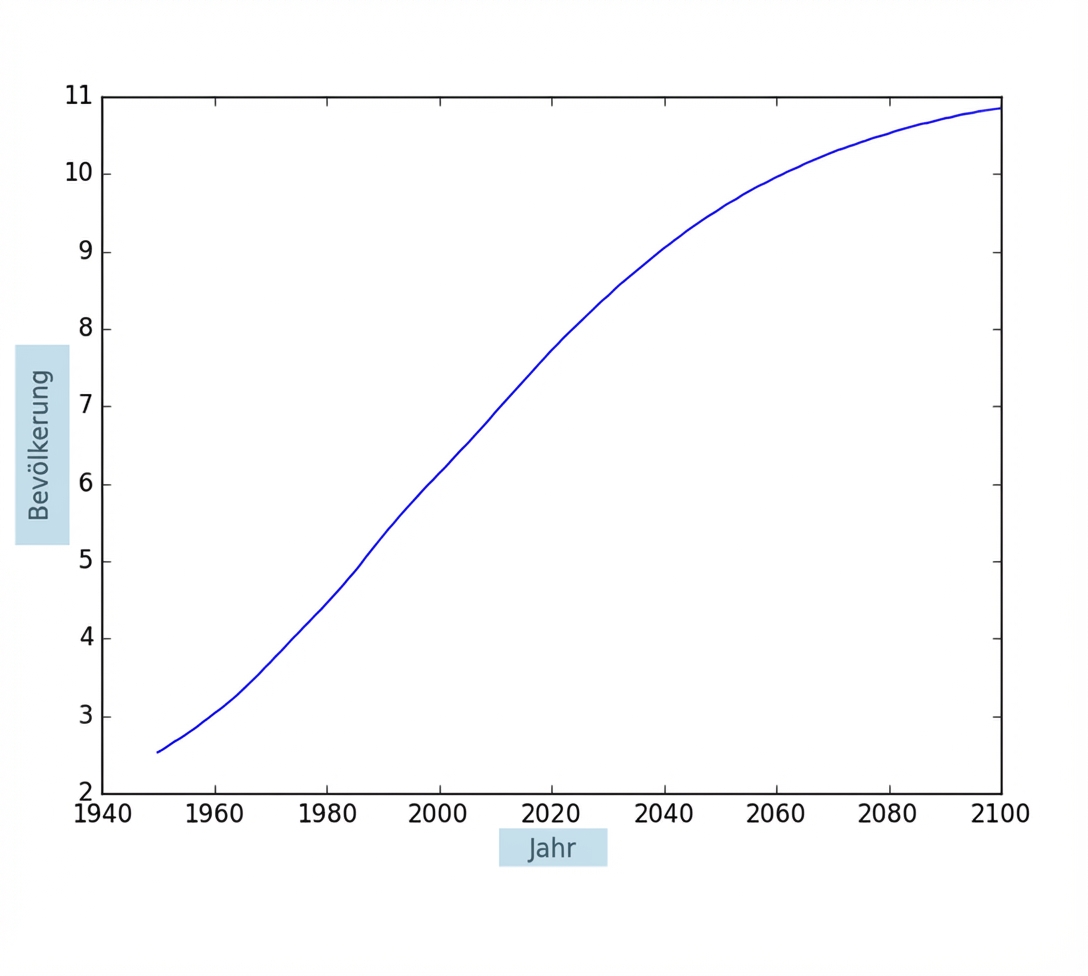
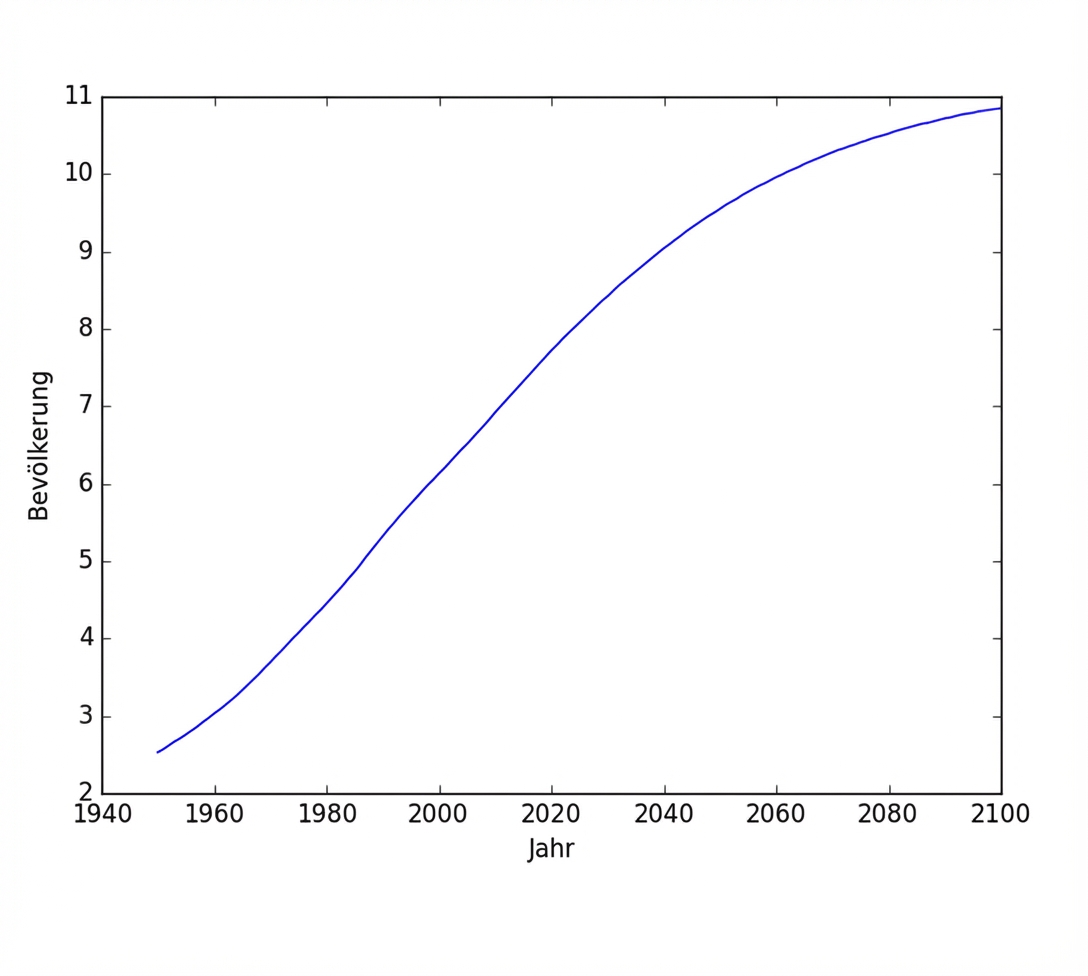
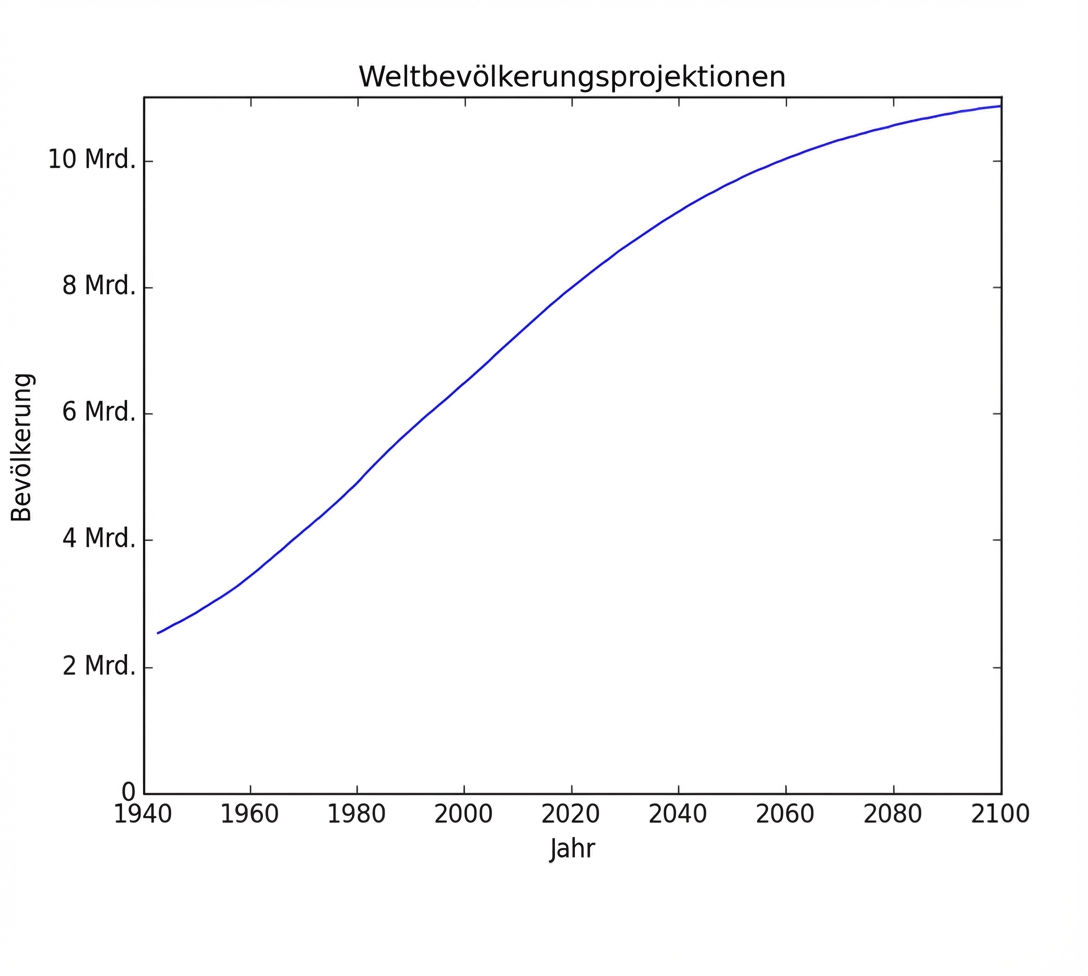
Achsenbeschriftungen
Achsenbeschriftungen
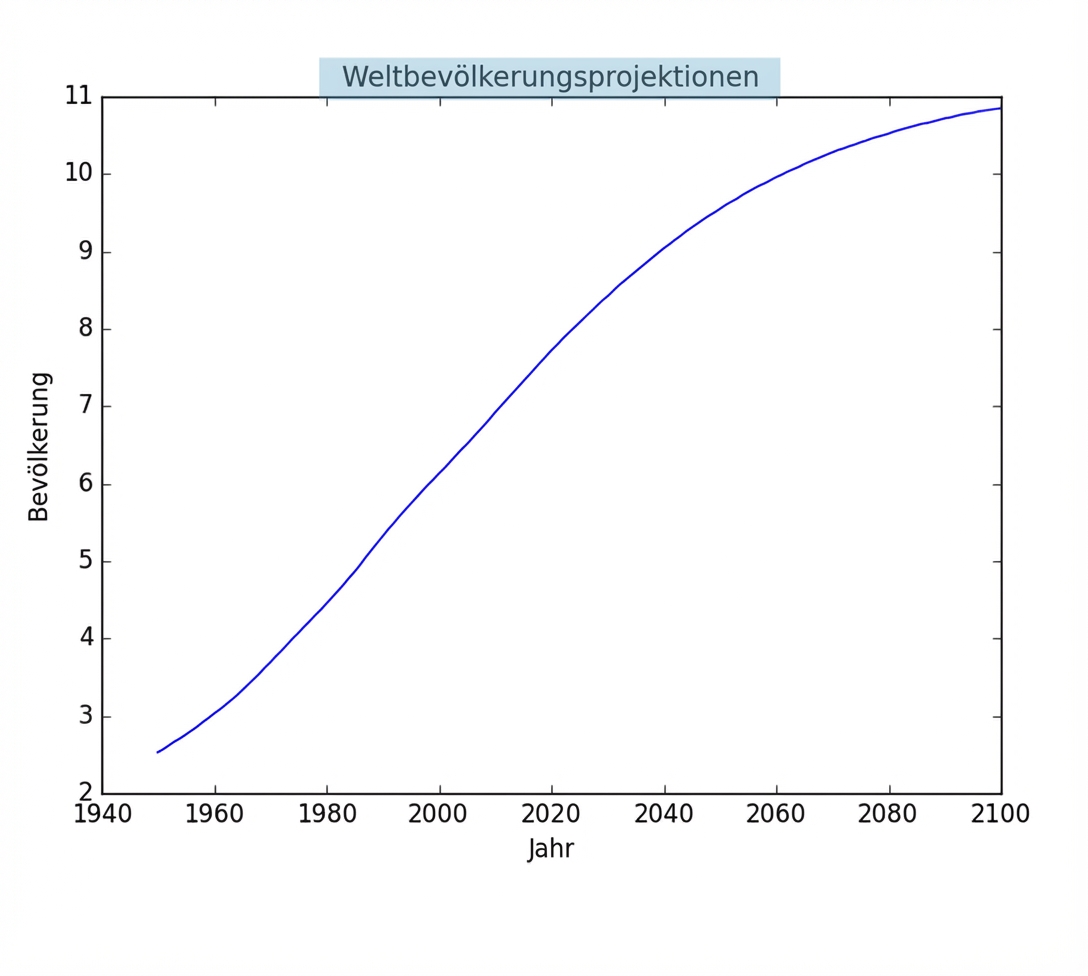
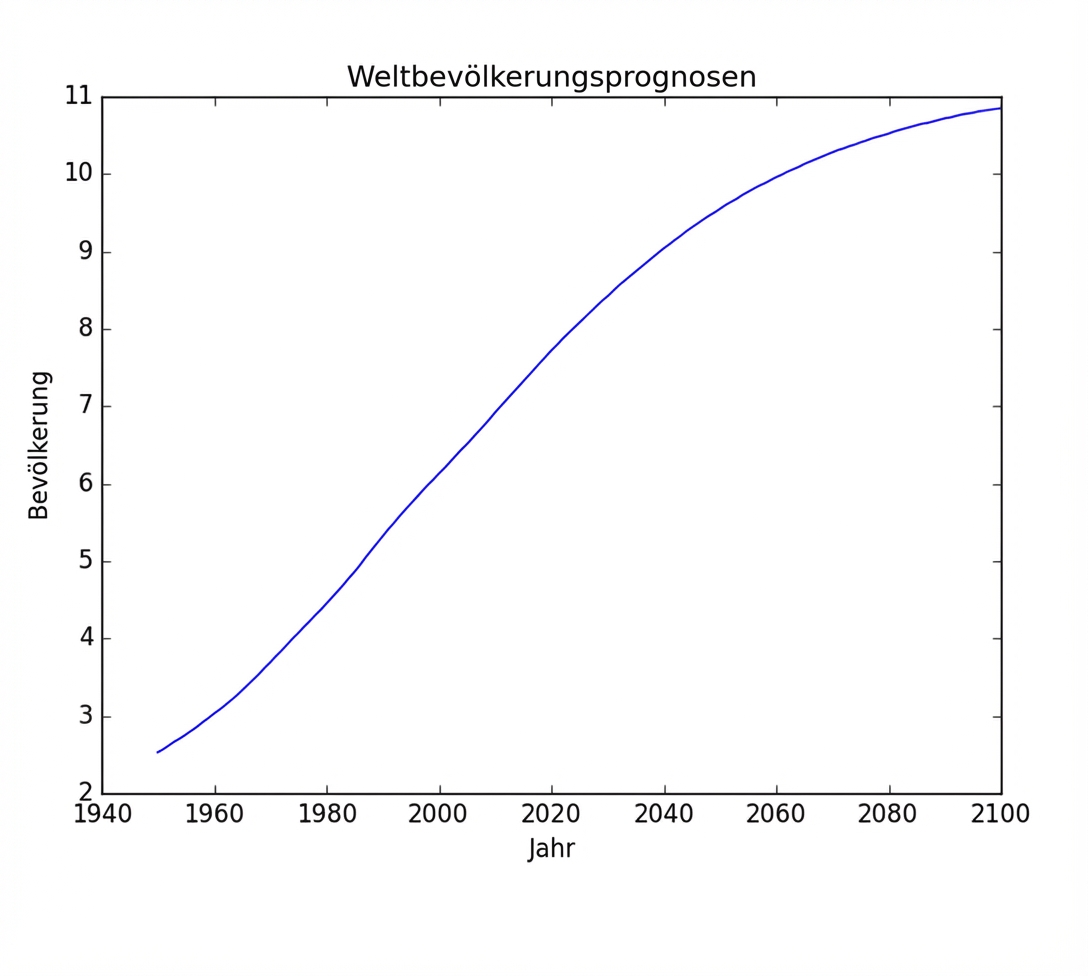
Titel
Titel
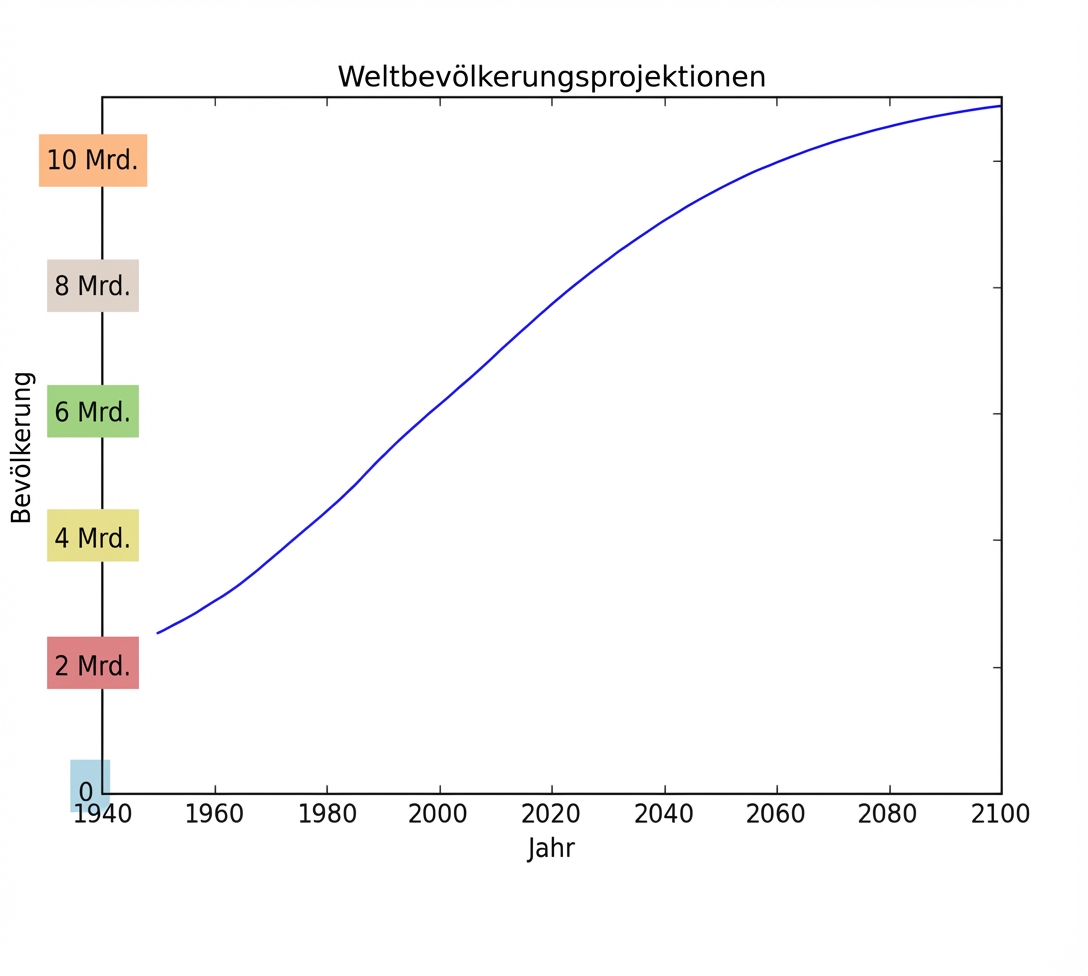
Teilstriche
Teilstriche
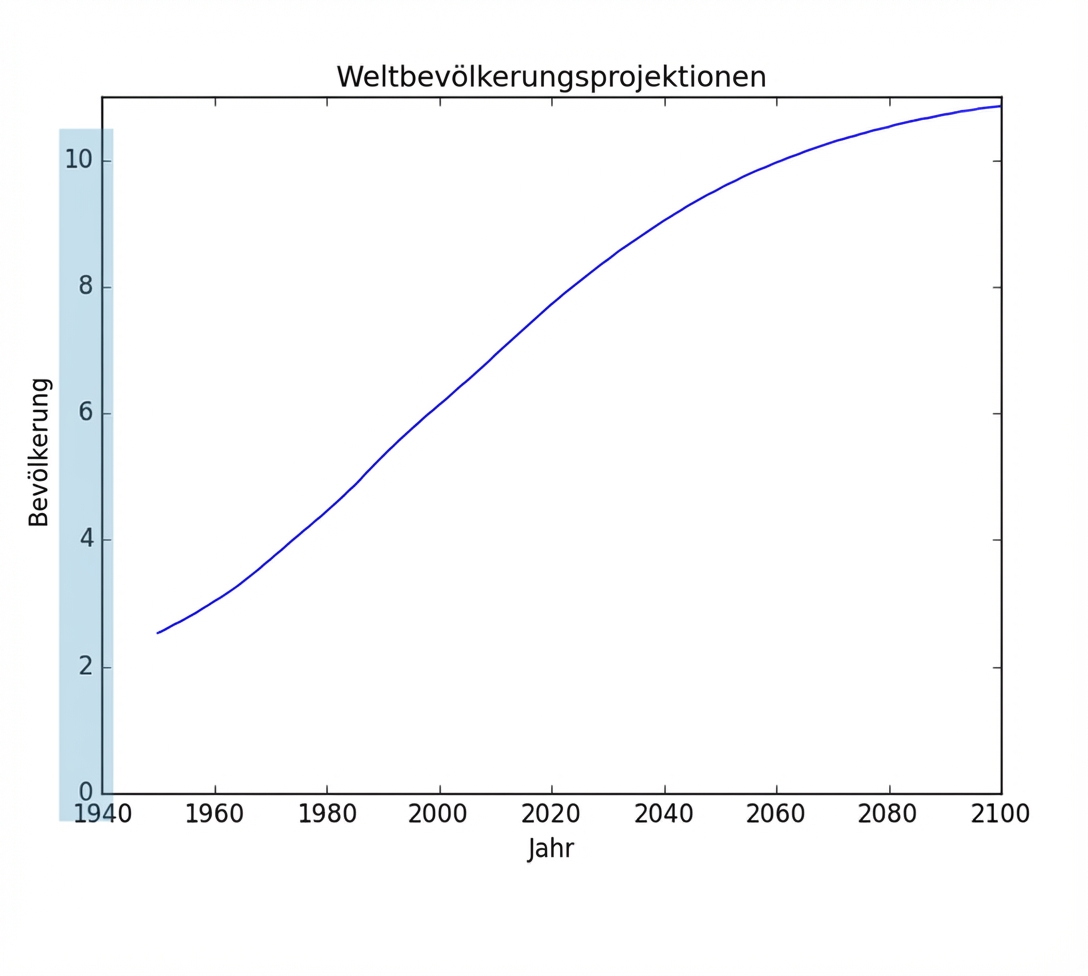
Teilstriche (2)
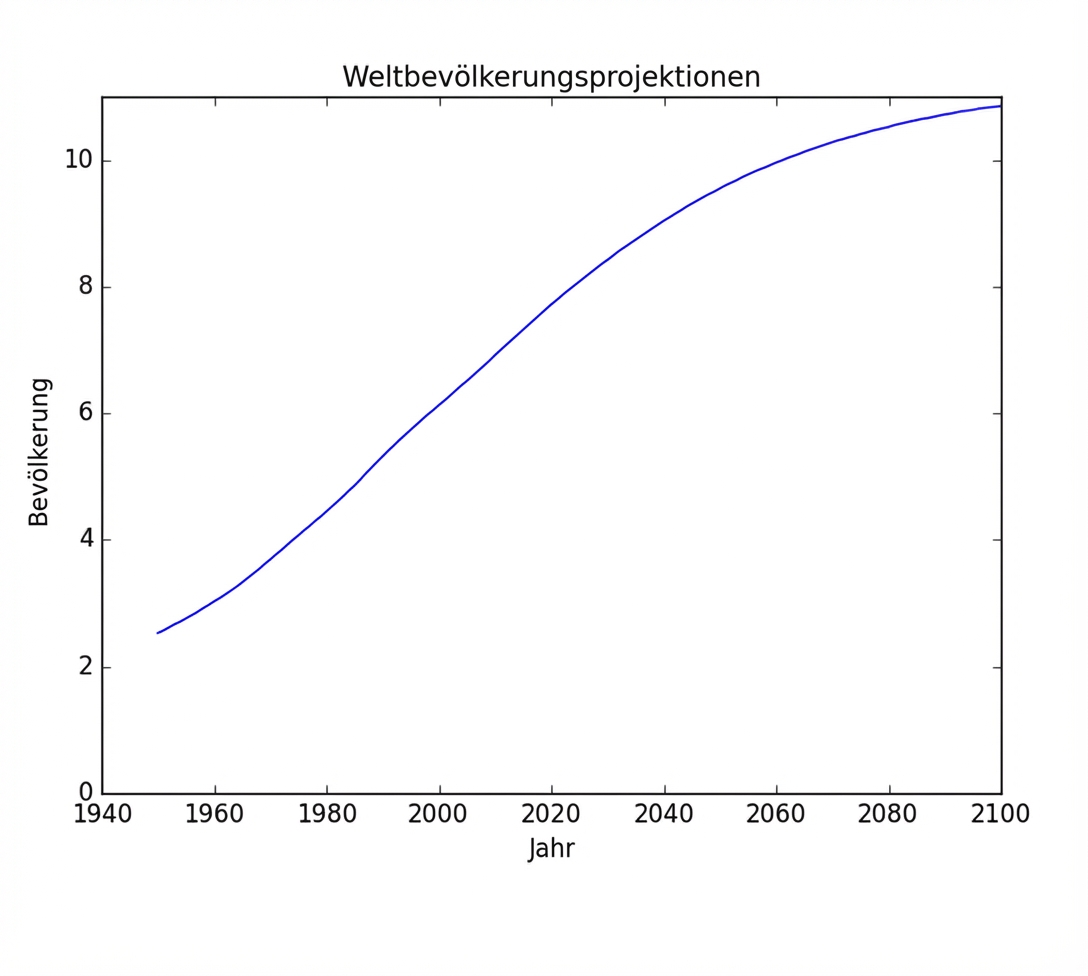
Teilstriche (2)
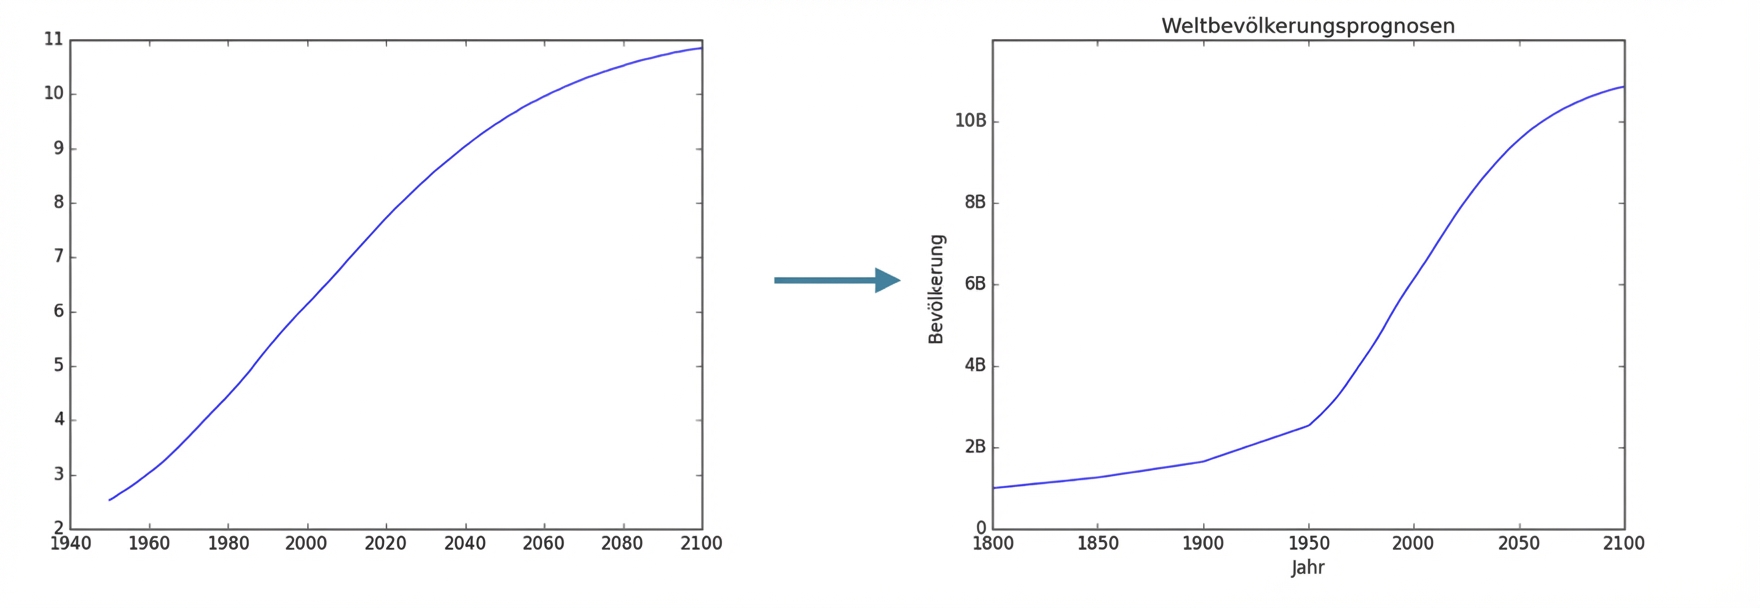
Hinzufügen historischer Daten
Hinzufügen historischer Daten
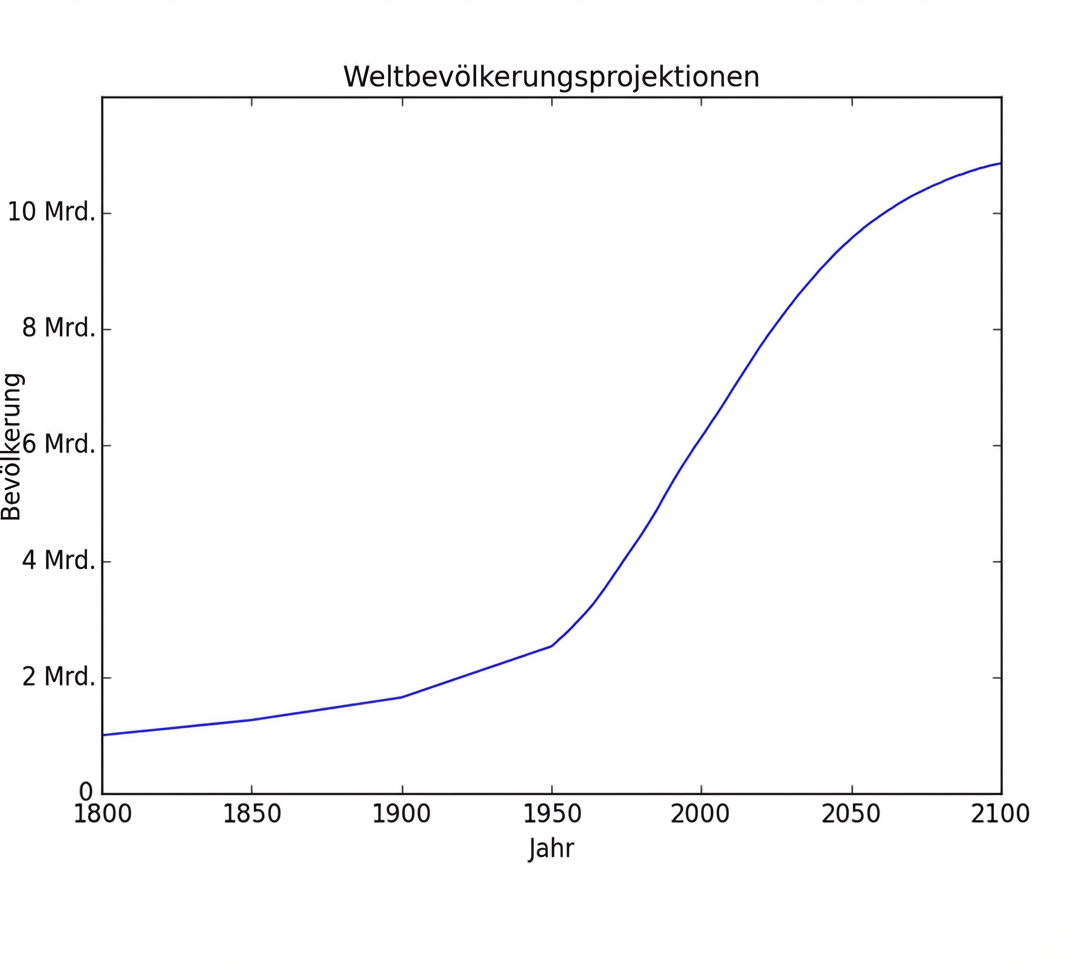
Vorher vs. nachher