Pandas, Teil 1
Python für Fortgeschrittene

Hugo Bowne-Anderson
Data Scientist at DataCamp
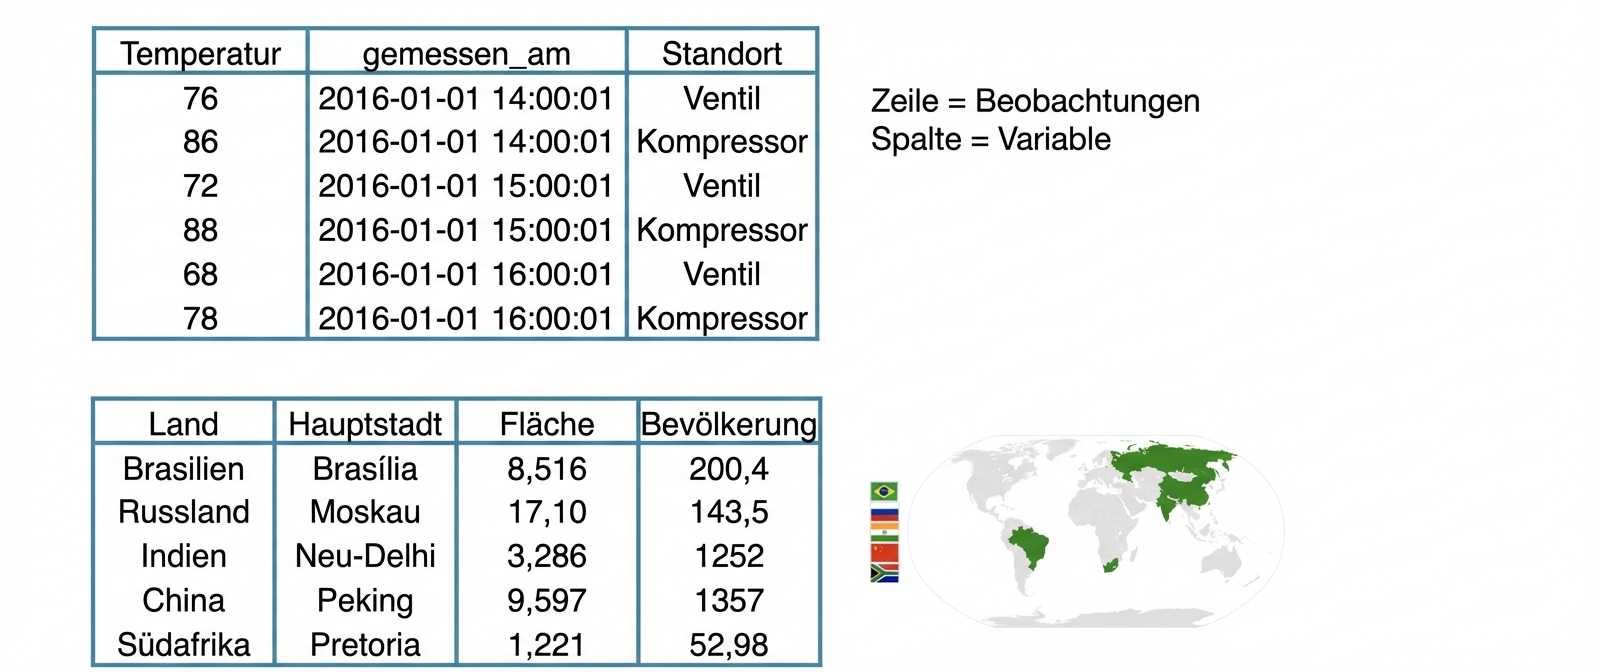
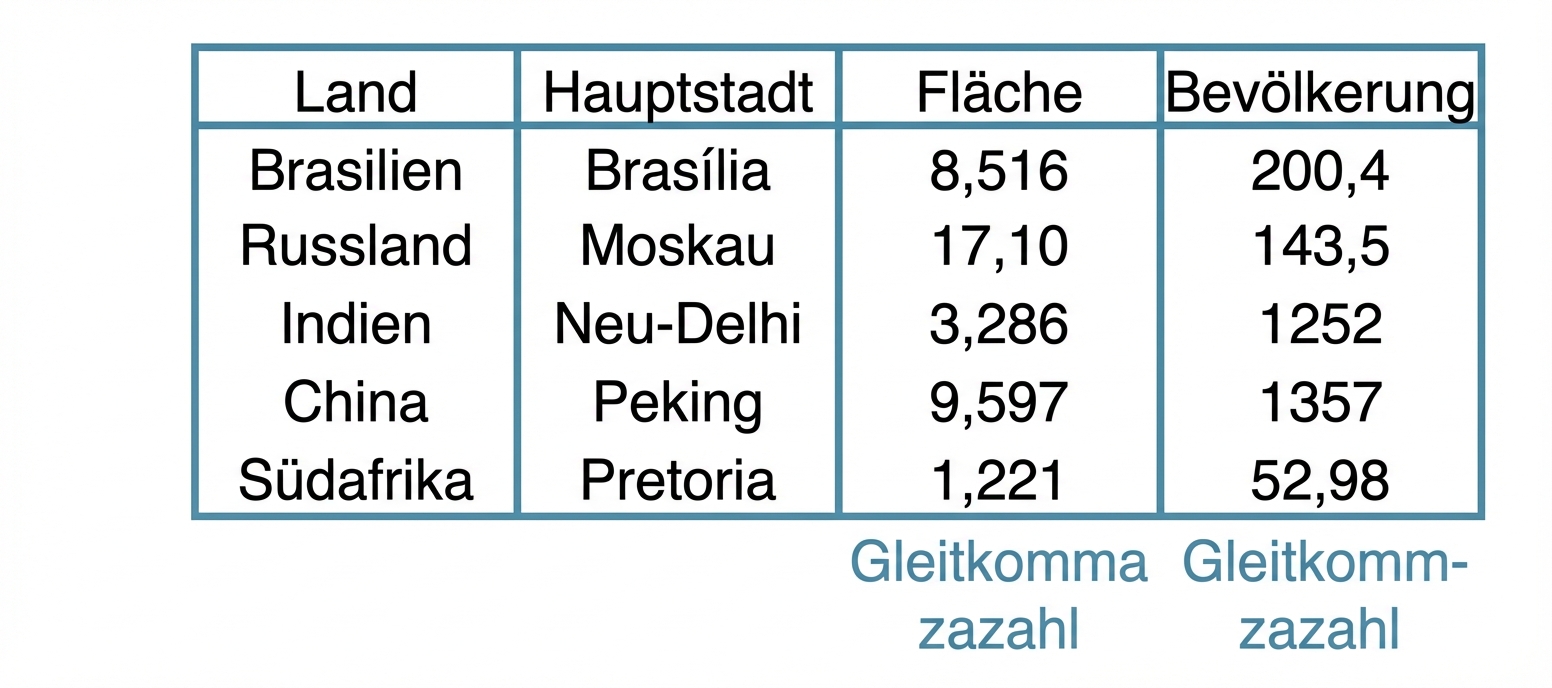
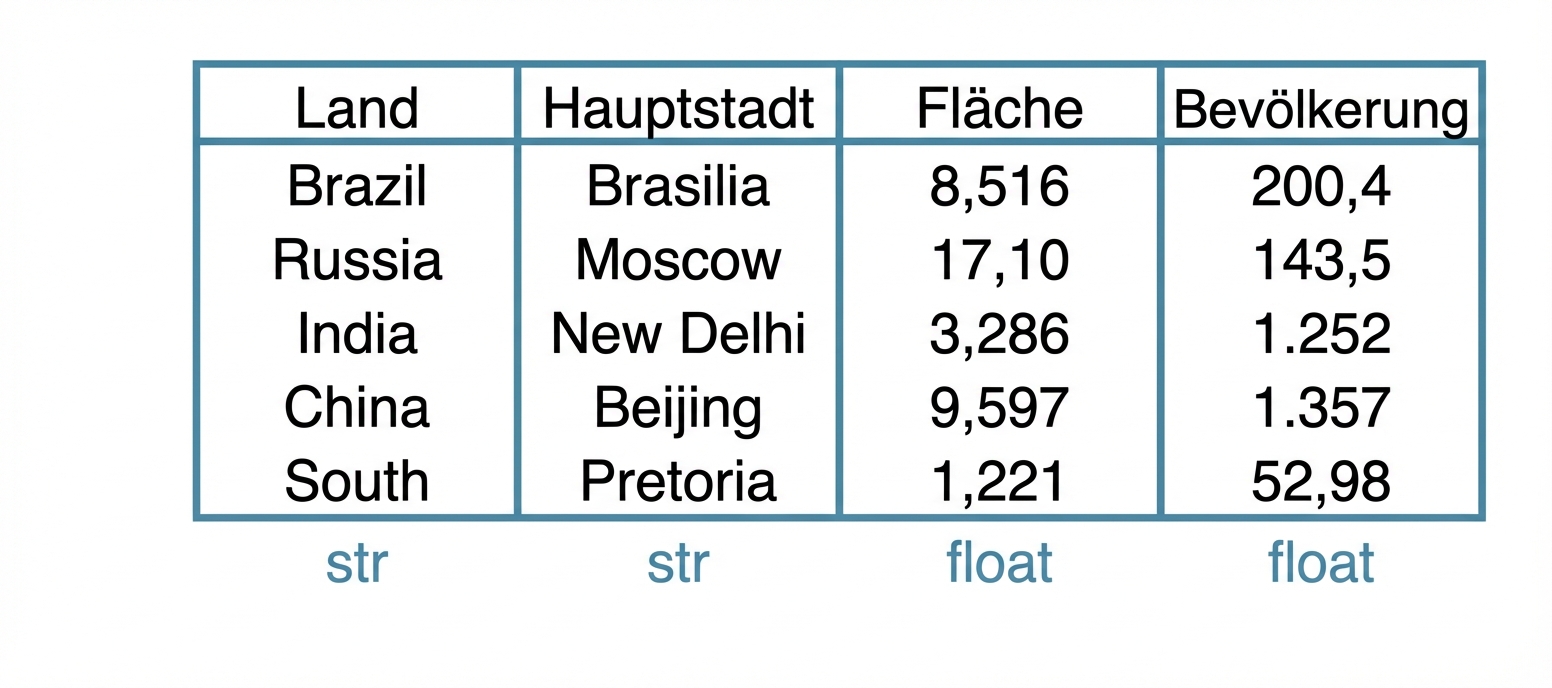
Beispiele für tabellarische Datensätze
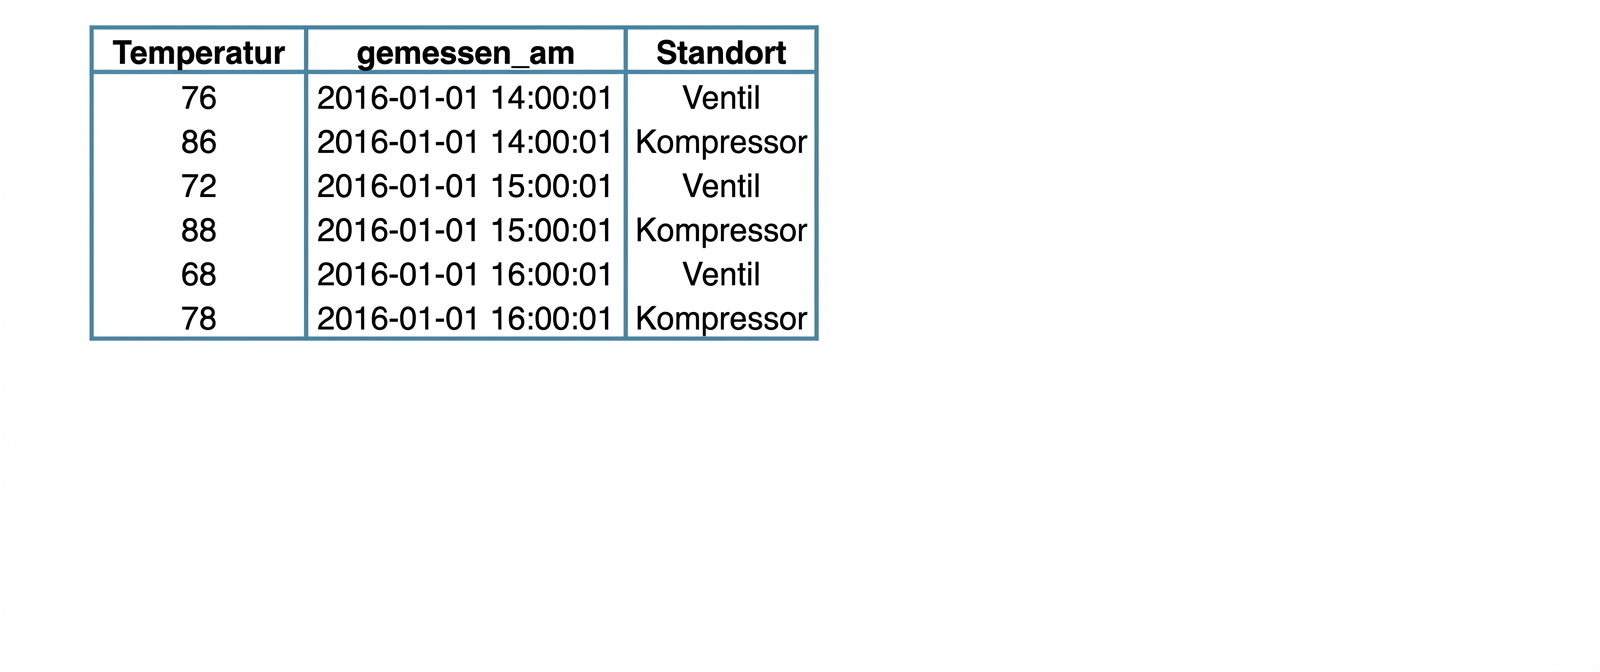
Beispiele für tabellarische Datensätze
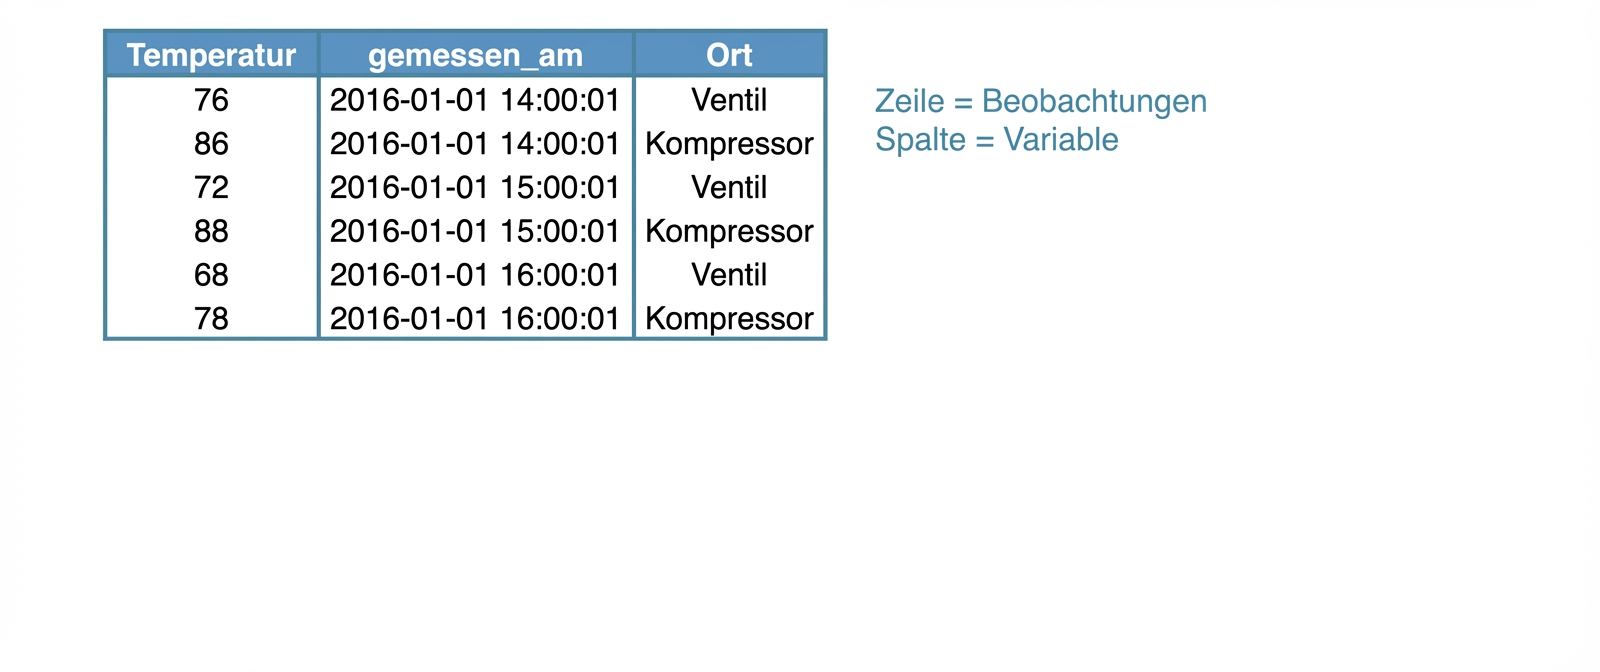
Beispiele für tabellarische Datensätze
Datensätze in Python
Datensätze in Python
- pandas!
- Werkzeug zur Datenbearbeitung mit hohem Abstraktionsniveau
- Wes McKinney
- Auf NumPy aufgebaut
- DataFrame

