Grundlegende Diagramme mit Matplotlib
Python für Fortgeschrittene

Hugo Bowne-Anderson
Data Scientist at DataCamp
Grundlegende Diagramme mit Matplotlib
- Visualisierung

- Datenstruktur

- Kontrollstrukturen

- Fallstudie

Datenvisualisierung
Sehr wichtig bei der Datenanalyse
- Daten erkunden
- Erkenntnisse aus dem Bericht
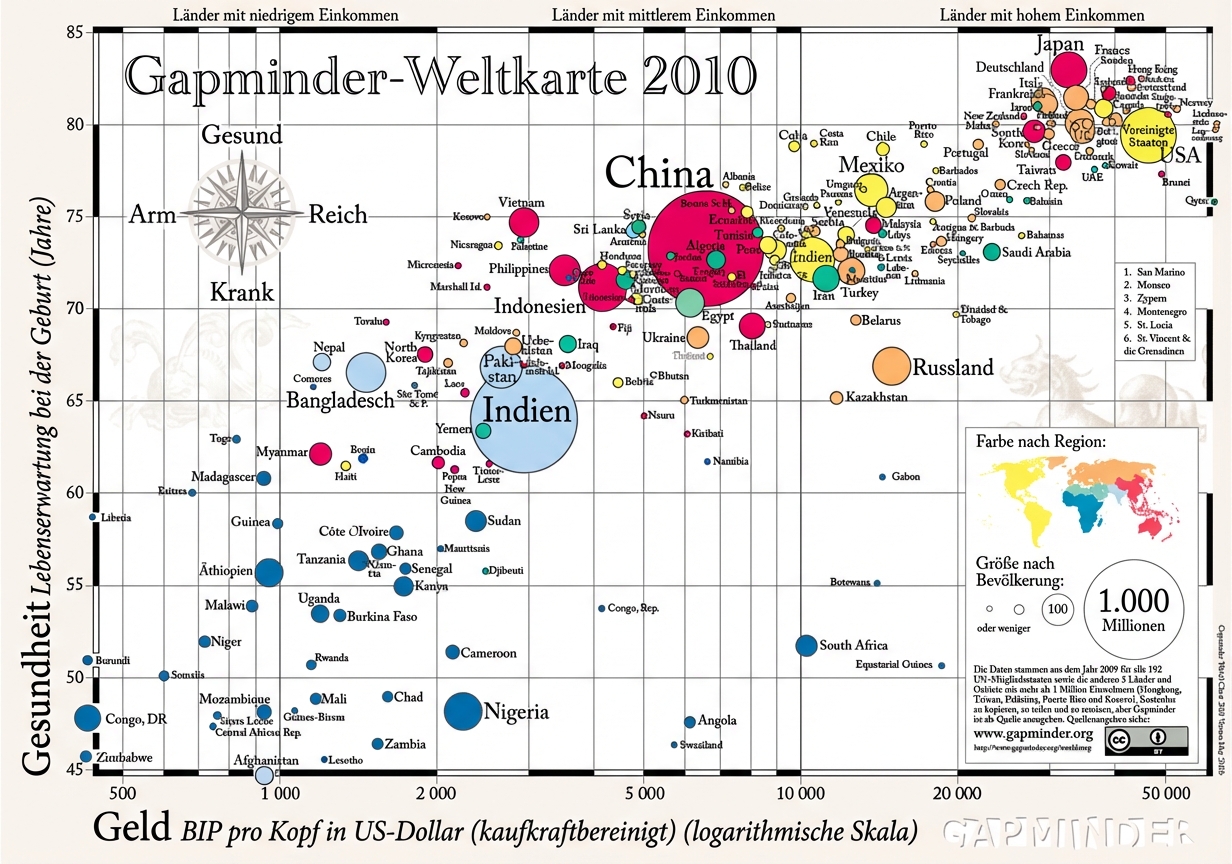
1 Quelle: GapMinder, Wealth and Health of Nations
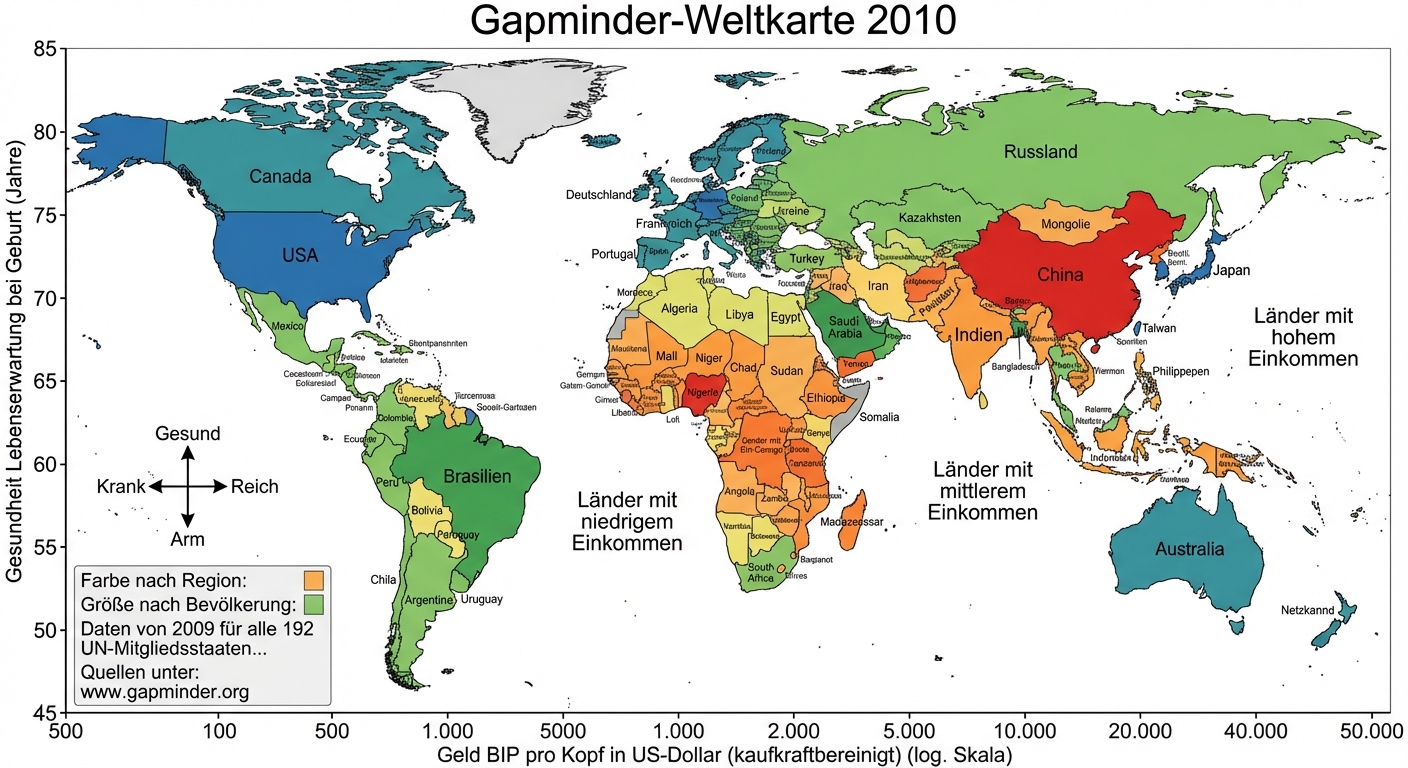
1 Quelle: GapMinder, Wealth and Health of Nations
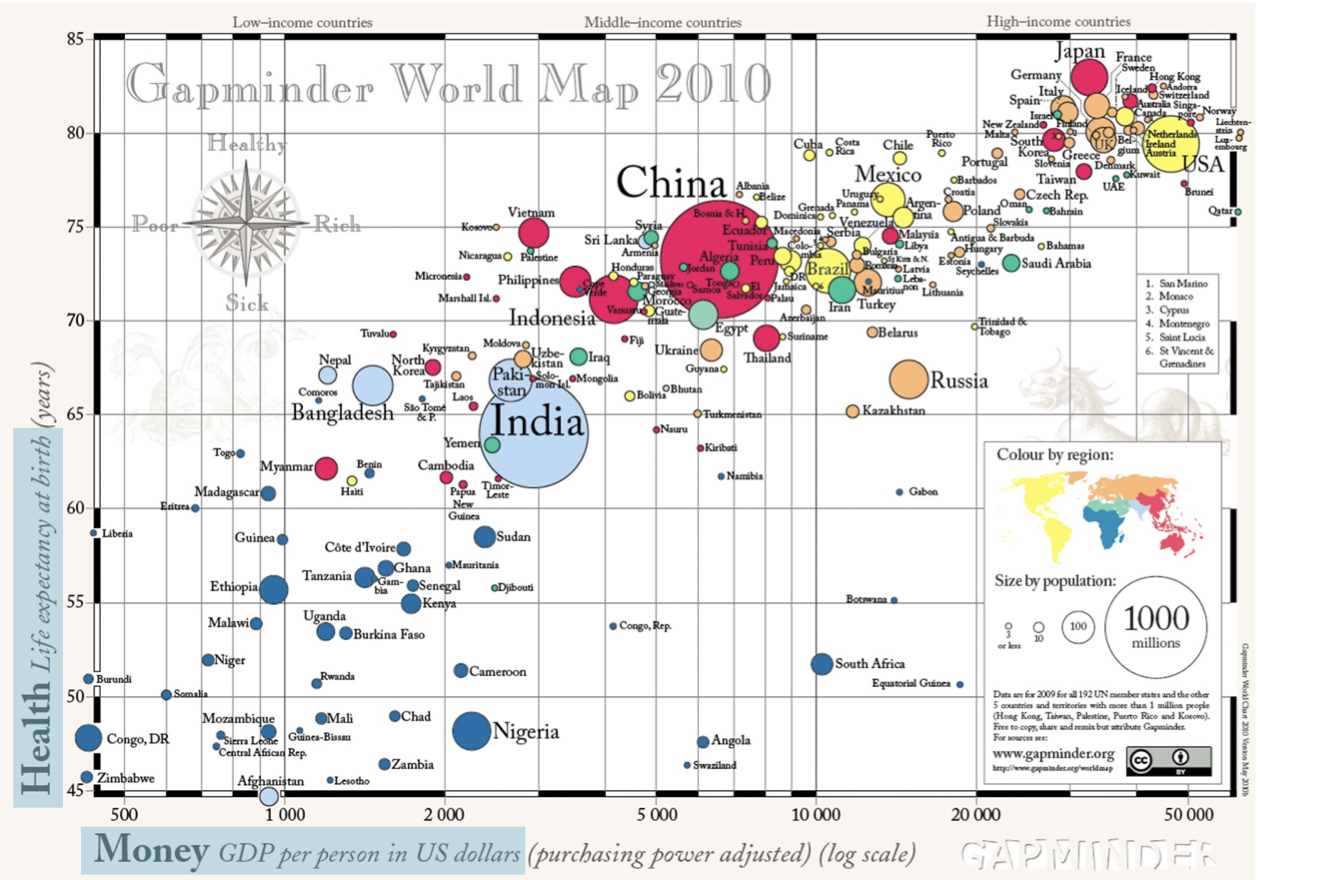
1 Quelle: GapMinder, Wealth and Health of Nations
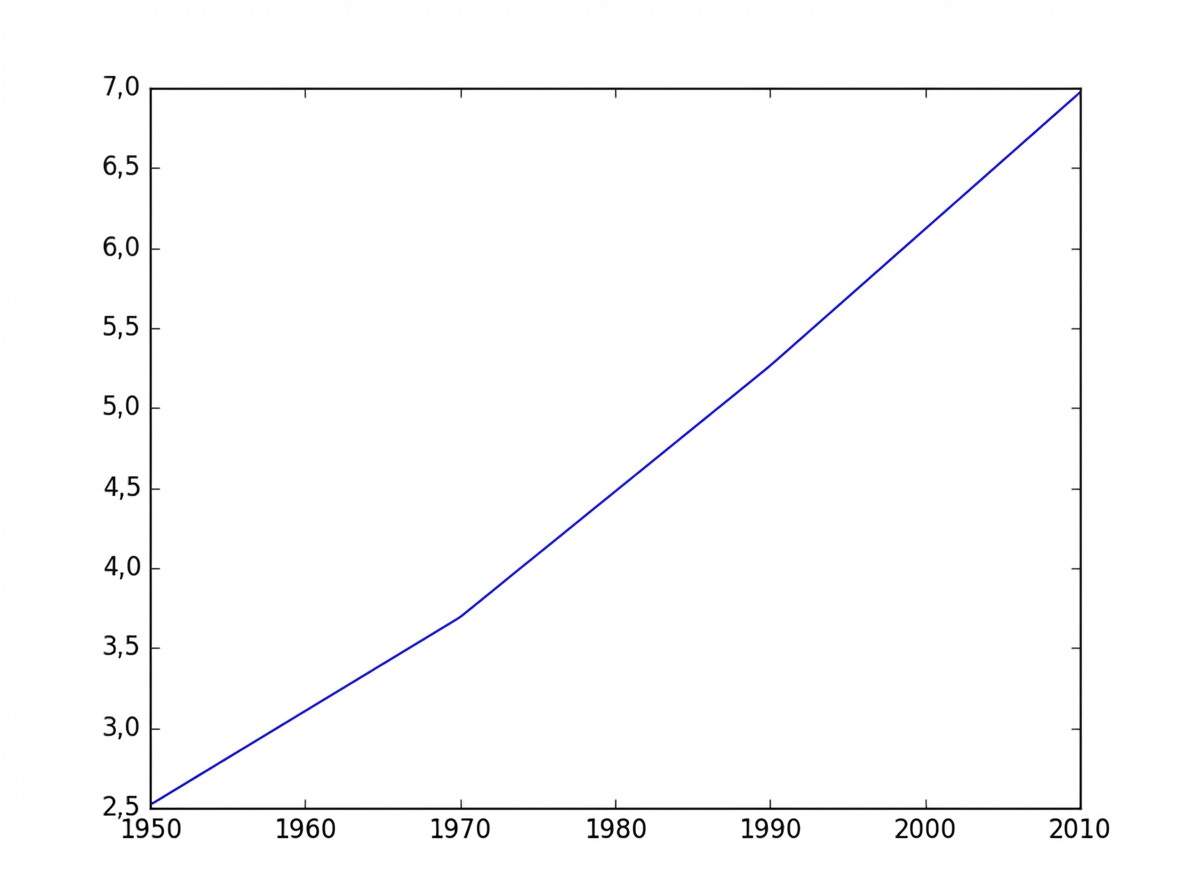
Matplotlib
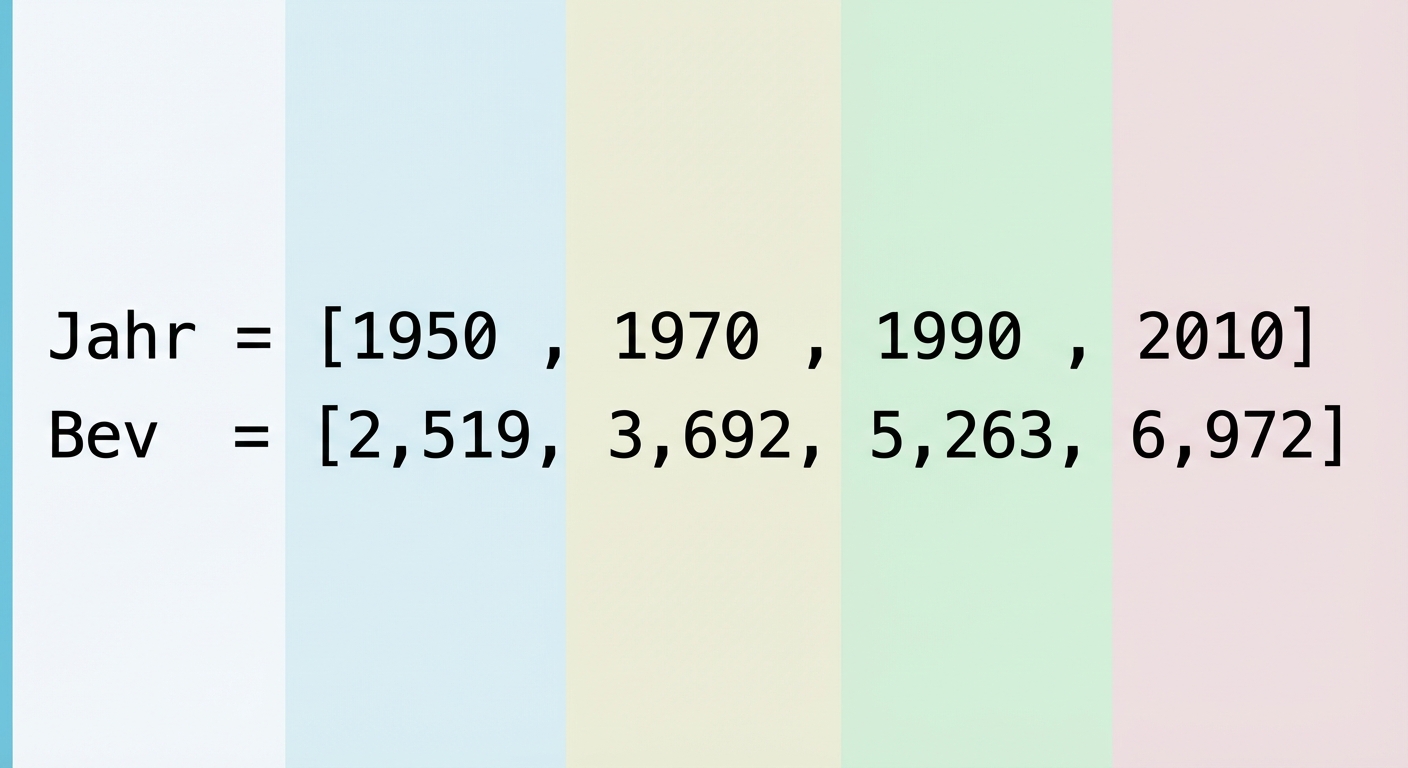
import matplotlib.pyplot as pltyear = [1950, 1970, 1990, 2010]pop = [2.519, 3.692, 5.263, 6.972]plt.plot(year, pop)plt.show()
Matplotlib
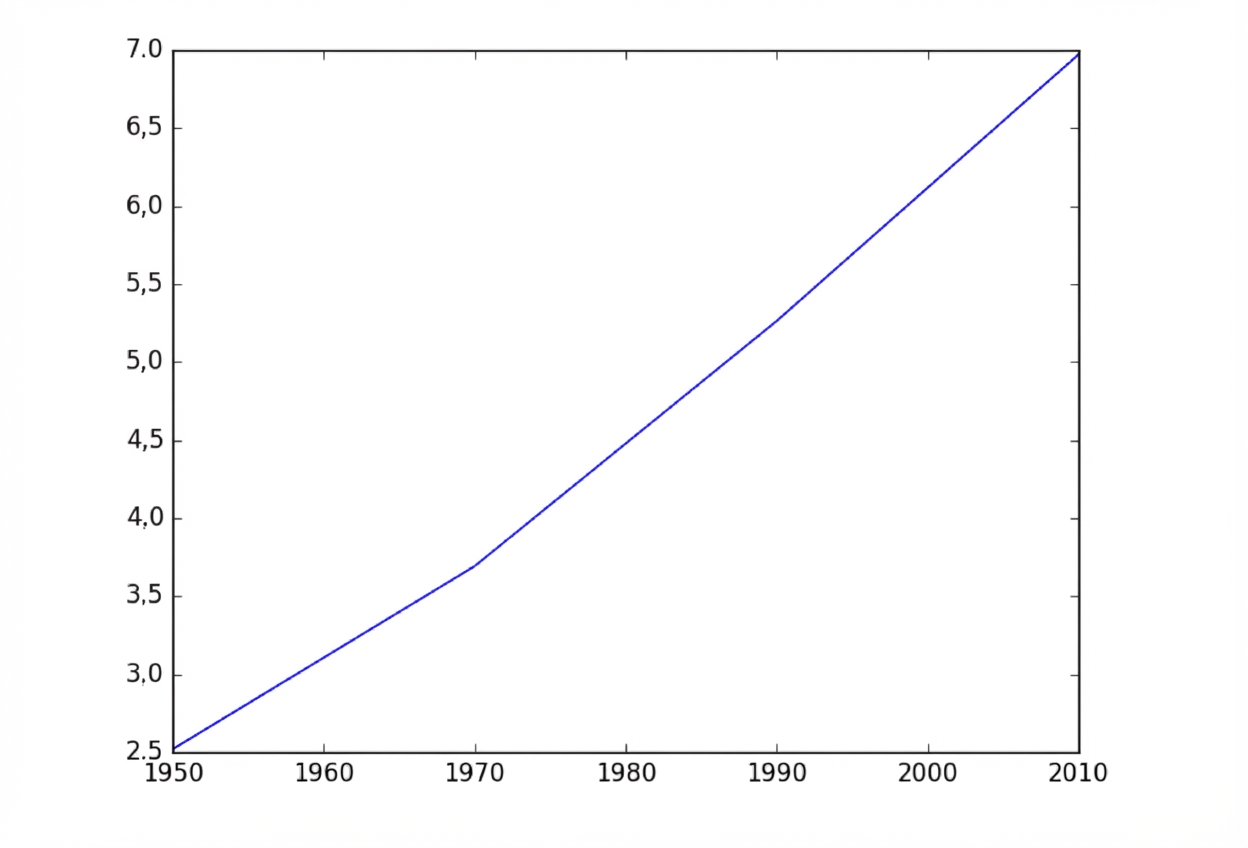
Matplotlib
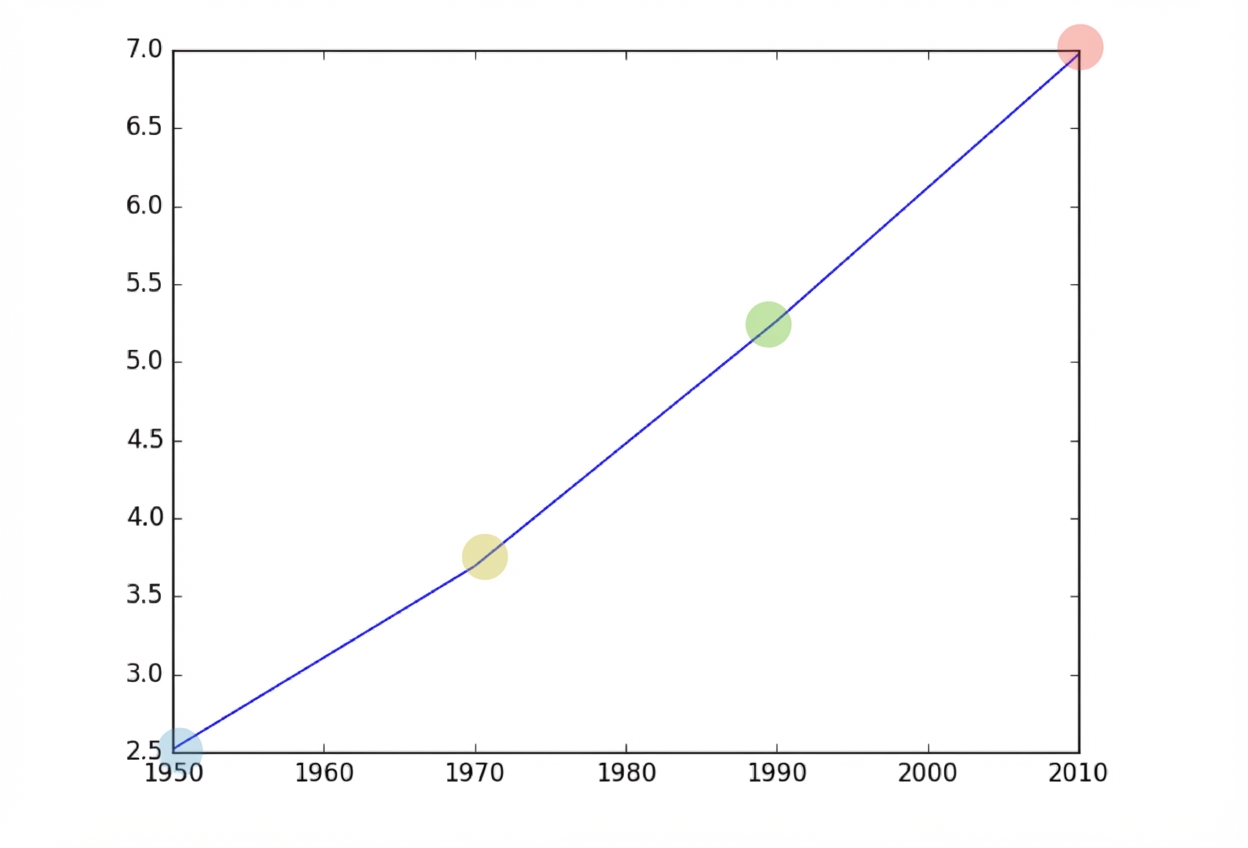
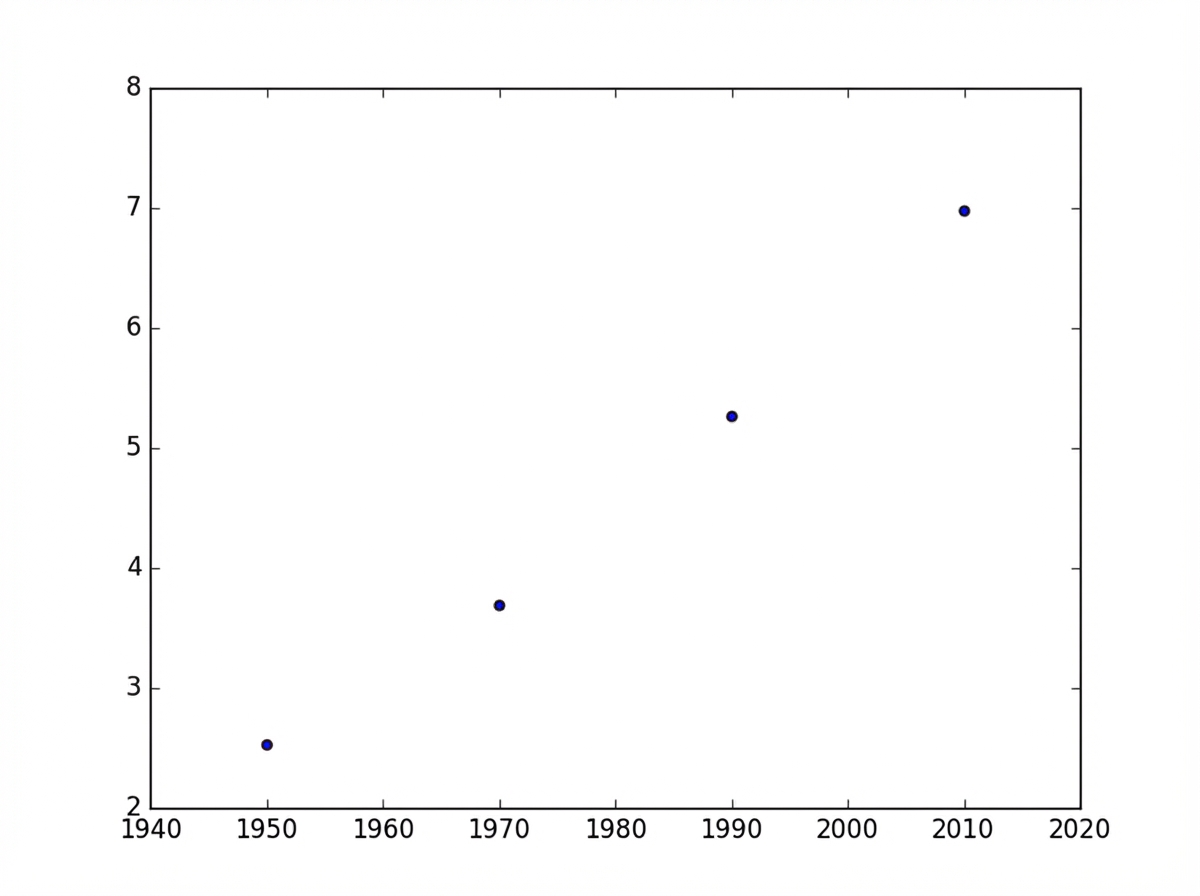
Streudiagramm
import matplotlib.pyplot as plt
year = [1950, 1970, 1990, 2010]
pop = [2.519, 3.692, 5.263, 6.972]
plt.scatter(year, pop)
plt.show()