Verteilung
Python für Fortgeschrittene

Hugo Bowne-Anderson
Data Scientist at DataCamp
Verteilung

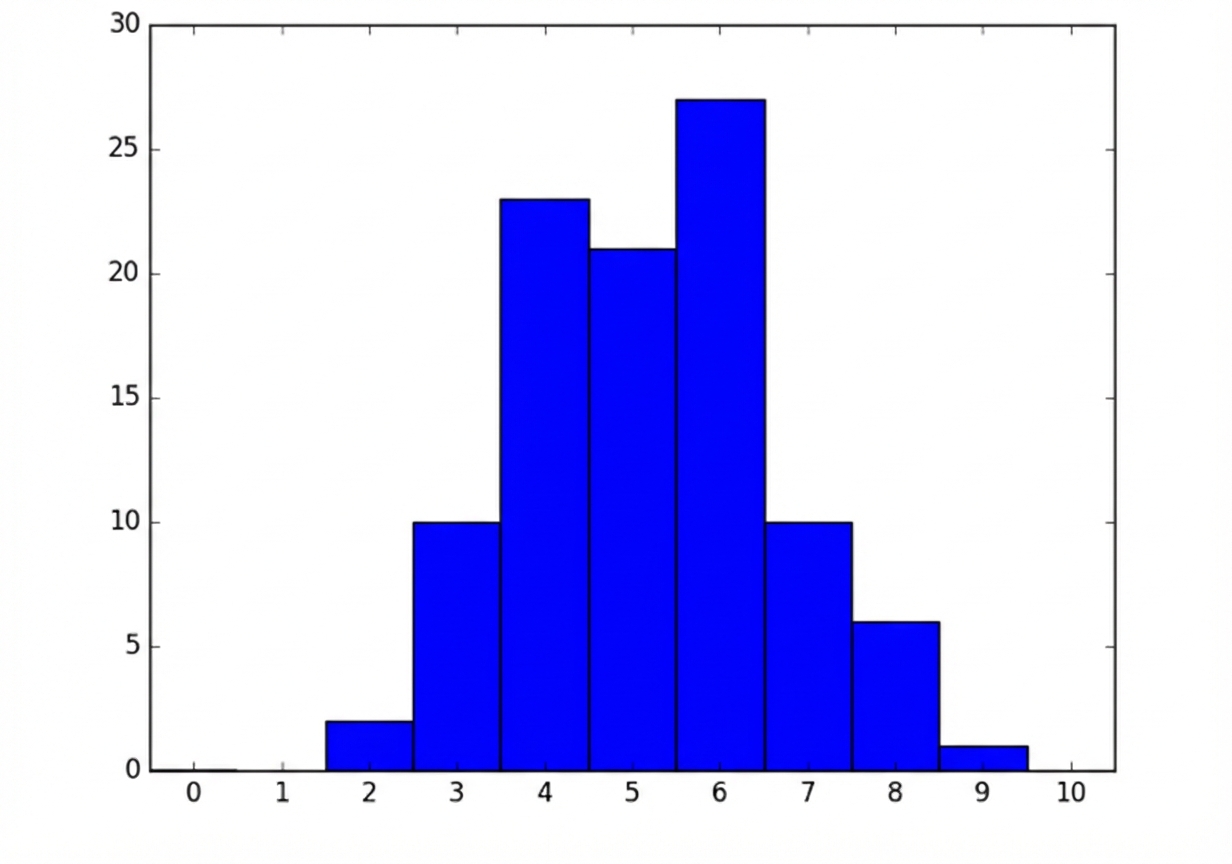
Histogramm, 100 Durchläufe
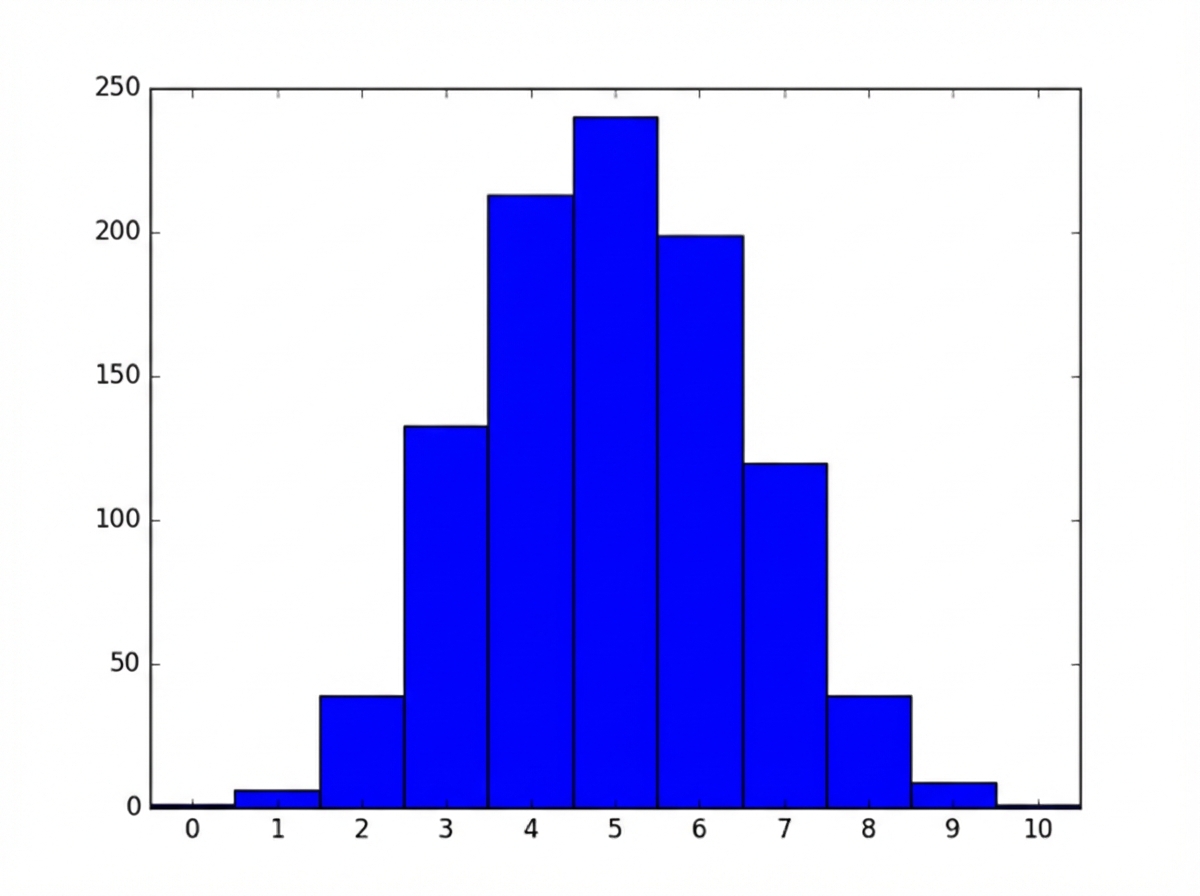
Histogramm, 1.000 Durchläufe
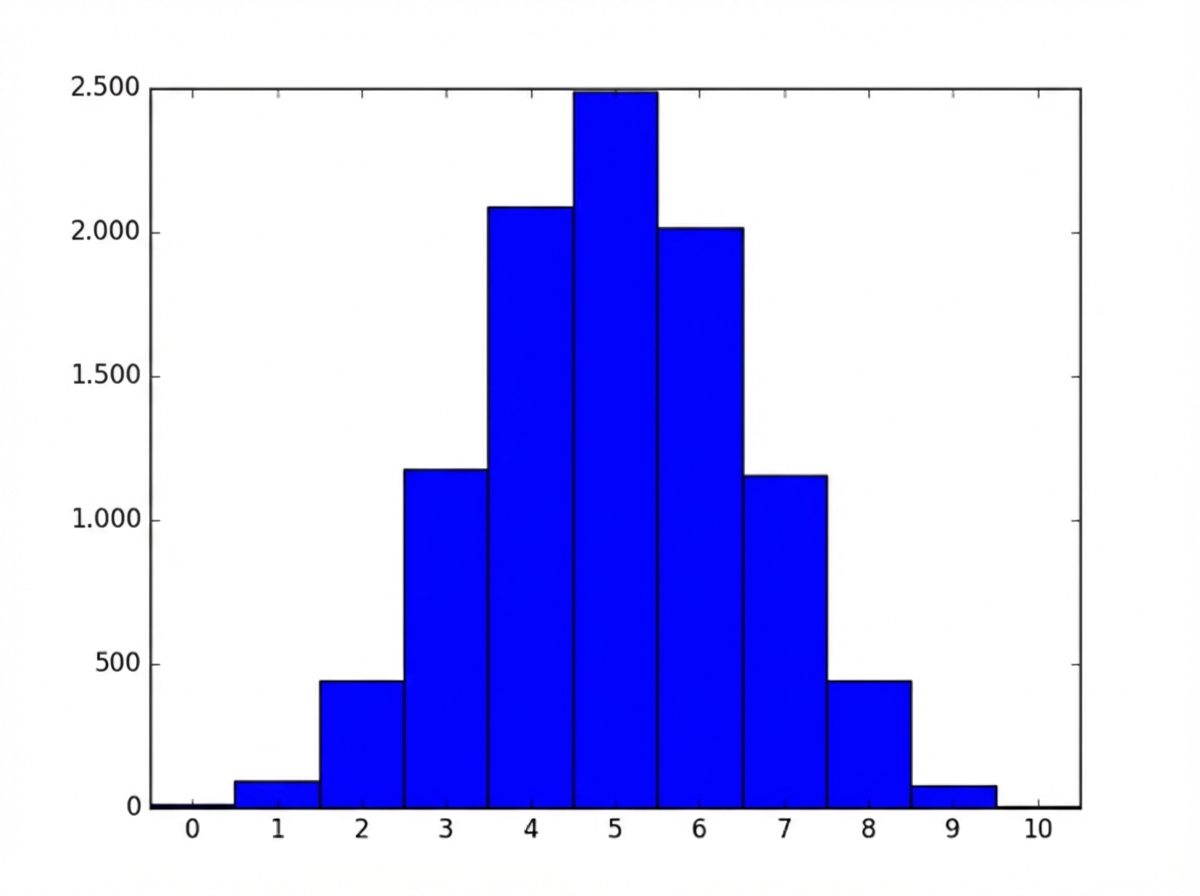
Histogramm, 10.000 Durchläufe
Python für Fortgeschrittene
Hugo Bowne-Anderson
Data Scientist at DataCamp

