What is covariate shift?
Monitoring Machine Learning Concepts

Hakim Elakhrass
Co-founder and CEO of NannyML
Why joint probability distribution?
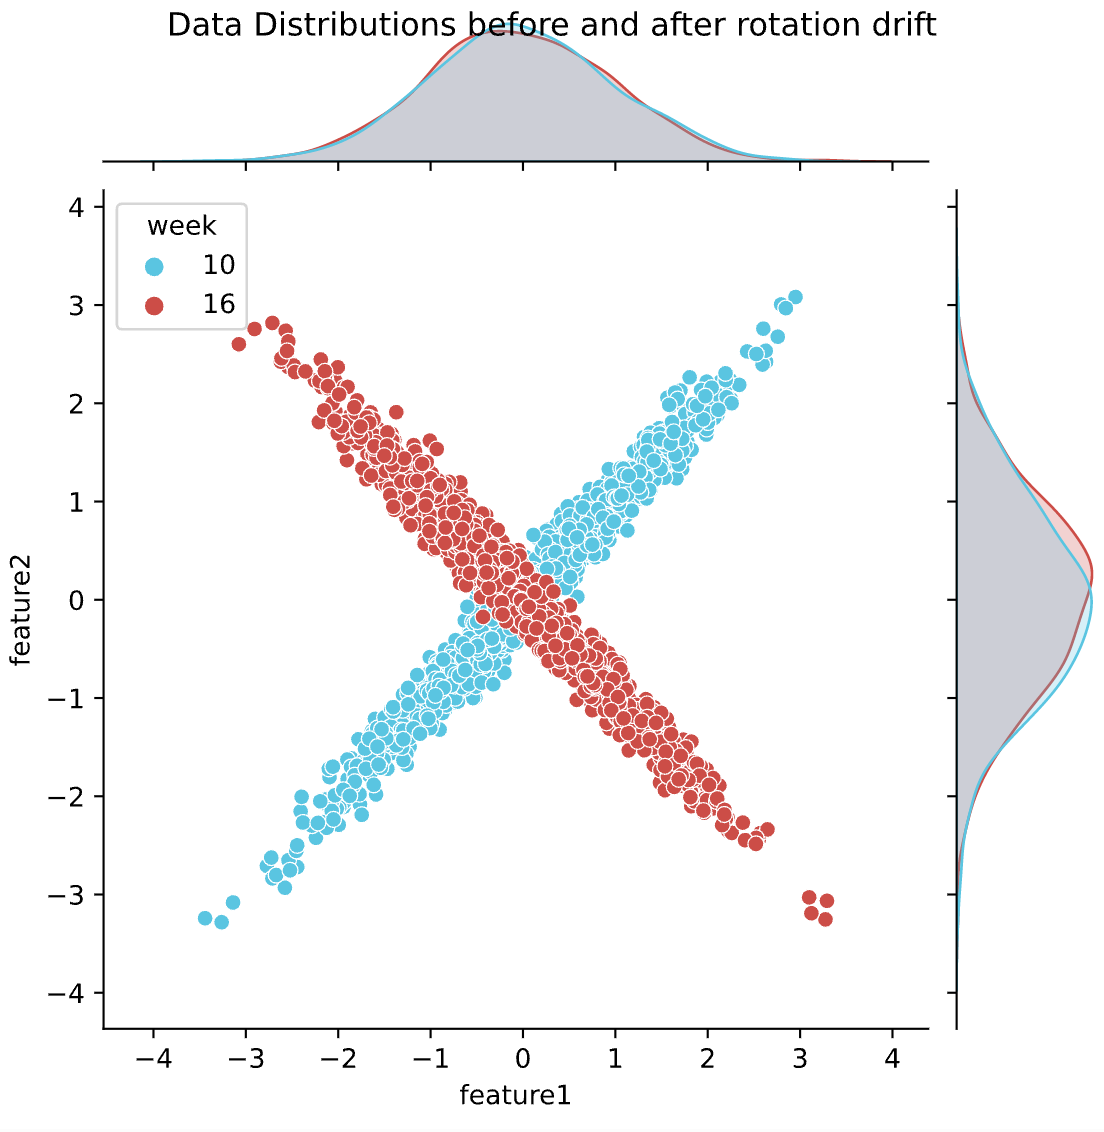
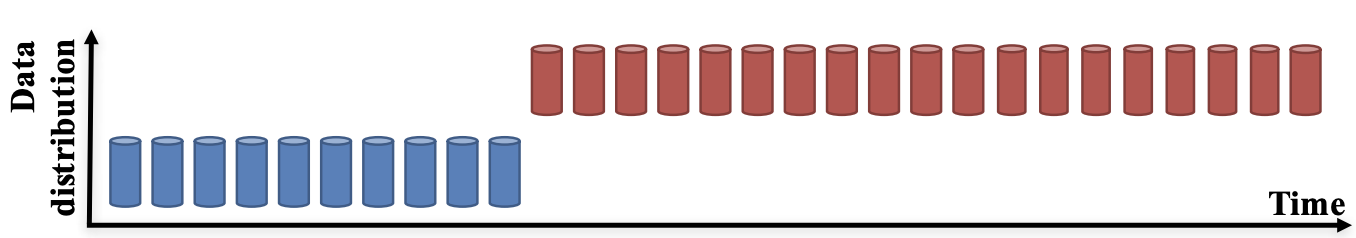
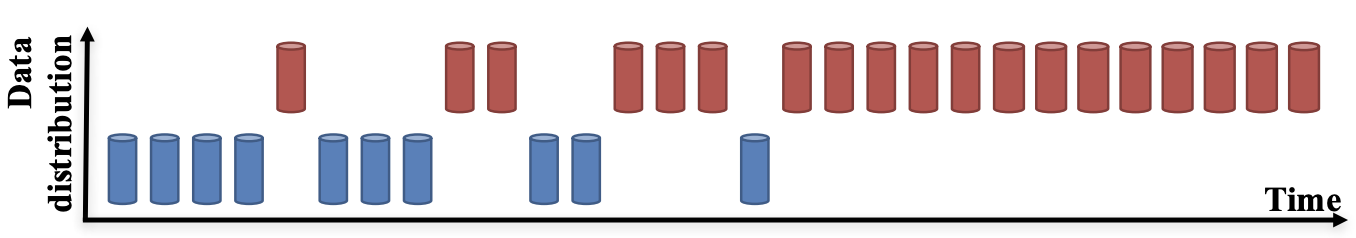
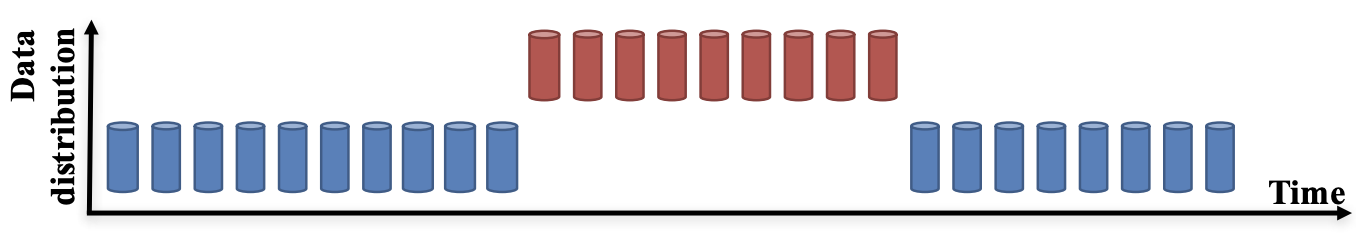
How does covariate shift occur?
How to detect the covariate shift?
Univariate method
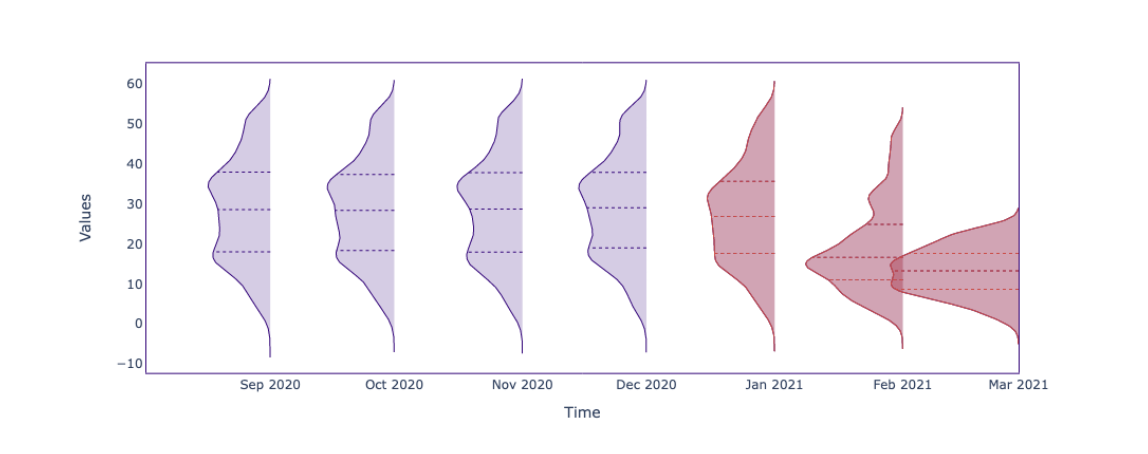
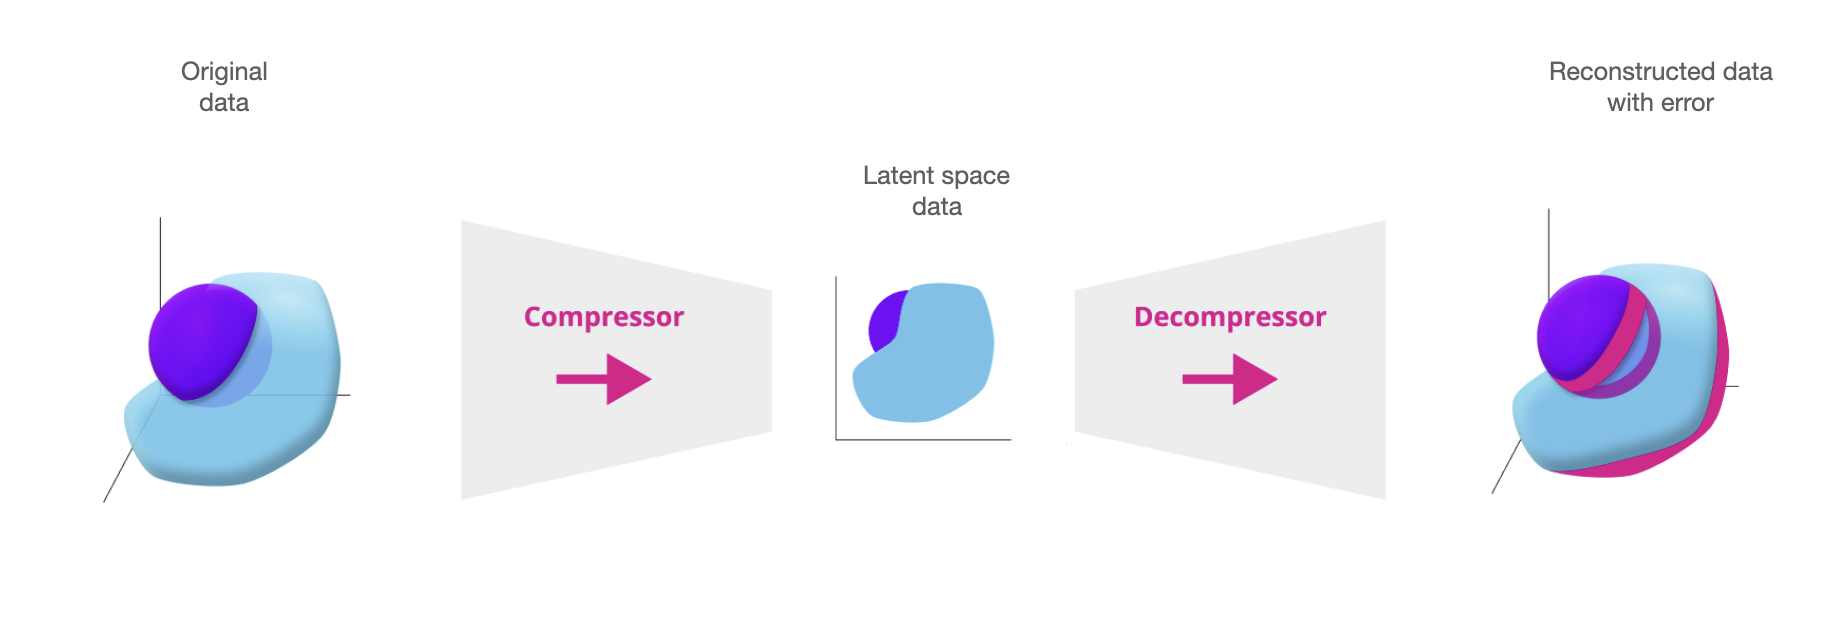
Multivariate method
1 https://app.datacamp.com/learn/courses/dimensionality-reduction-in-python

