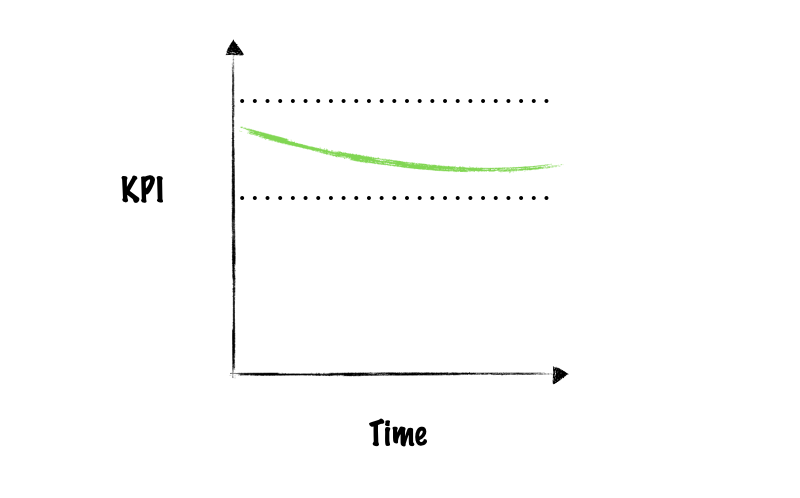
The ideal monitoring workflow
Monitoring Machine Learning Concepts

Hakim Elakhrass
Co-founder and CEO of NannyML
Monitoring workflows
Ideal monitoring workflow
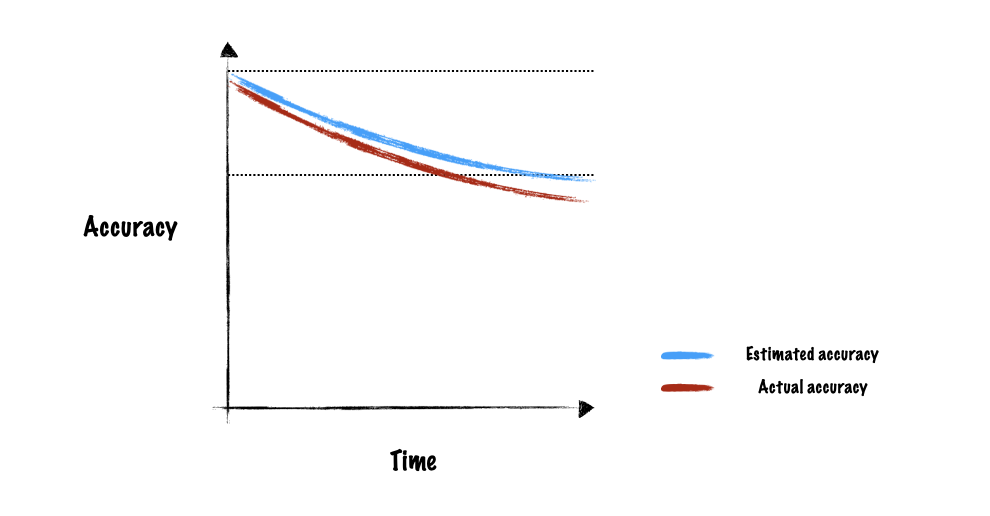
Technical performance monitoring
- Calculate and estimate performance
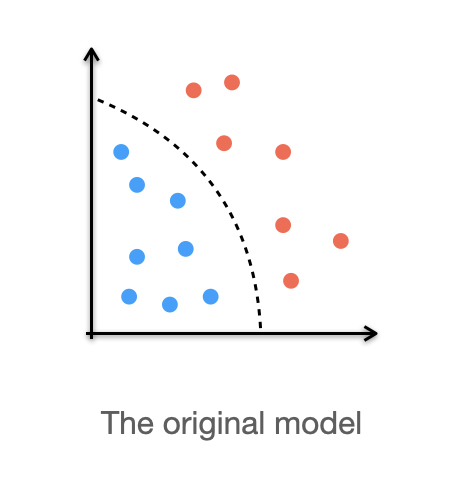
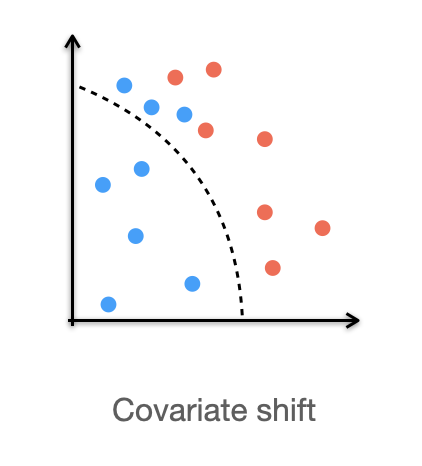
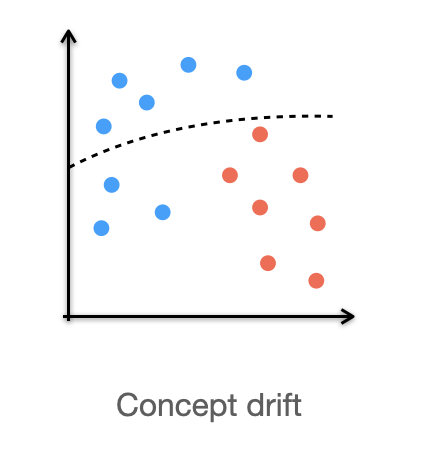
Root cause analysis
- Allows to link drifts with drops in performance
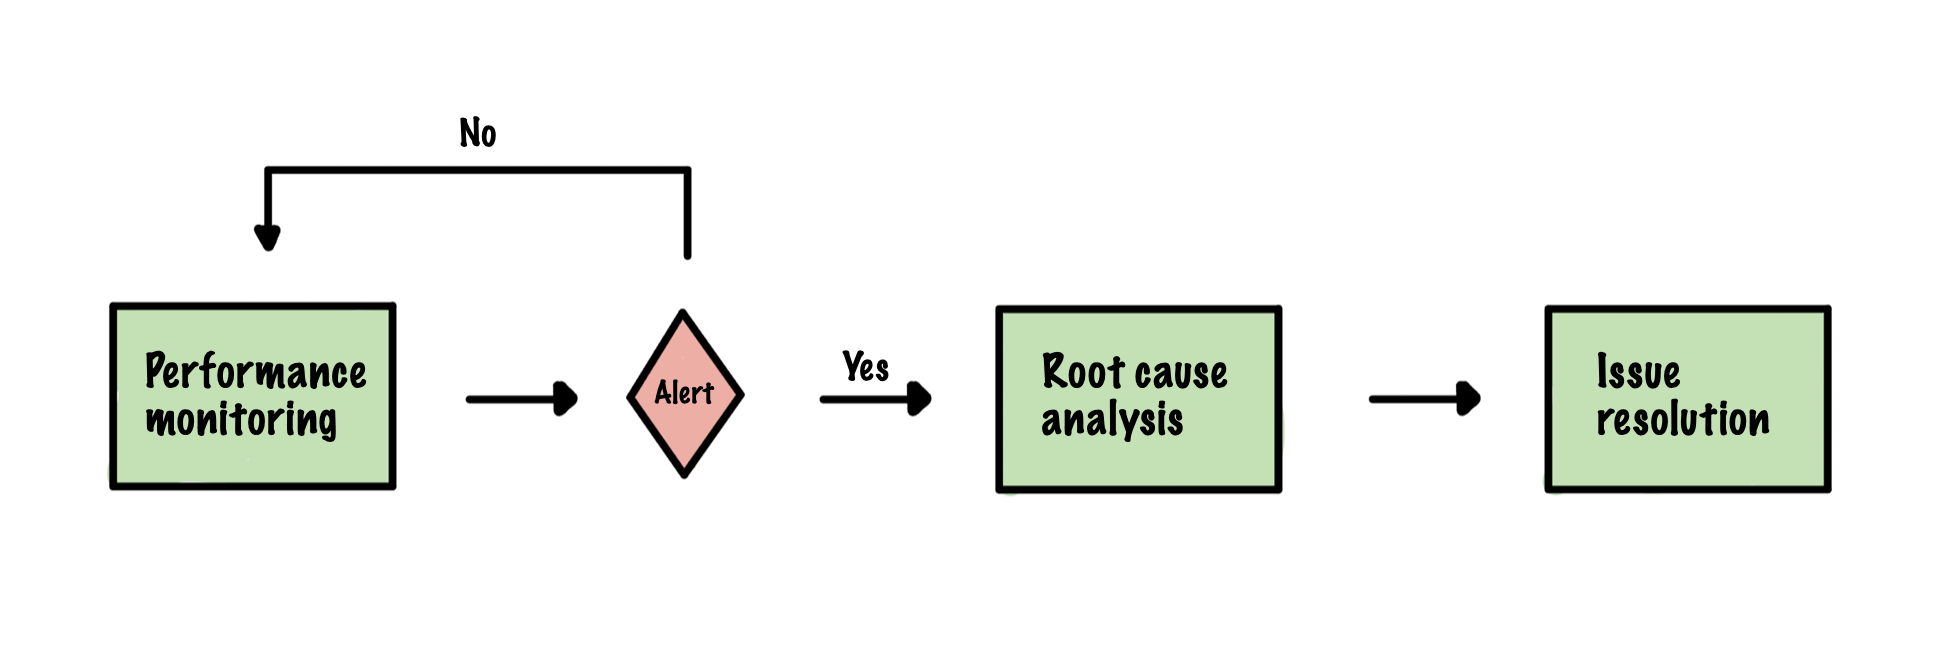
Monitoring performance
Root Cause Analysis
Issue resolution