Medidas de dispersión
Introducción a la estadística en Python

Maggie Matsui
Content Developer, DataCamp
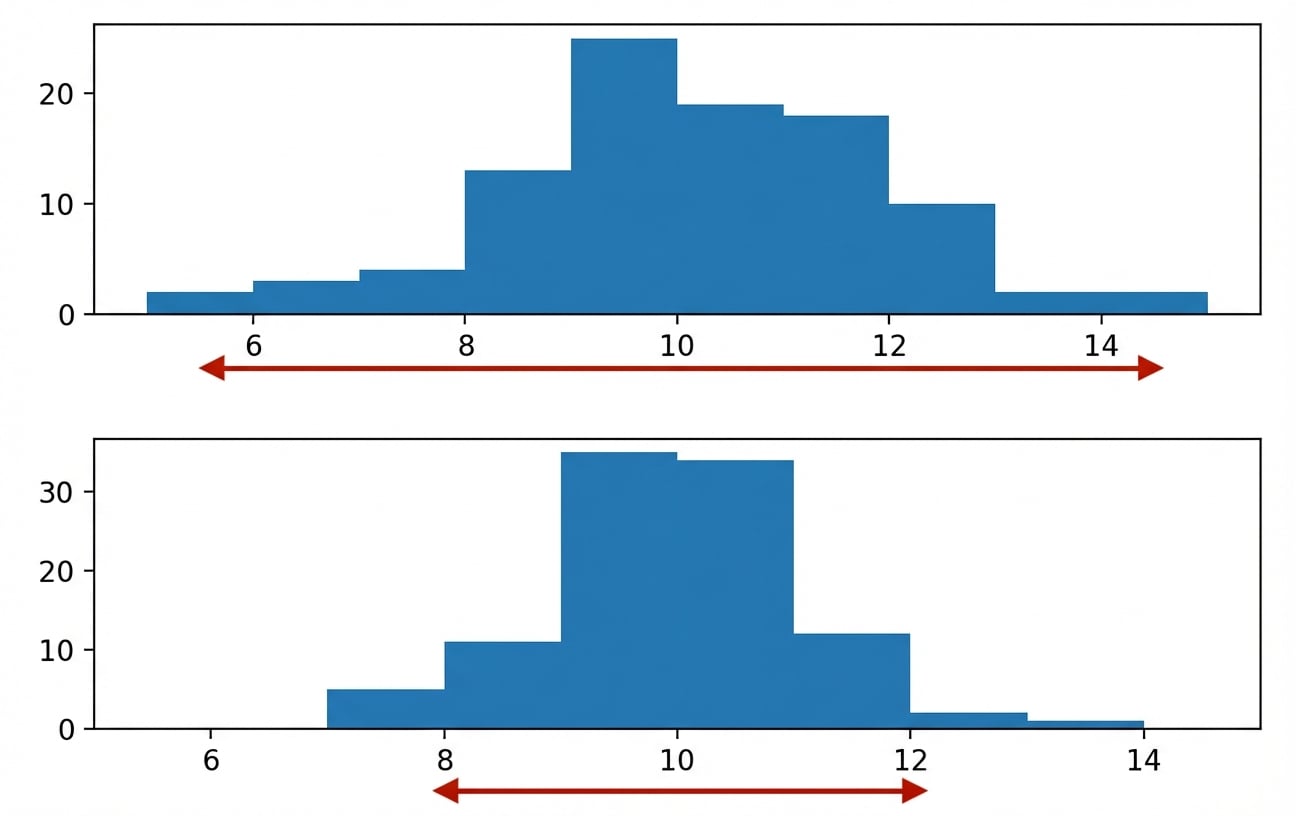
¿Qué es la difusión?
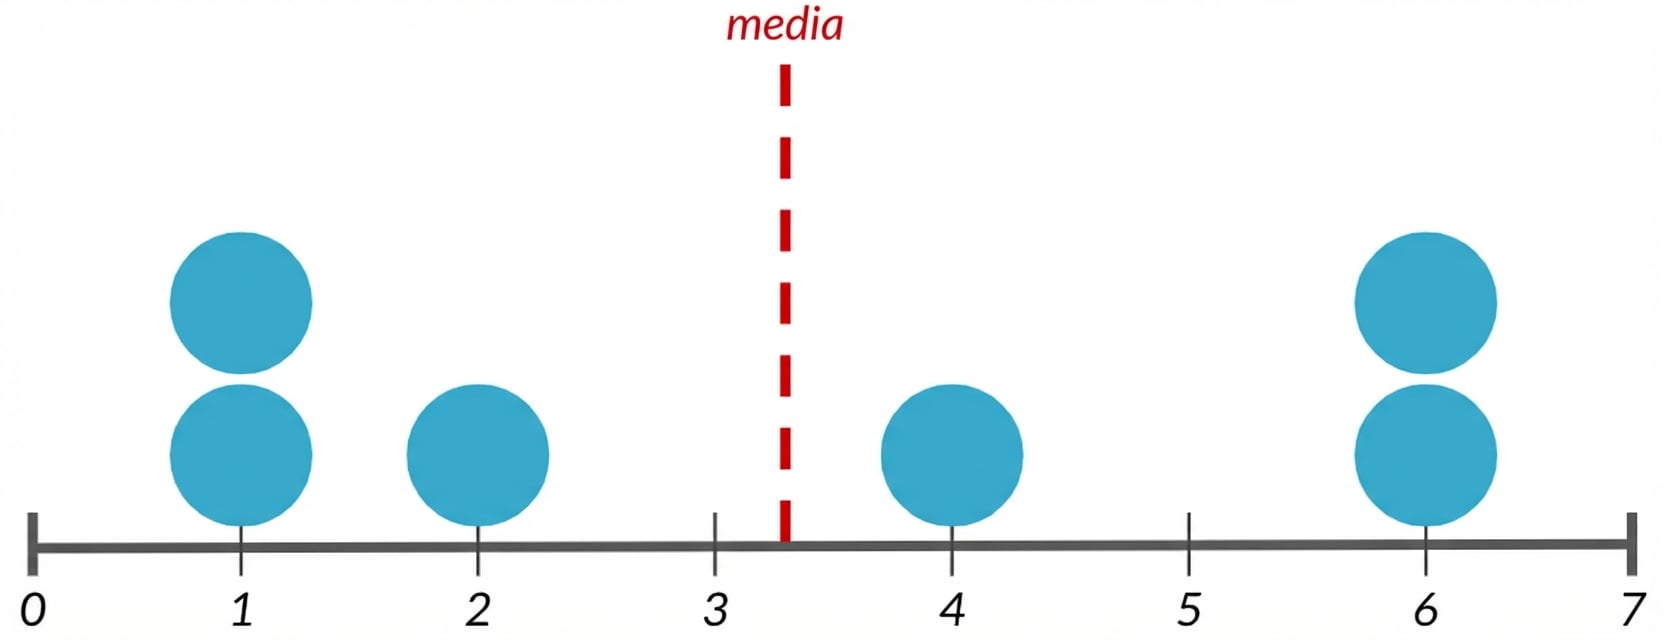
Varianza
Distancia promedio de cada punto de datos a la media de los datos
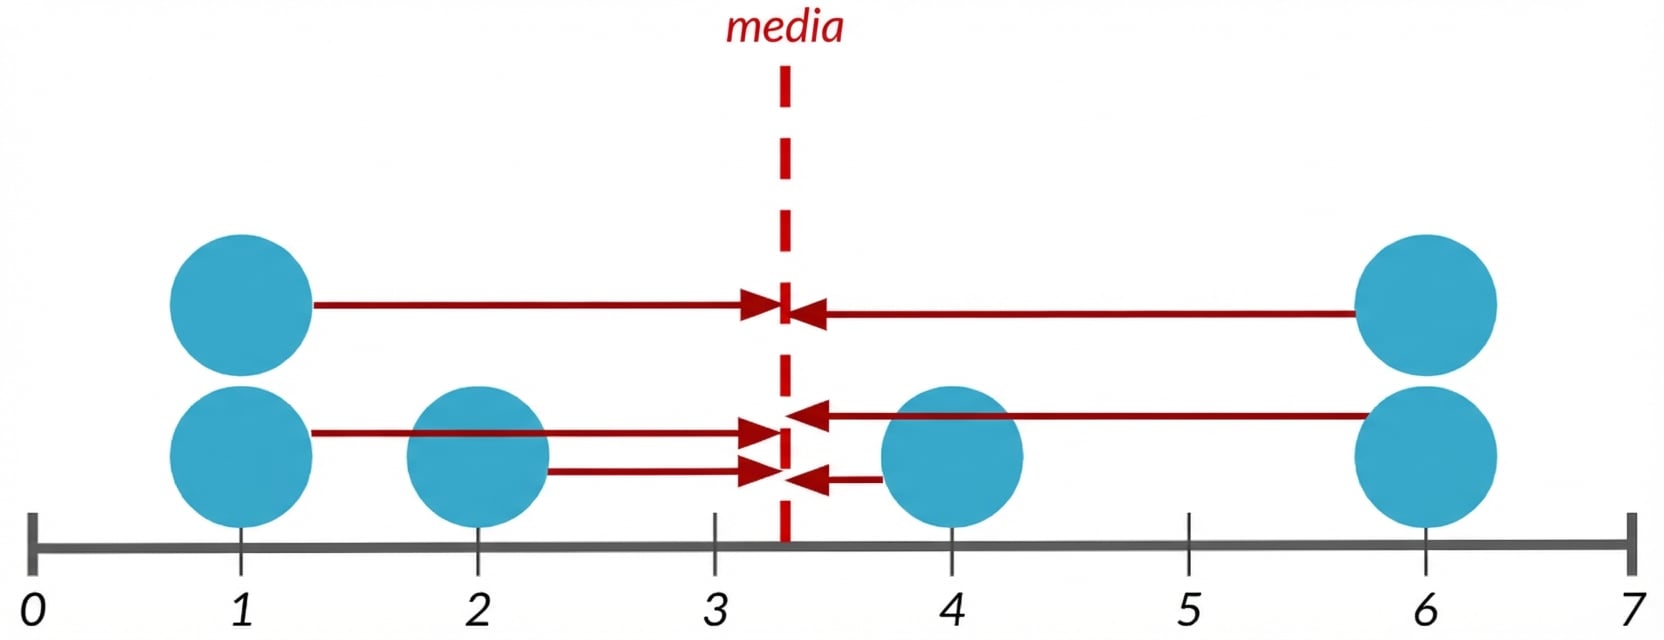
Varianza
Distancia promedio de cada punto de datos a la media de los datos
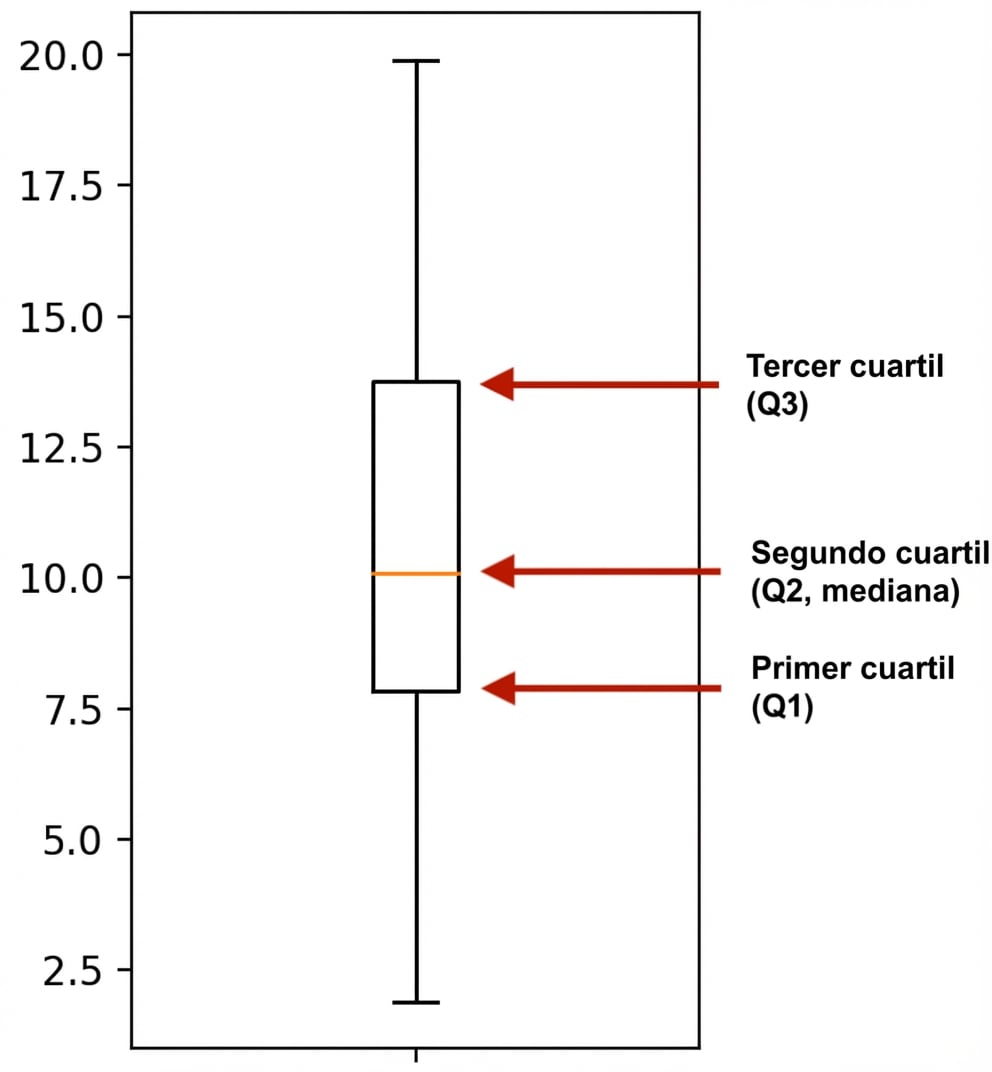
Los diagramas de caja utilizan cuartiles