Correlación
Introducción a la estadística en Python

Maggie Matsui
Content Developer, DataCamp
Relaciones entre dos variables
- x = variable independiente/explicativa
- y = variable dependiente/respuesta
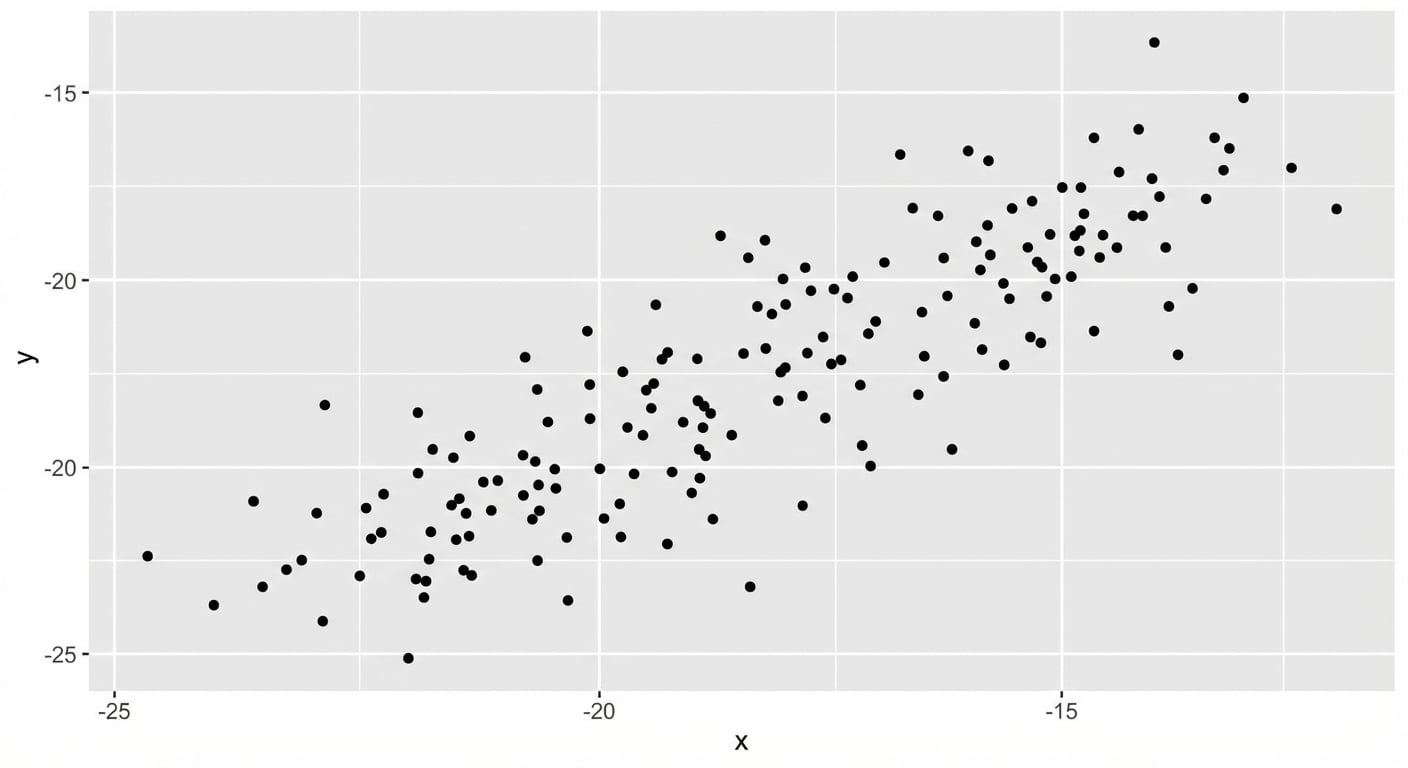
Magnitud = fuerza de la relación
0,99 (relación muy fuerte)
Magnitud = fuerza de la relación
0,99 (relación muy fuerte)
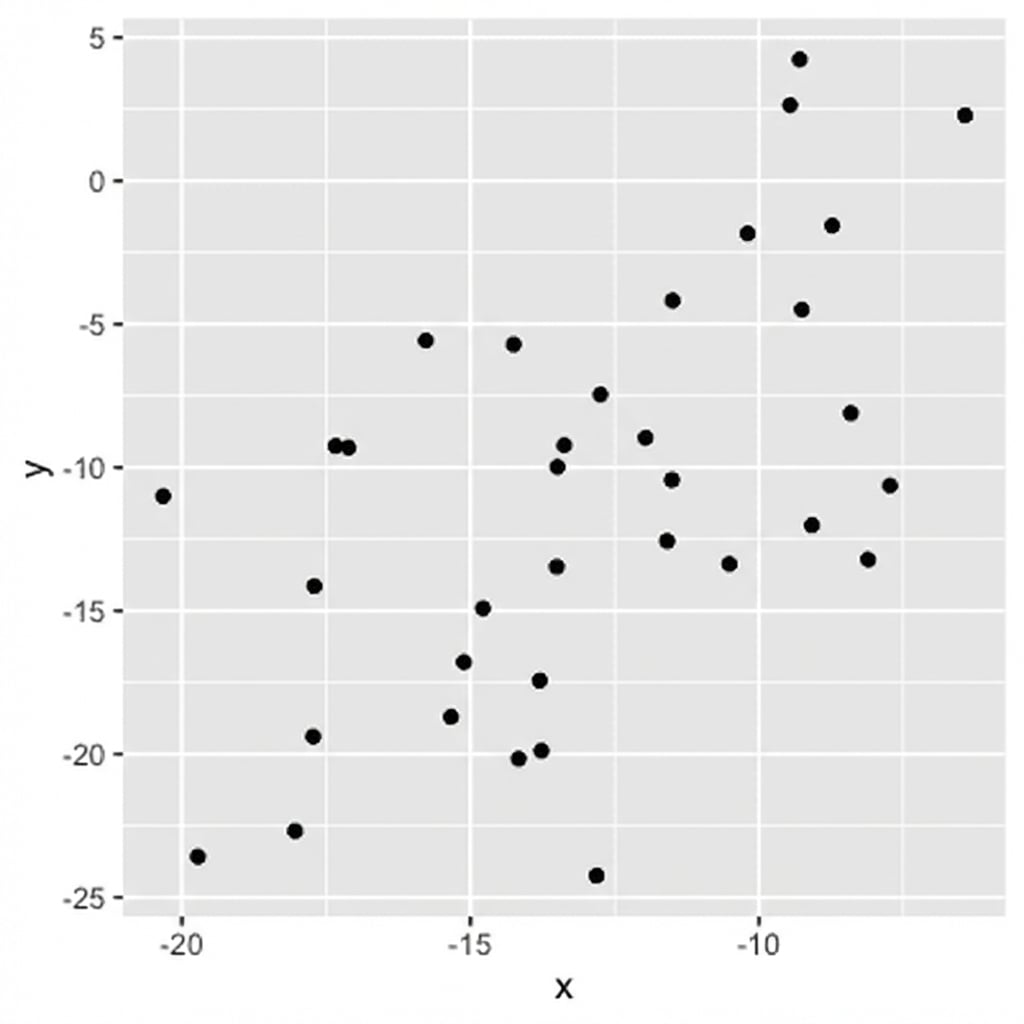
0,75 (relación fuerte)
Magnitud = fuerza de la relación
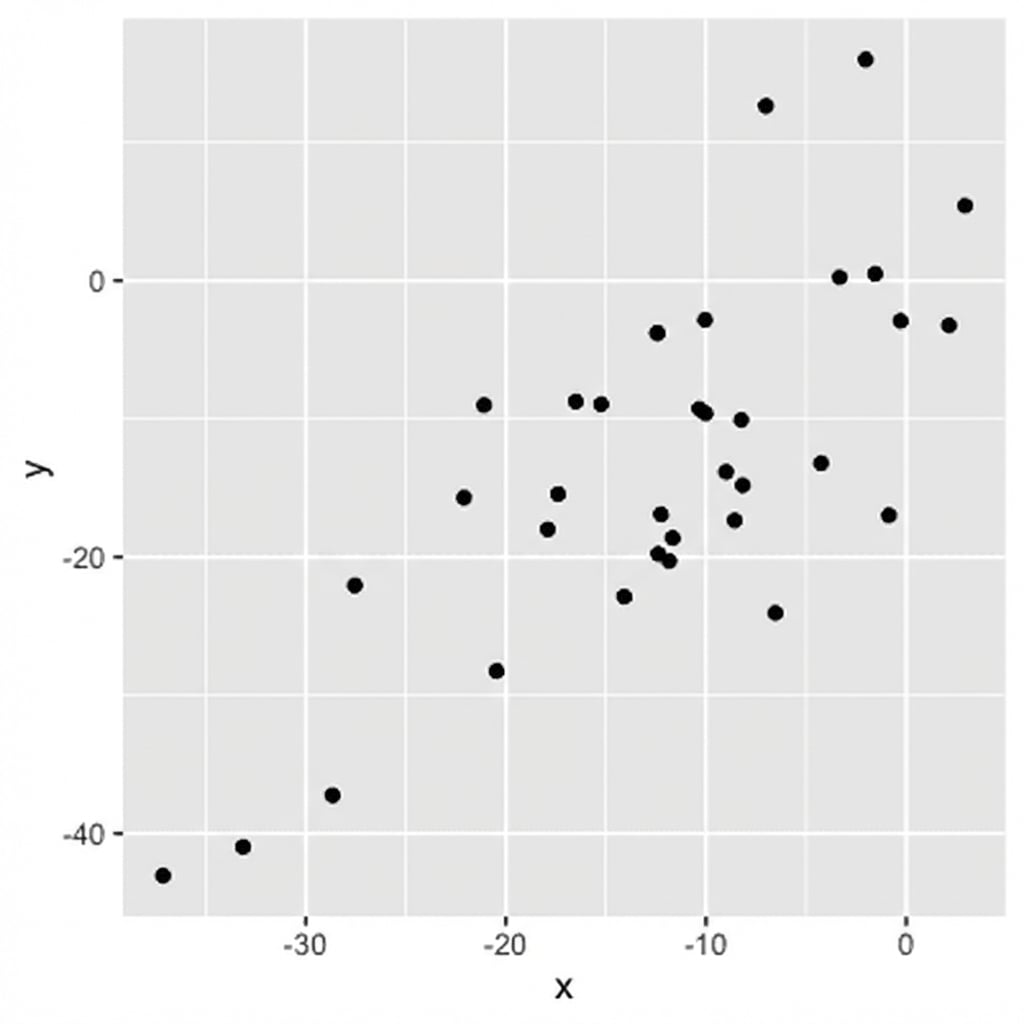
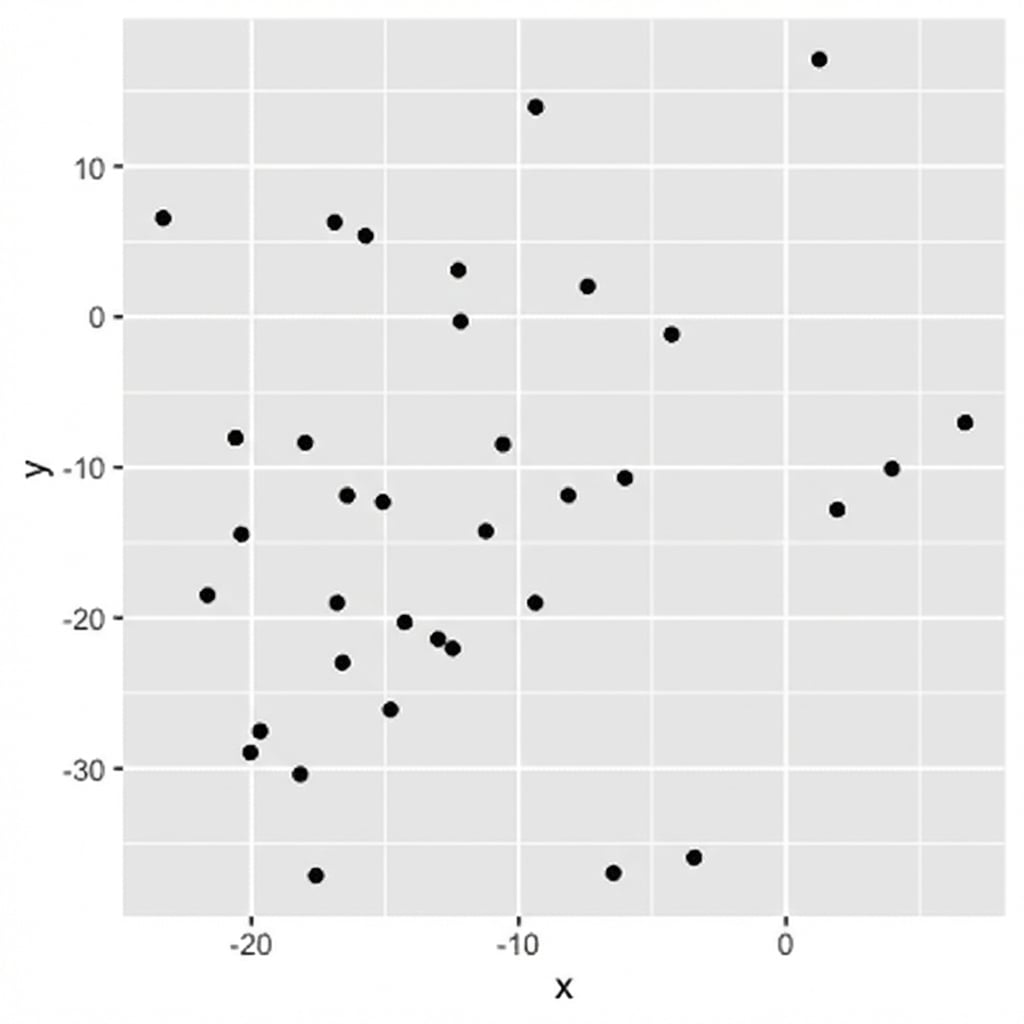
0,56 (relación moderada)
Magnitud = fuerza de la relación
0,56 (relación moderada)
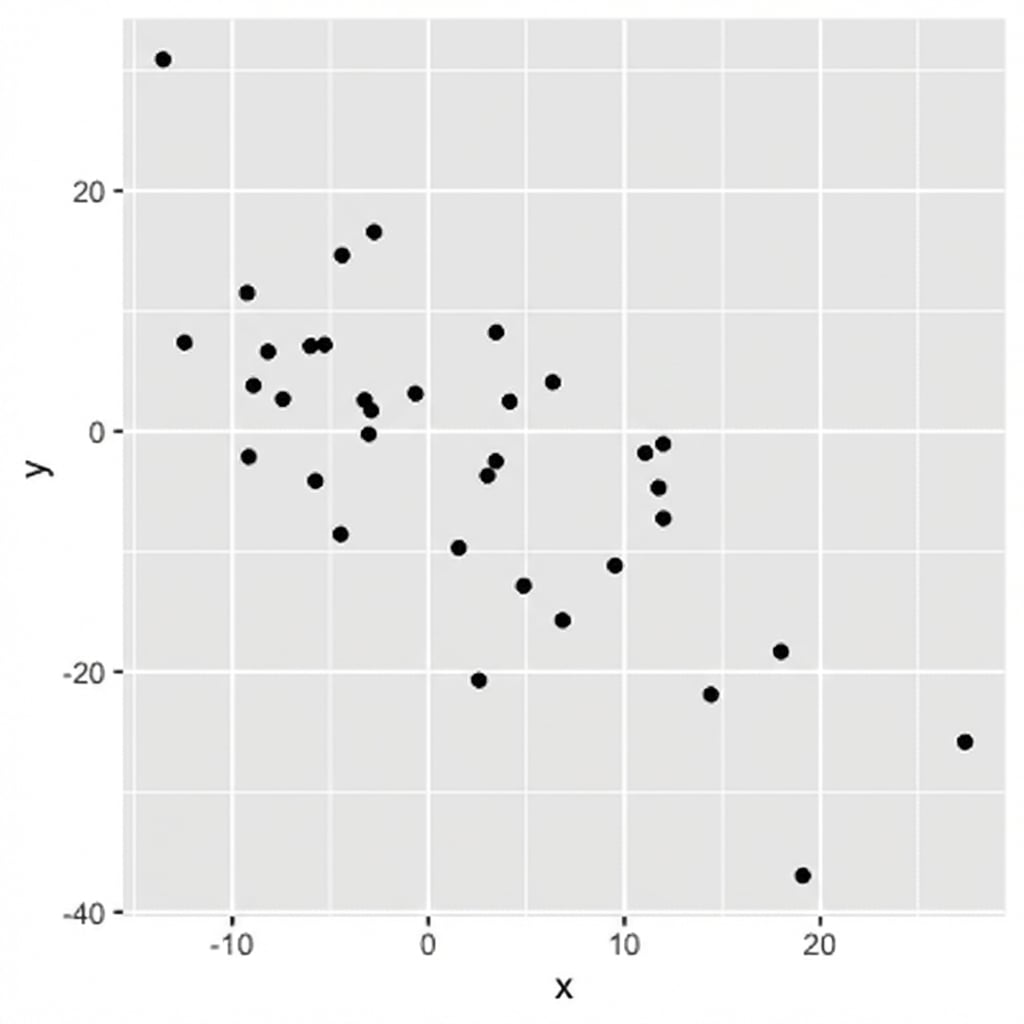
0,21 (relación débil)
Magnitud = fuerza de la relación
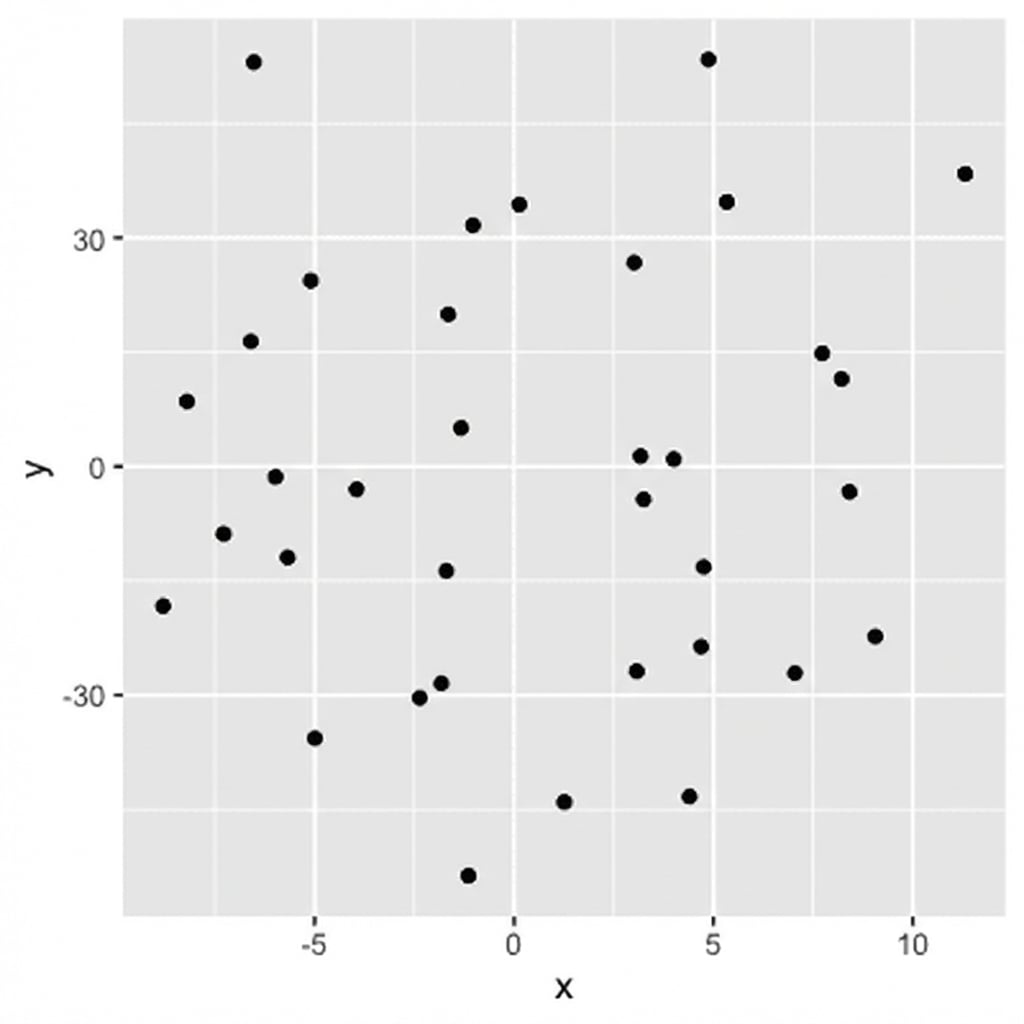
0,04 (sin relación)
Signo = dirección
0,75: cuando aumenta x, aumenta y
-0.75: cuando aumenta x, disminuye y
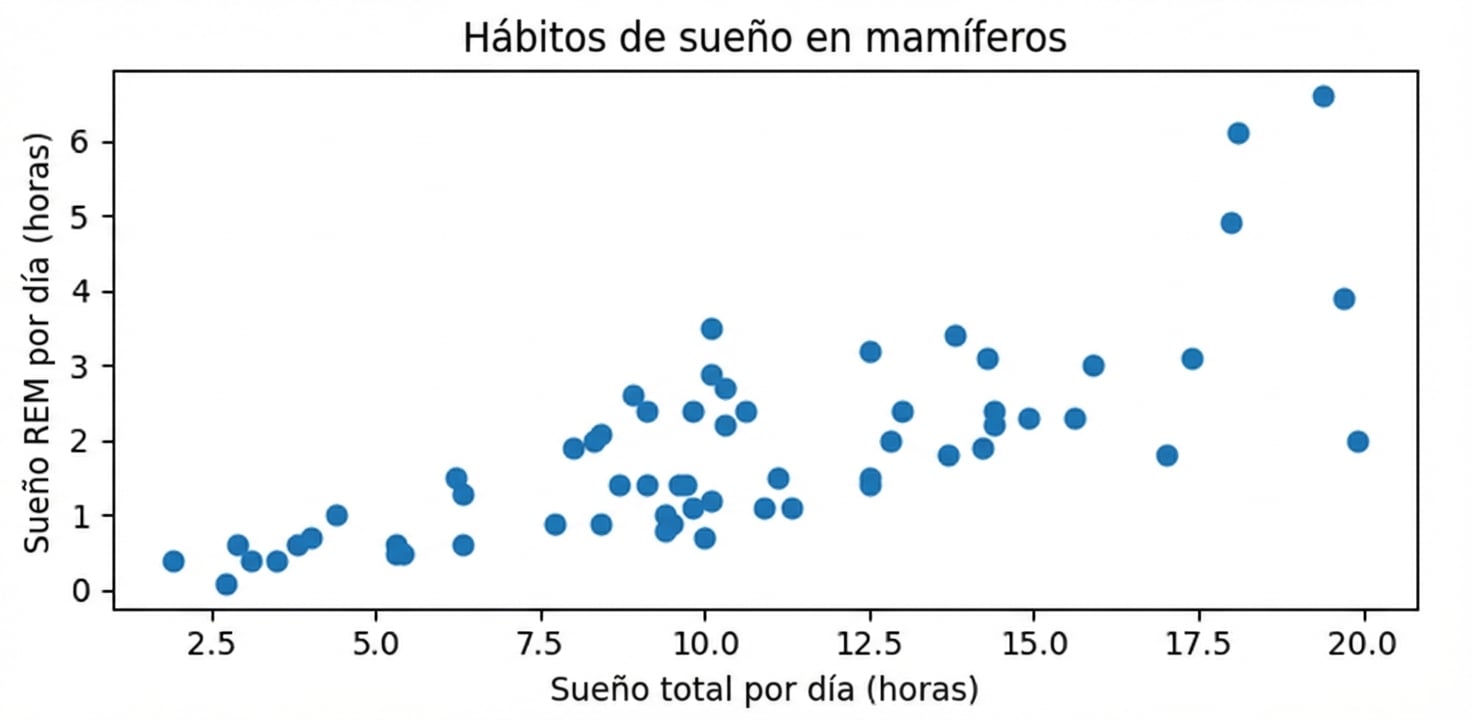
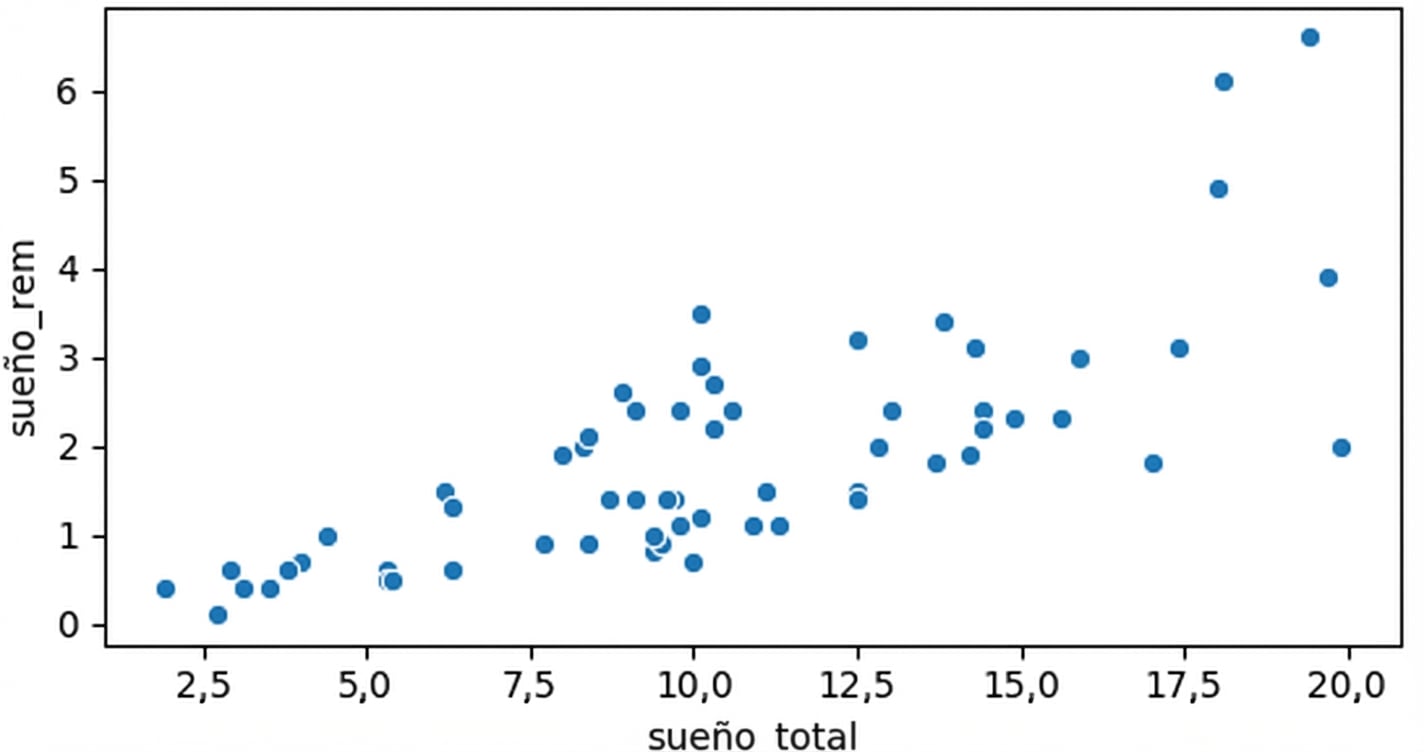
Visualizar las relaciones
import seaborn as snssns.scatterplot(x="sleep_total", y="sleep_rem", data=msleep)plt.show()
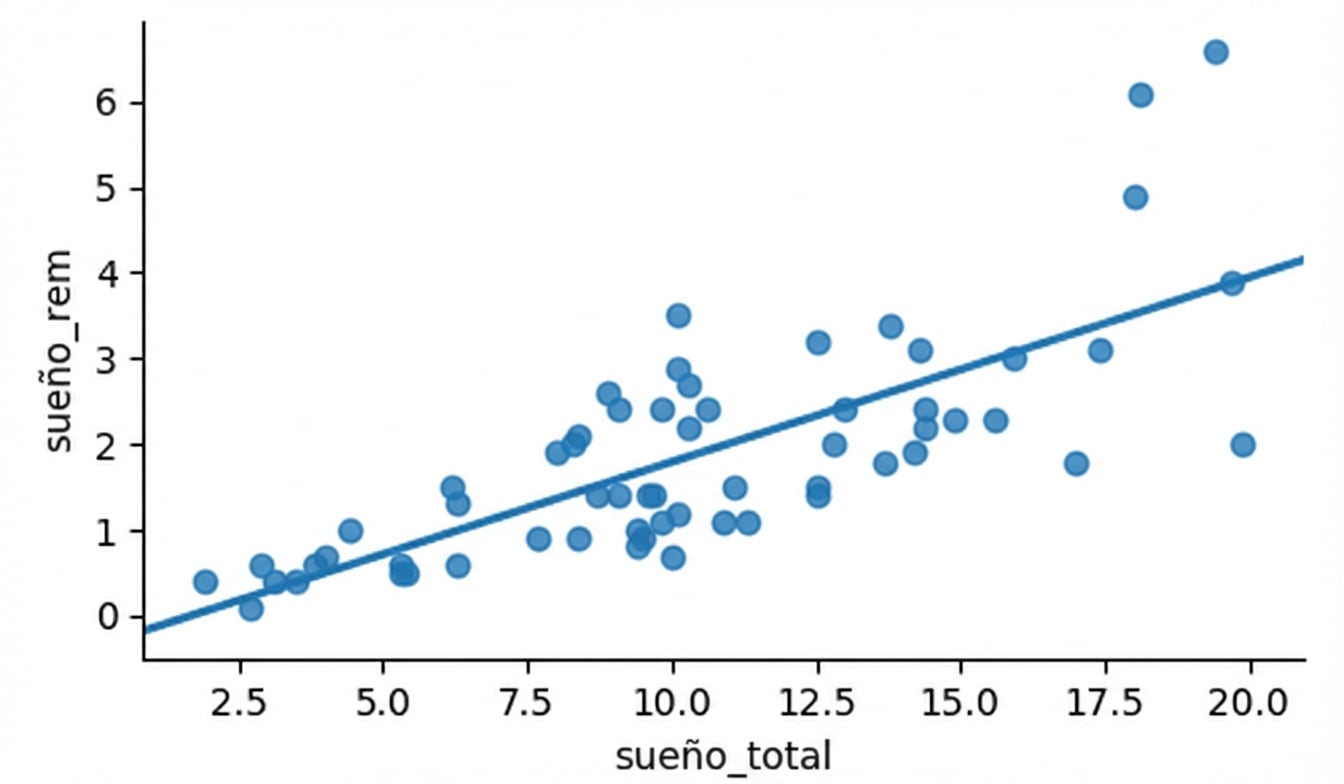
Añadir una línea de tendencia
import seaborn as sns sns.lmplot(x="sleep_total", y="sleep_rem", data=msleep, ci=None)plt.show()