Überlegungen zu kategorialen Daten
Explorative Datenanalyse in Python

George Boorman
Curriculum Manager, DataCamp
Was spricht für EDA?

1 Bildnachweis: https://unsplash.com/@simonesecci
Repräsentative Daten


1 Bildnachweis: https://unsplash.com/@cristina_glebova; https://unsplash.com/@nimbus_vulpis
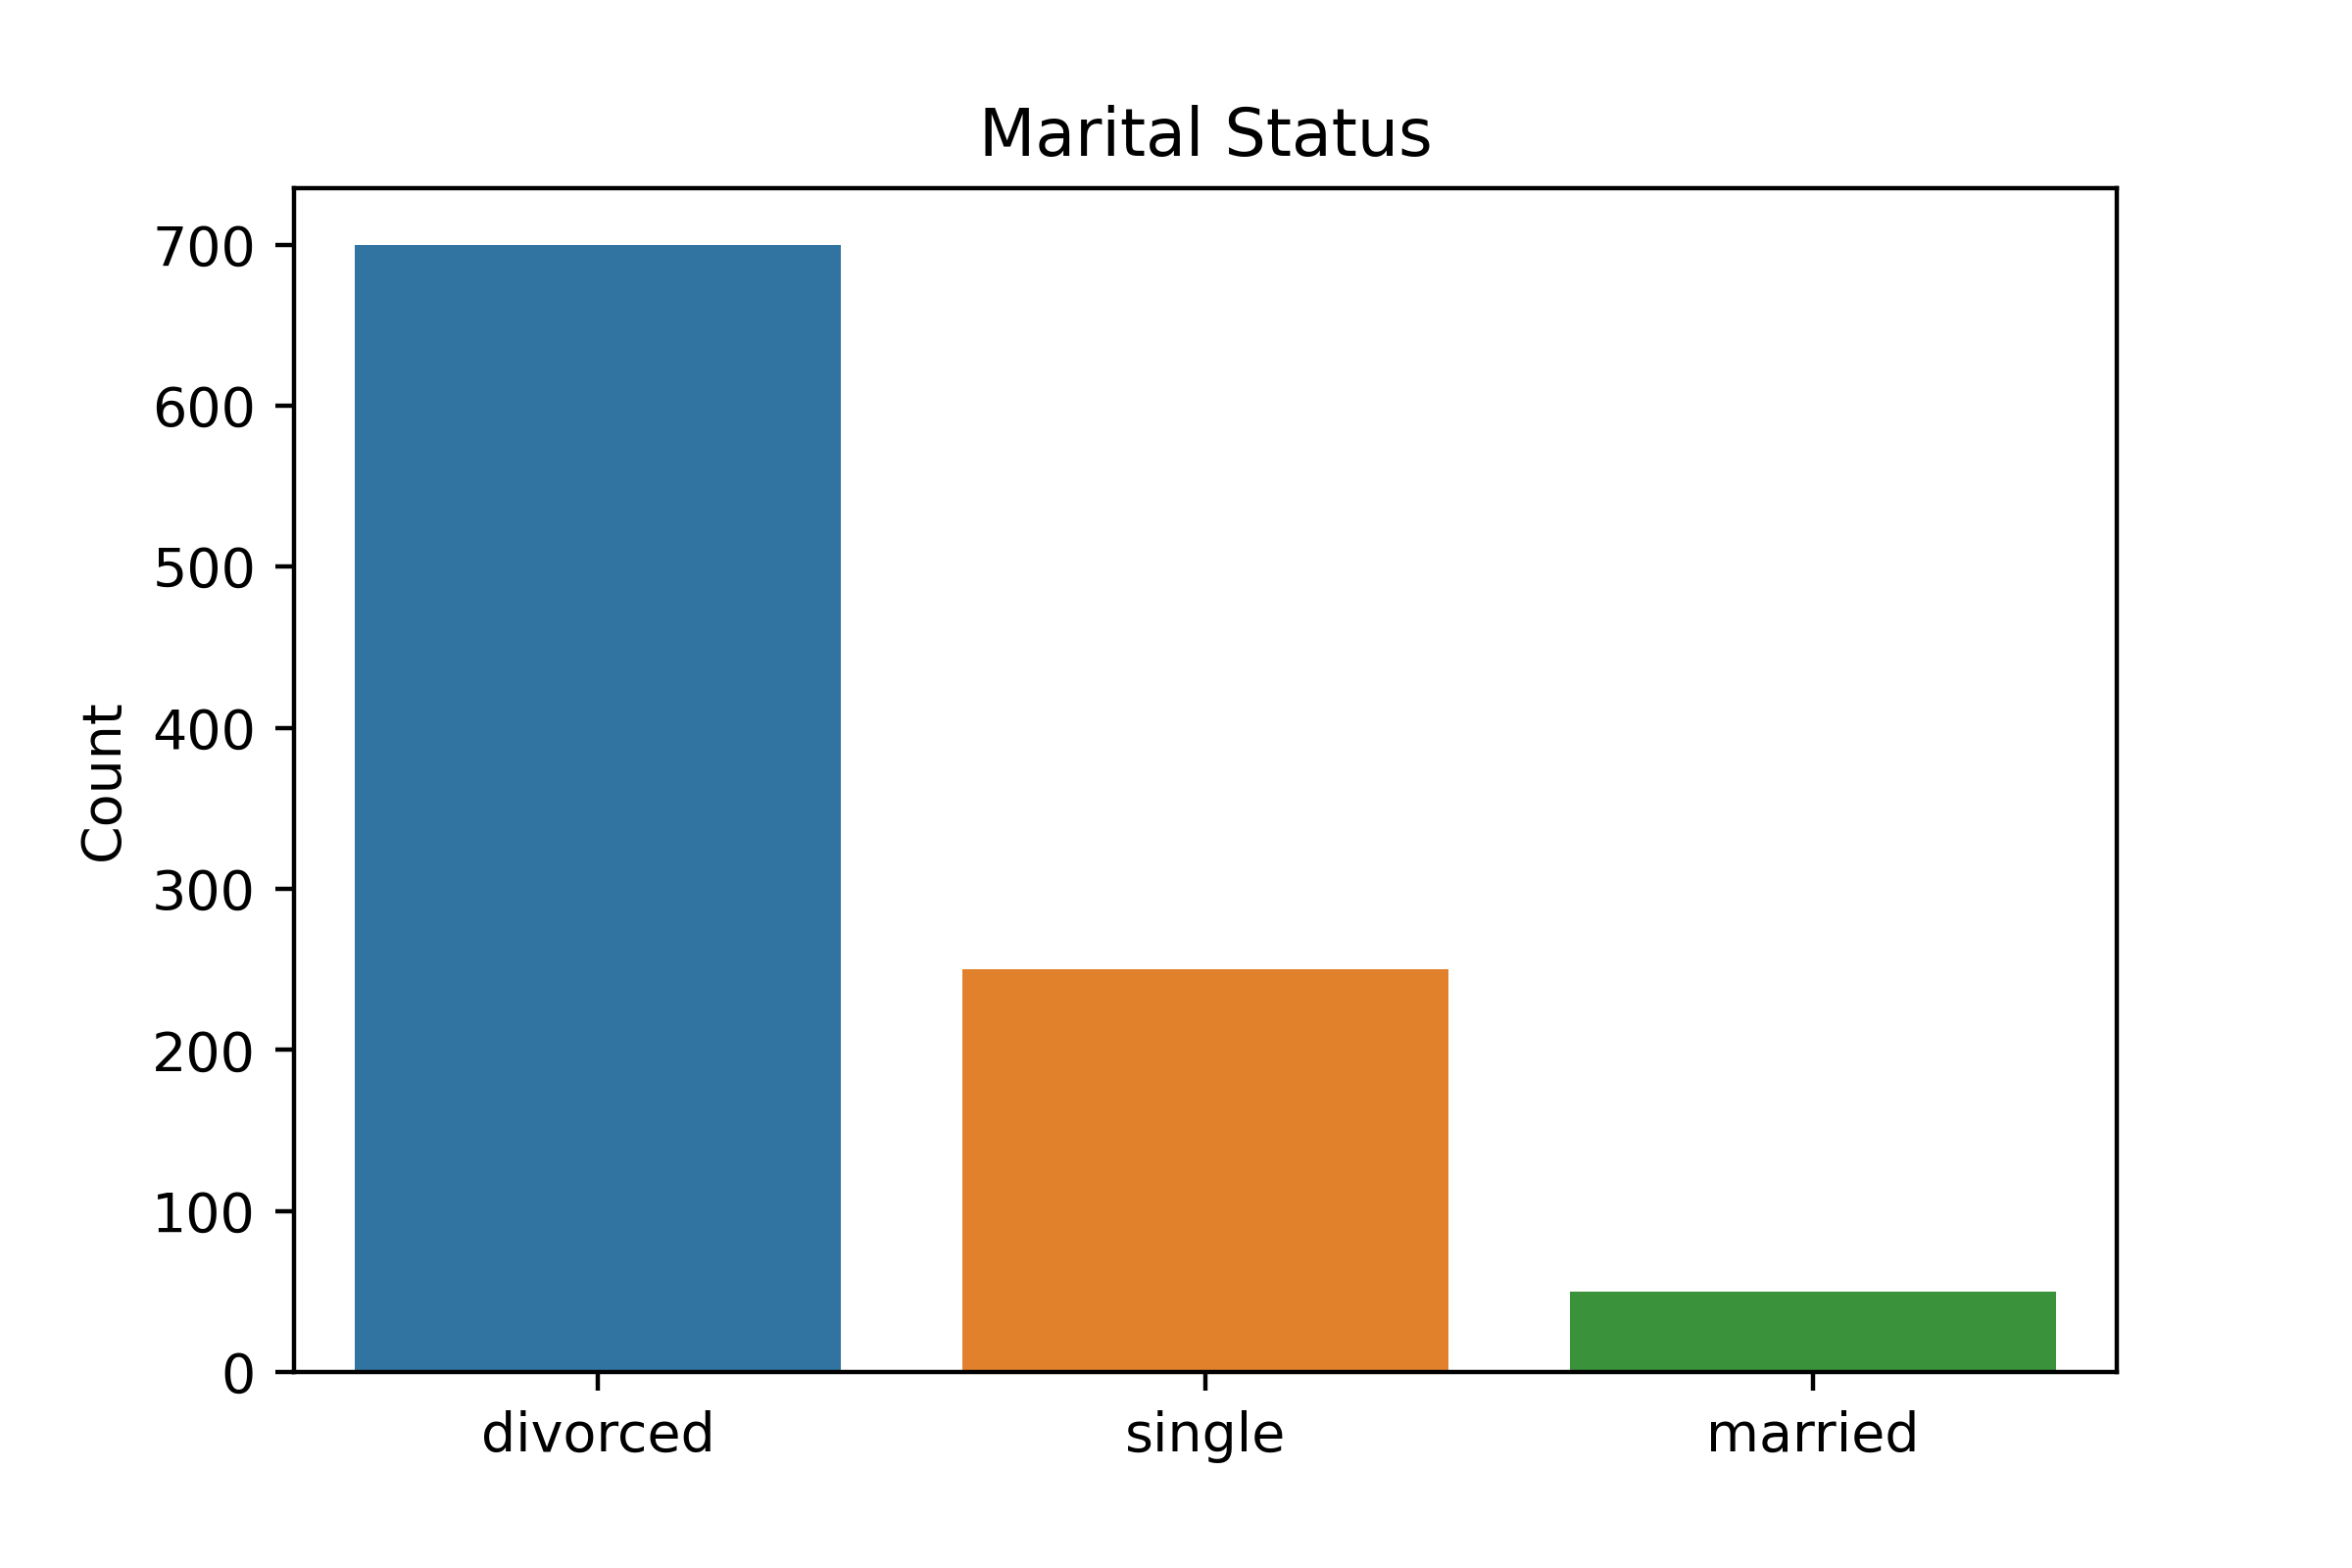
Klassenungleichgewicht
Kreuztabellen
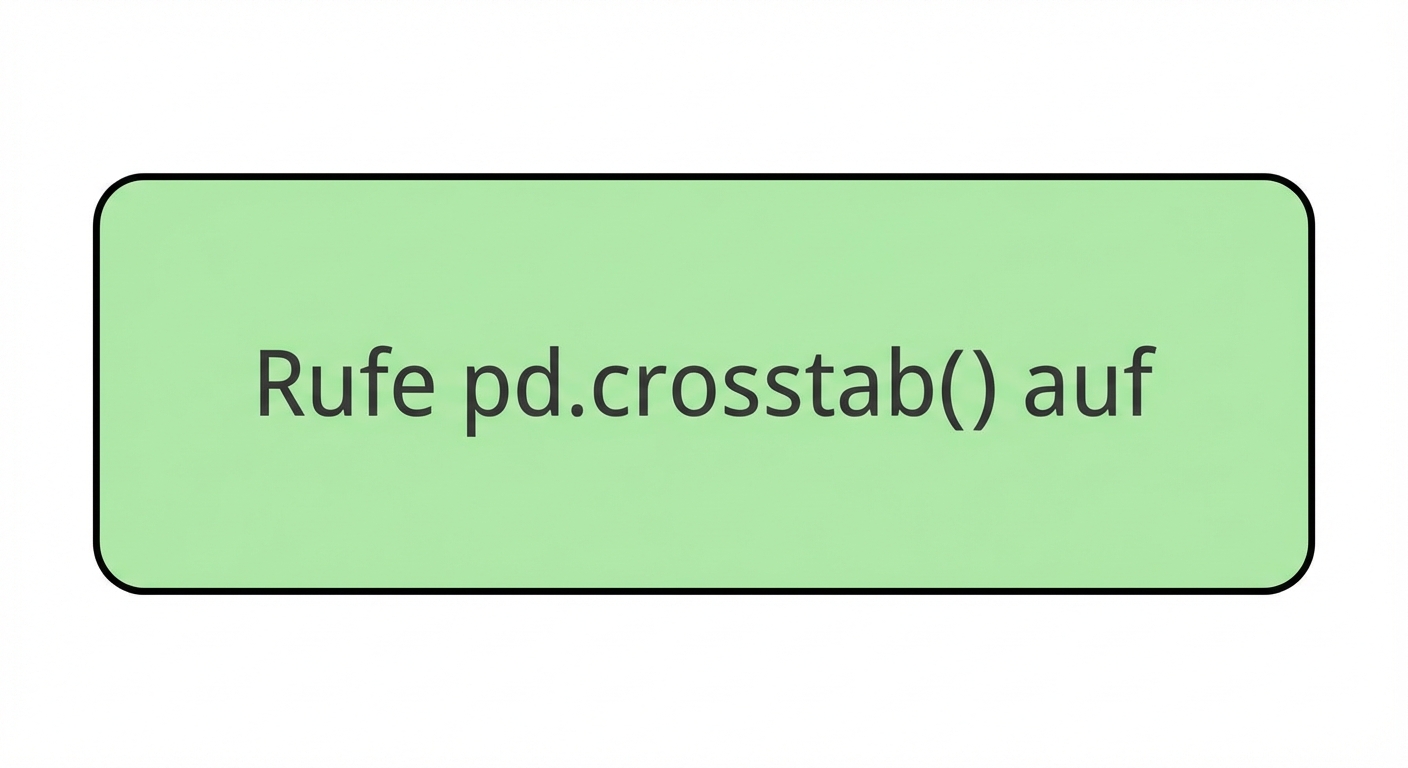
pd.crosstab(
Auswahl des Index
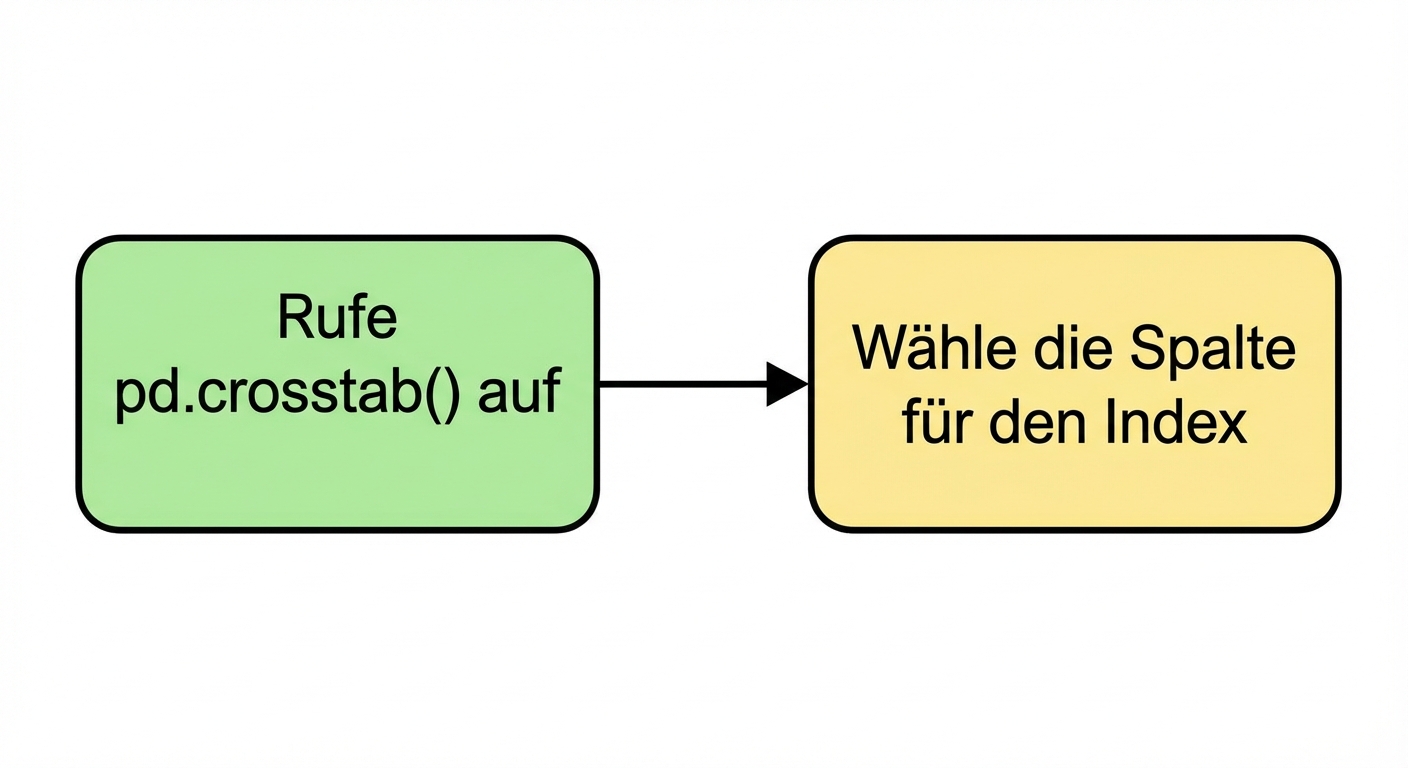
pd.crosstab(planes["Source"],
Auswahl der Spalten
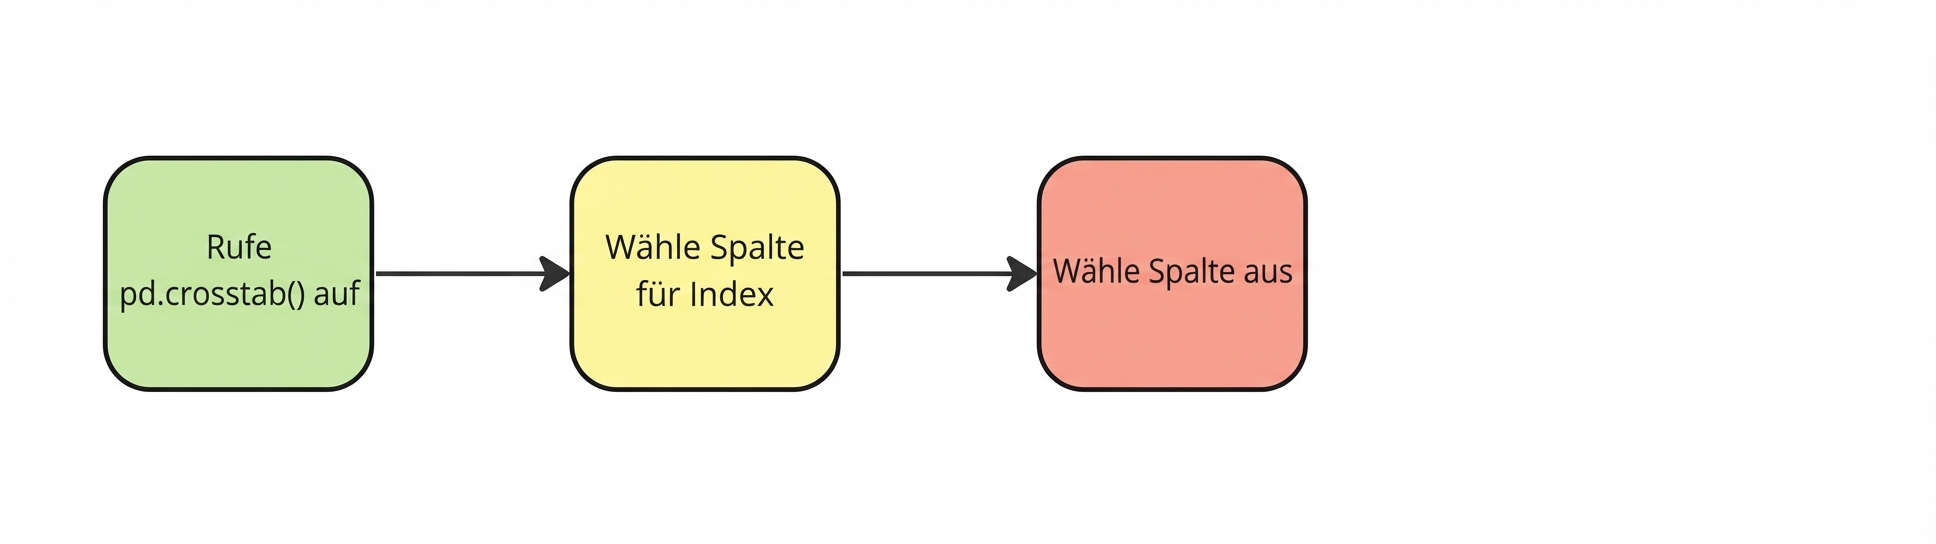
pd.crosstab(planes["Source"], planes["Destination"])

