Balkendiagramme
Einführung in die Datenvisualisierung mit ggplot2

Rick Scavetta
Founder, Scavetta Academy
Balkendiagramme mit einer kategorialen X-Achse
- Verwende geom_bar() oder geom_col()
| Geom | Stat | Aktion |
|---|---|---|
geom_bar() |
"count" | Zählt die Anzahl der Fälle an jeder x-Position |
geom_col() |
"identity" | Tatsächliche Werte darstellen |
- Alle Positionen von vorher sind verfügbar
- Zwei Arten
- Absolute Anzahl
- Verteilungen
Balkendiagramme mit einer kategorialen X-Achse
- Verwende geom_bar() oder geom_col()
| Geom | Stat | Aktion |
|---|---|---|
geom_bar() |
"count" | Zählt die Anzahl der Fälle an jeder x-Position |
geom_col() |
"identity" | Tatsächliche Werte darstellen |
Balkendiagramme mit einer kategorialen X-Achse
- Verwende geom_bar() oder geom_col()
| Geom | Stat | Aktion |
|---|---|---|
geom_bar() |
"count" | Zählt die Anzahl der Fälle an jeder x-Position |
geom_col() |
"identity" | Tatsächliche Werte darstellen |
- Alle Positionen von vorher sind verfügbar
- Zwei Arten
- Absolute Anzahl
- Verteilungen
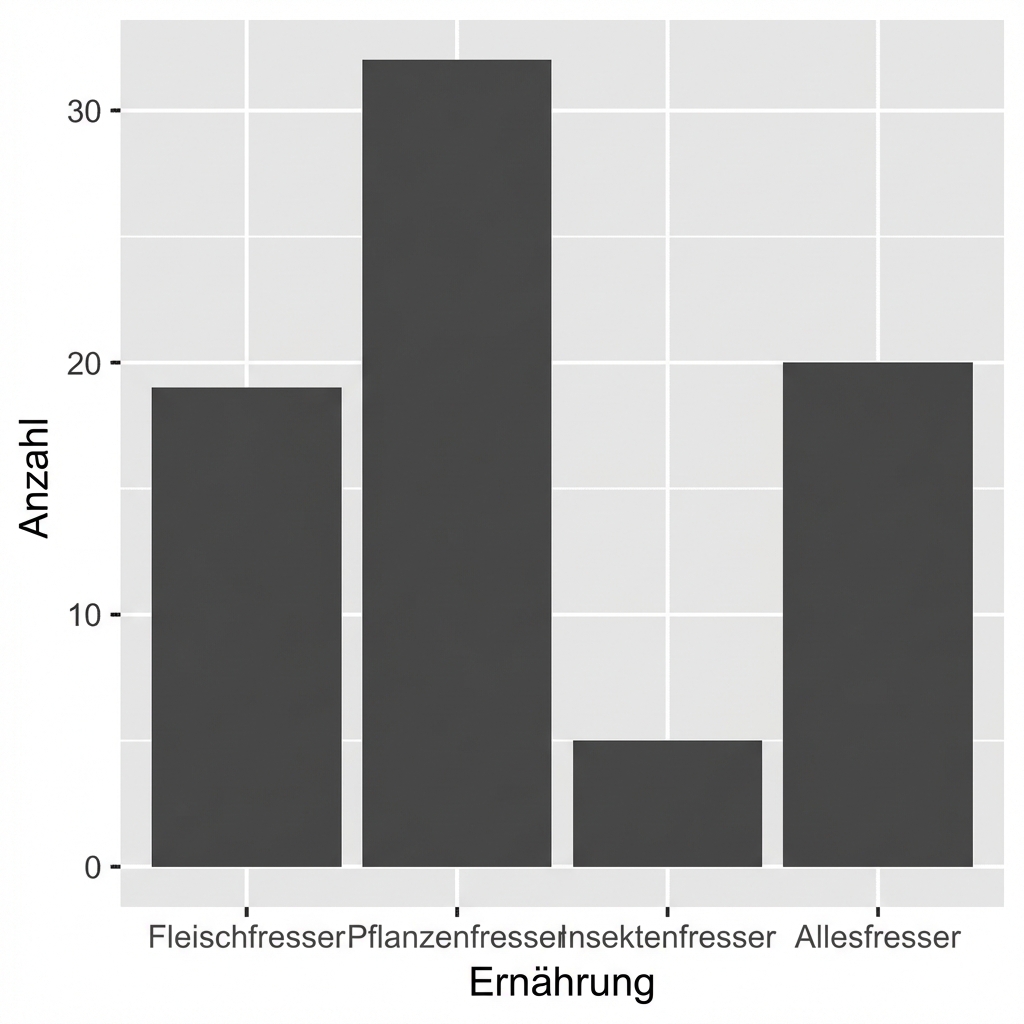
Gewohnheiten von Säugetieren
str(sleep)
'data.frame':    76 obs. of  3 variables:
 $ vore : Factor w/ 4 levels "carni","herbi",..: 1 4 2 4 2 2 1 1 2 2 ...
 $ total: num  12.1 17 14.4 14.9 4 14.4 8.7 10.1 3 5.3 ...
 $ rem  : num  NA 1.8 2.4 2.3 0.7 2.2 1.4 2.9 NA 0.6 ...
Balkendiagramm
ggplot(sleep, aes(vore)) +
  geom_bar()

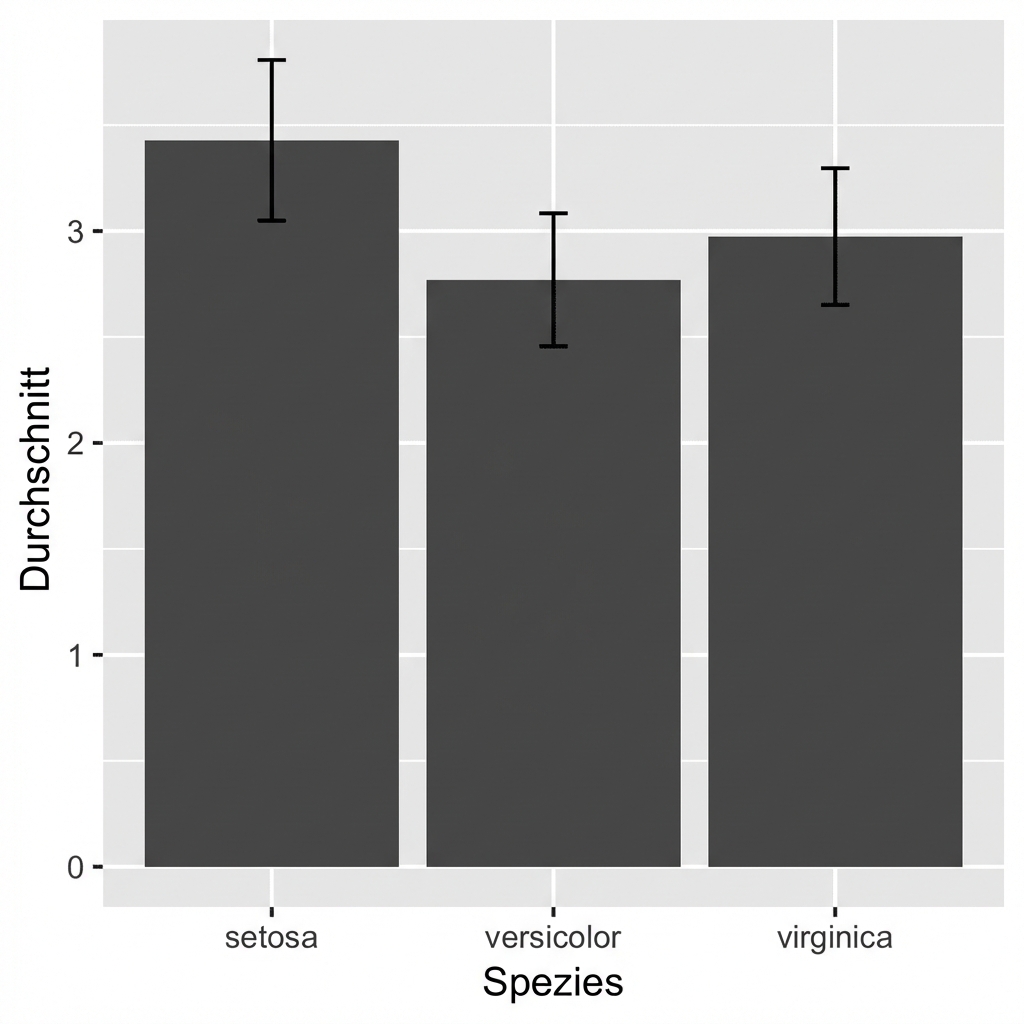
Plotten von Verteilungen statt absoluter Zahlen
# Calculate Descriptive Statistics:
iris %>%
  select(Species, Sepal.Width) %>%
  pivot_longer(!Species, names_to = "key",
  values_to = "value") %>%
  group_by(Species) %>%
  summarise(avg = mean(value),
            stdev = sd(value))
   -> iris_summ_long
iris_summ_long
| Species | avg | stdev |
|---|---|---|
| setosa | 3.43 | 0,38 |
| versicolor | 2.77 | 0.31 |
| virginica | 2.97 | 0.32 |
Verteilungen grafisch darstellen
ggplot(iris_summ_long, aes(x = Species,
                           y = avg)) +
  geom_col() +
  geom_errorbar(aes(ymin = avg - stdev,
                    ymax = avg + stdev),
                width = 0.1)

Lass uns üben!
Einführung in die Datenvisualisierung mit ggplot2

