Attribute verwenden
Einführung in die Datenvisualisierung mit ggplot2

Rick Scavetta
Founder, Scavetta Academy
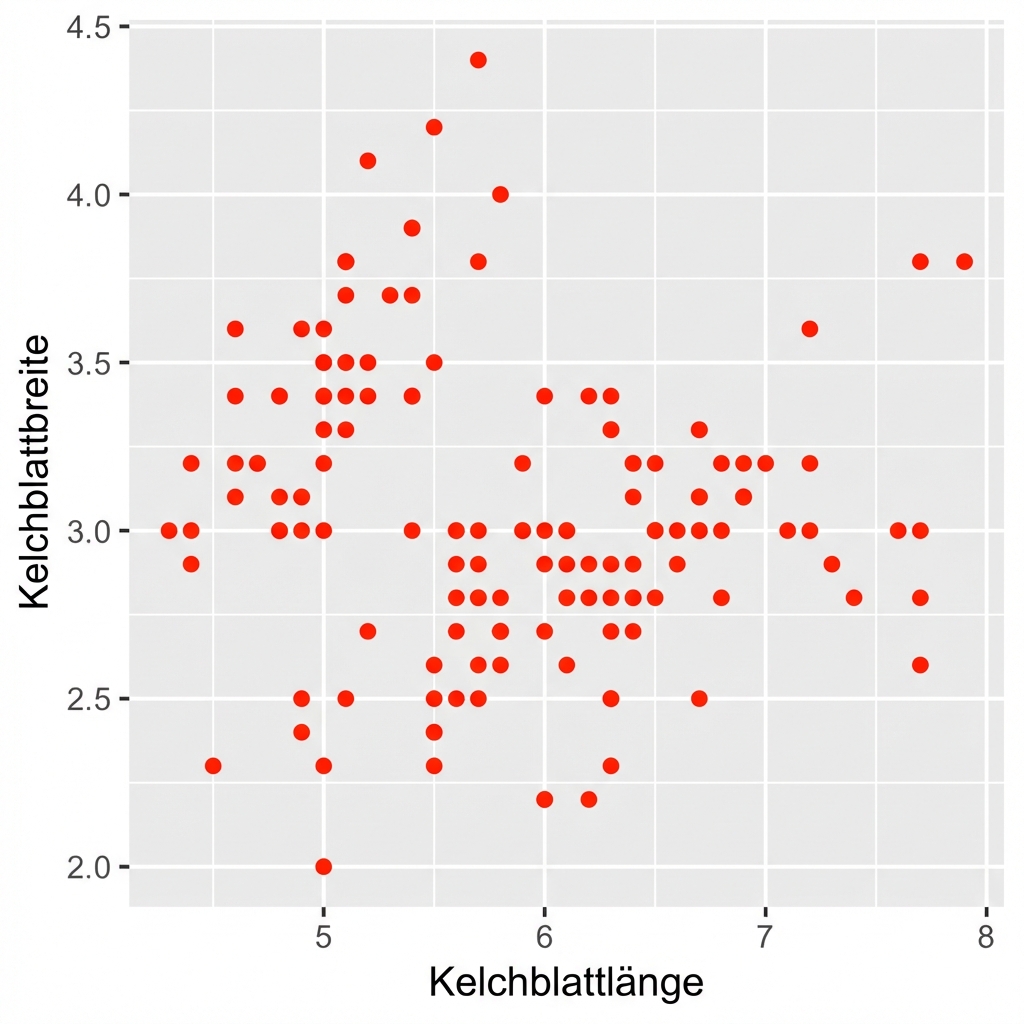
Ästhetische Elemente? Attribute
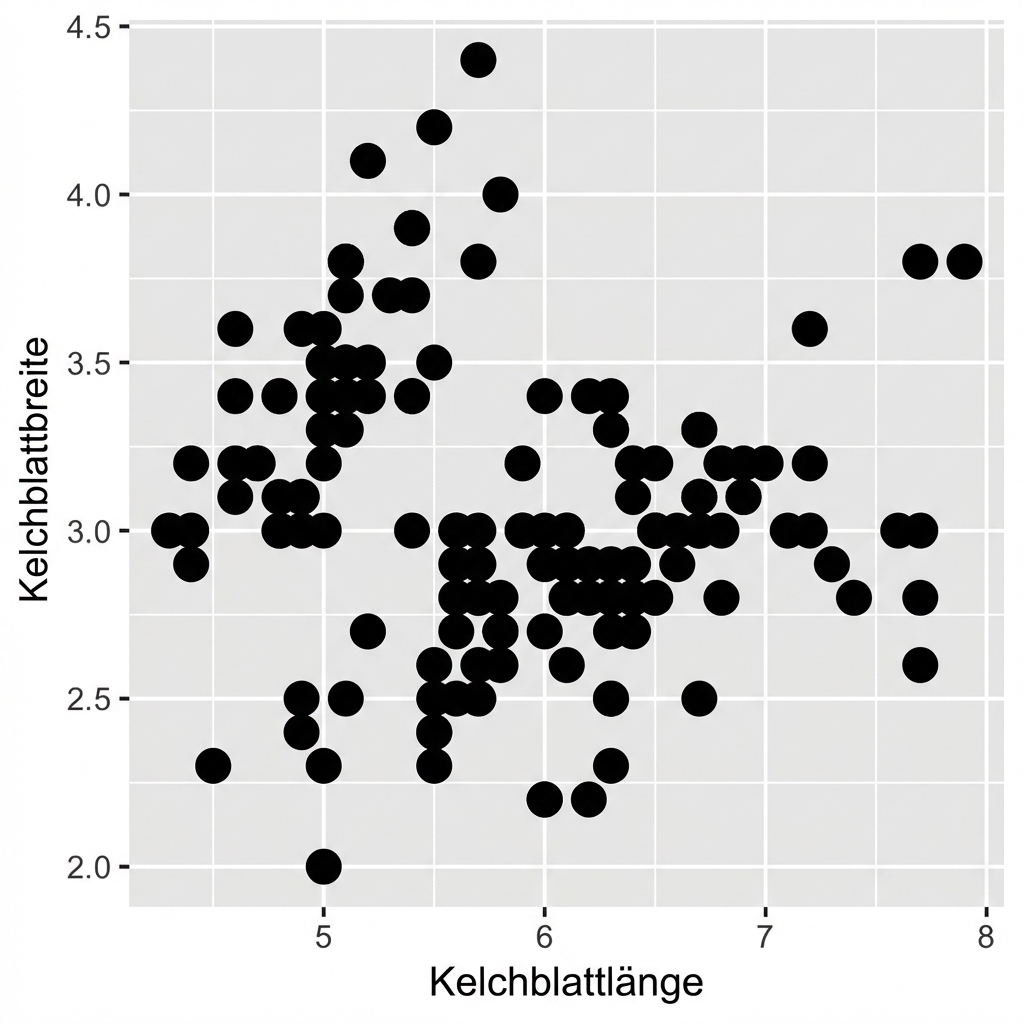
Ästhetische Elemente? Attribute
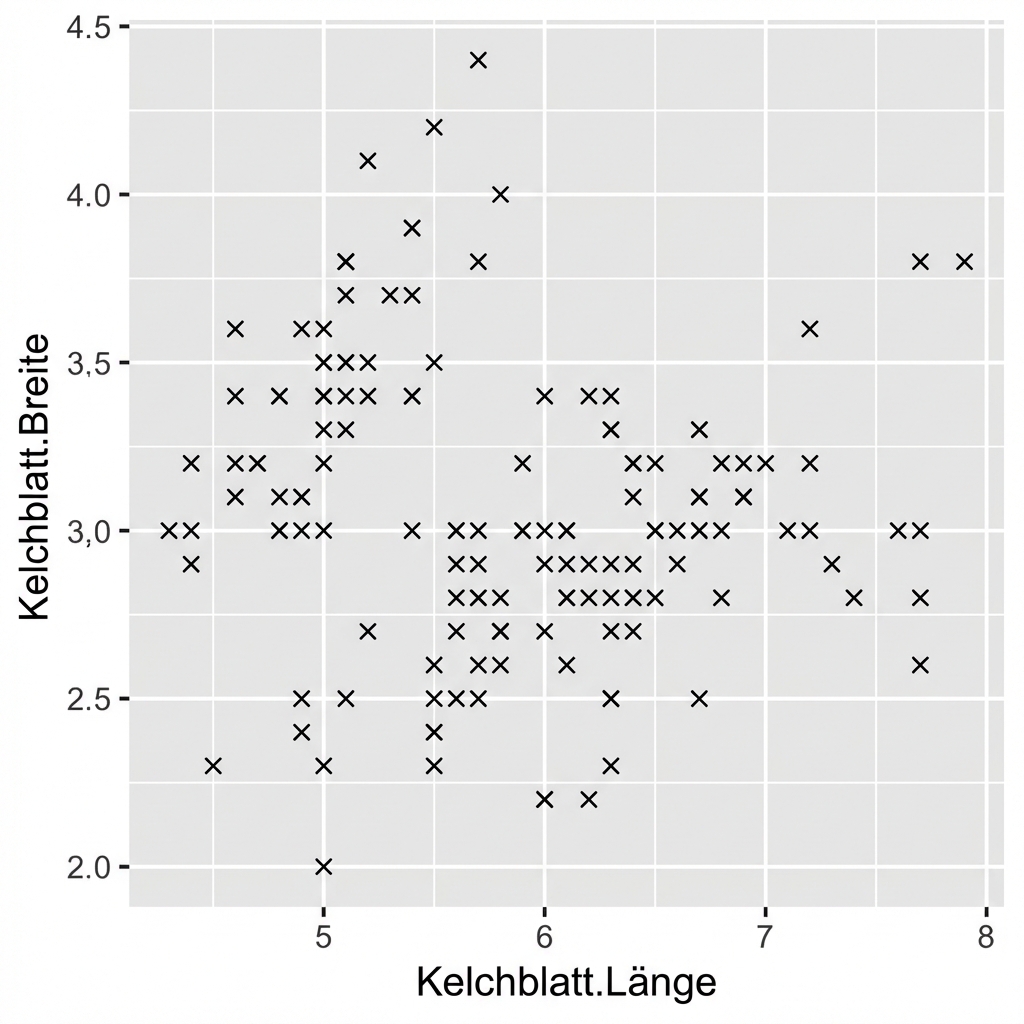
Ästhetische Elemente? Attribute
Einführung in die Datenvisualisierung mit ggplot2
Rick Scavetta
Founder, Scavetta Academy

