Sichtbare ästhetische Elemente
Einführung in die Datenvisualisierung mit ggplot2

Rick Scavetta
Founder, Scavetta Academy
Abbildung auf die X- und Y-Achse
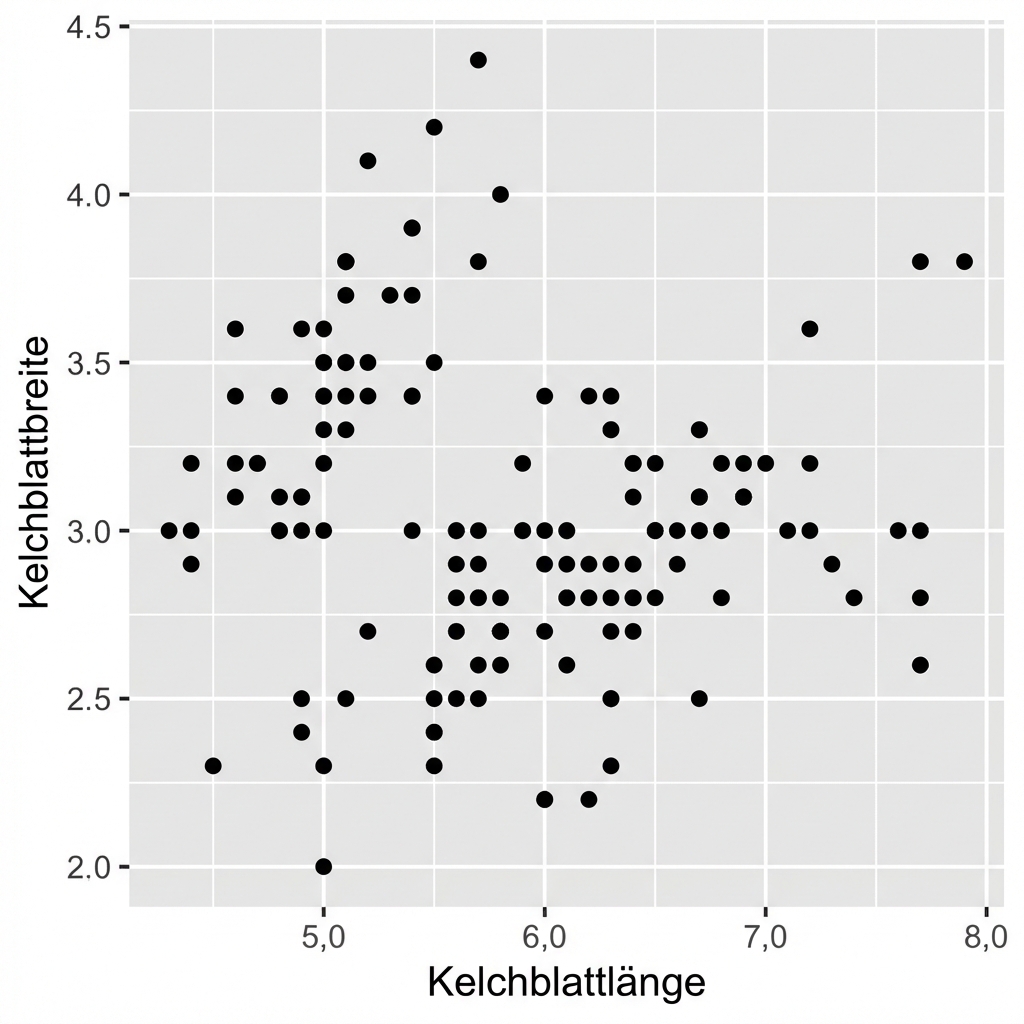
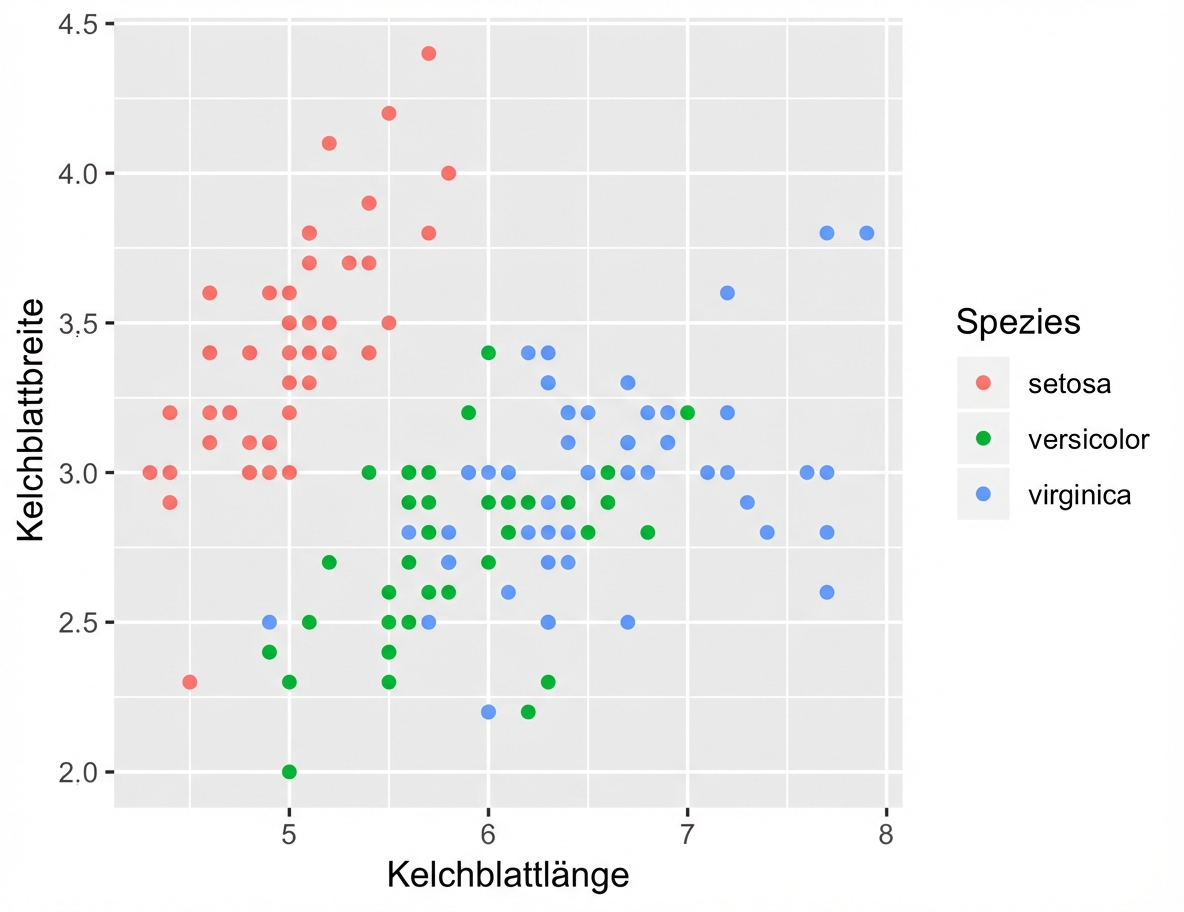
Abbildung auf Farbe

Abbildung auf das ästhetische Element Farbe (color)
Abbildung auf das ästhetische Element Farbe (color)
Abbildung auf das ästhetische Element Farbe (color) in Geom