Einführung
Einführung in die Datenvisualisierung mit ggplot2

Rick Scavetta
Founder, Scavetta Academy
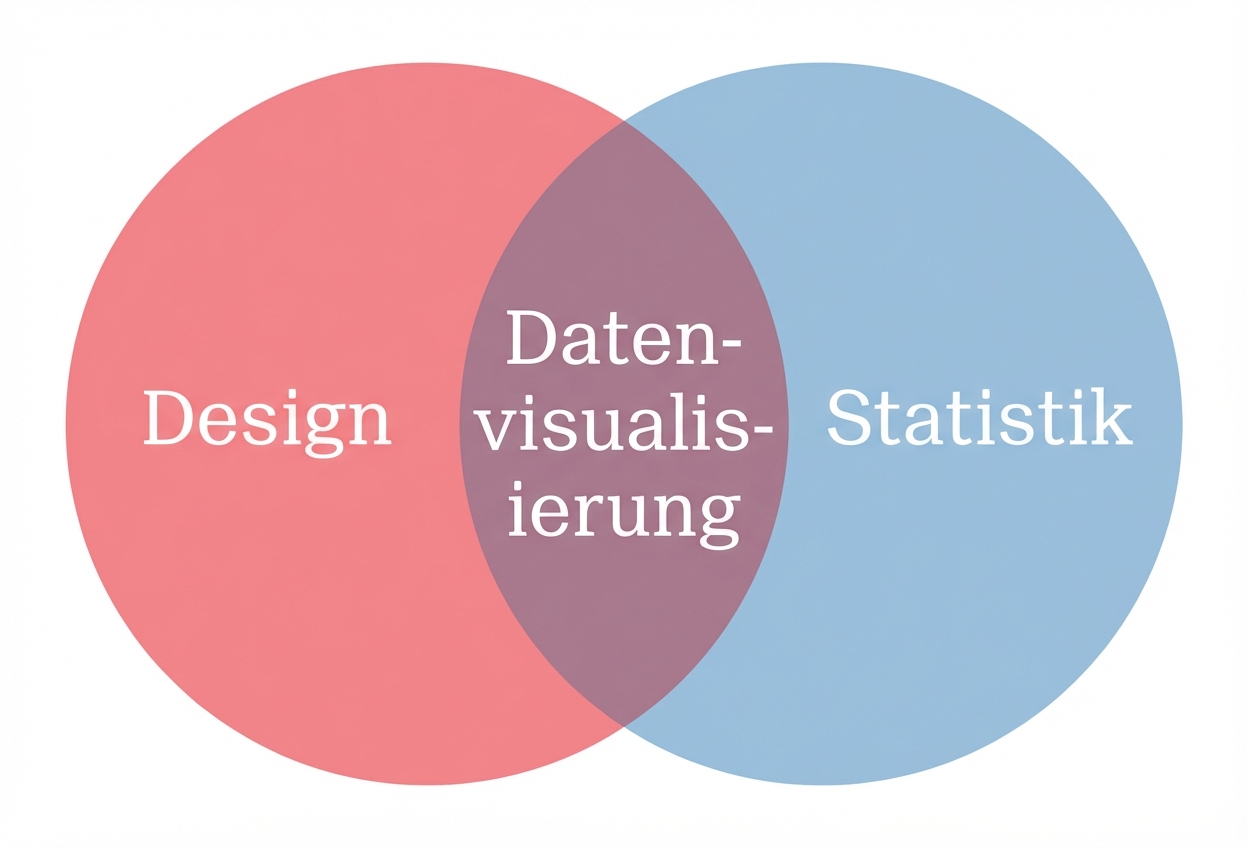
Datenvisualisierung & Datenwissenschaft
- Eine Kernkompetenz in der Datenwissenschaft.
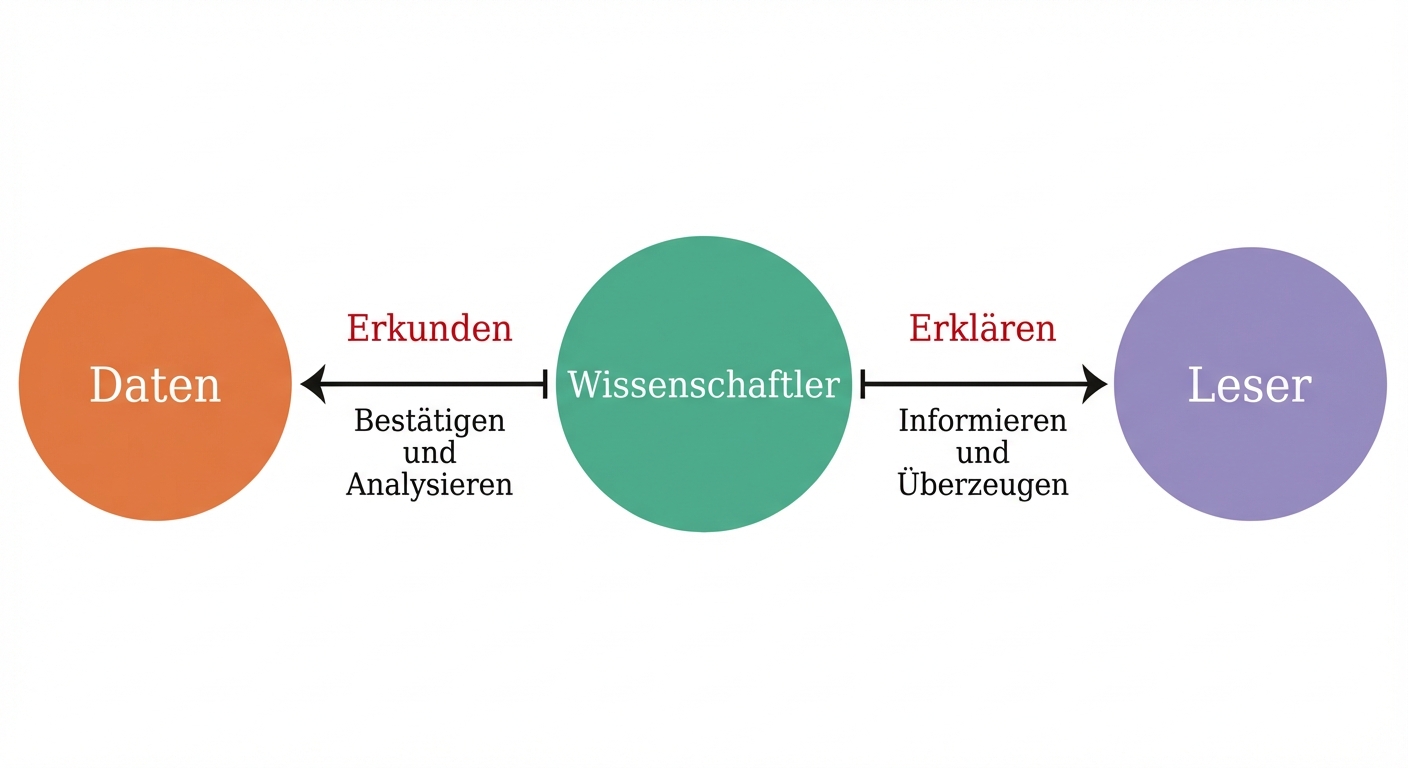
Explorativ versus erklärend
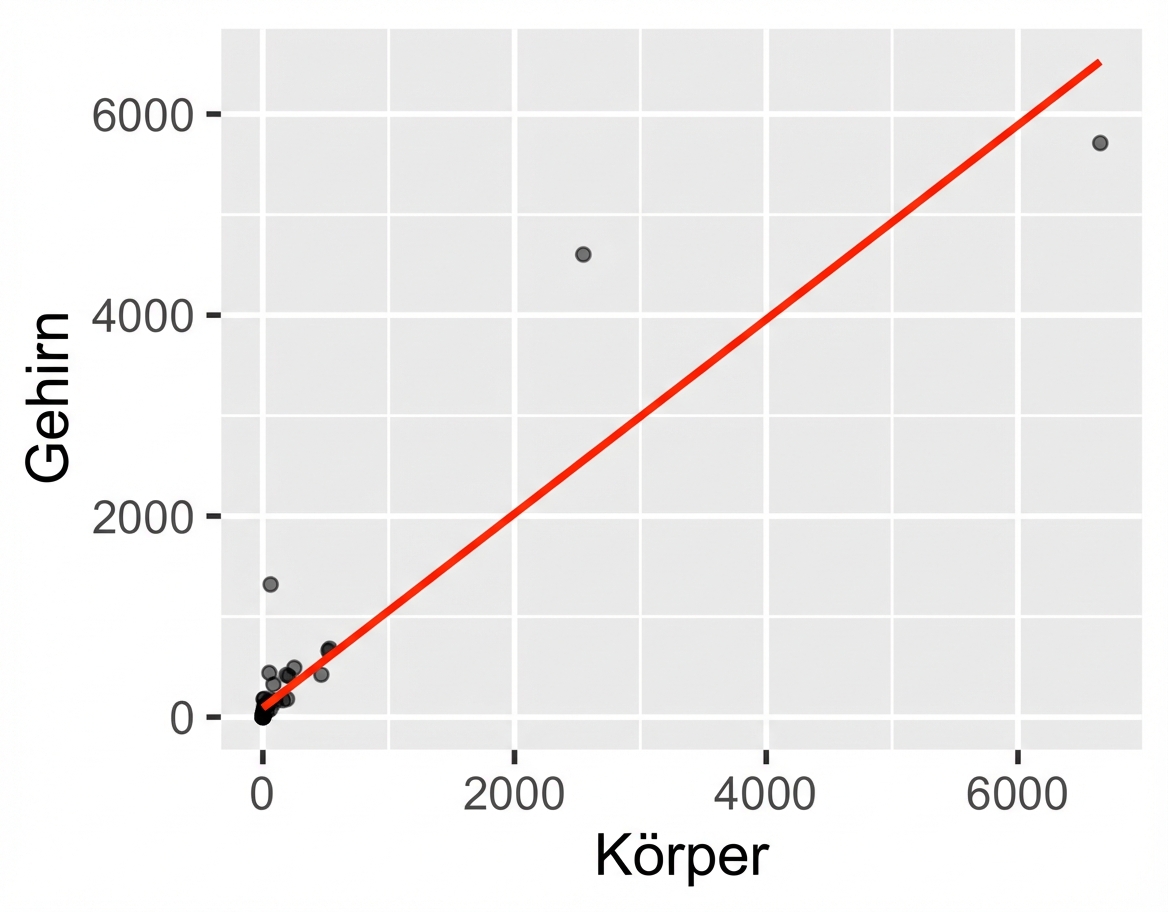
Ein Streudiagramm
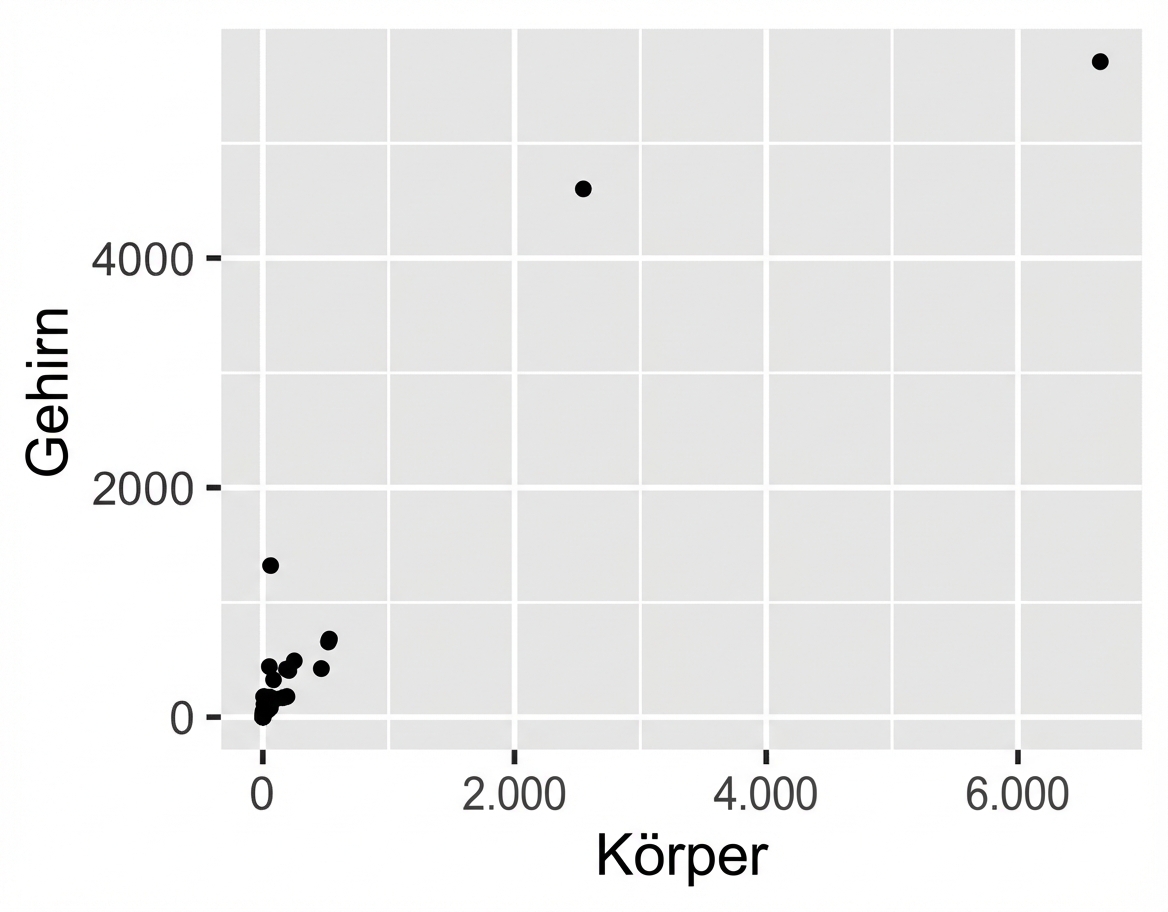
Erkundung mit einem linearen Modell
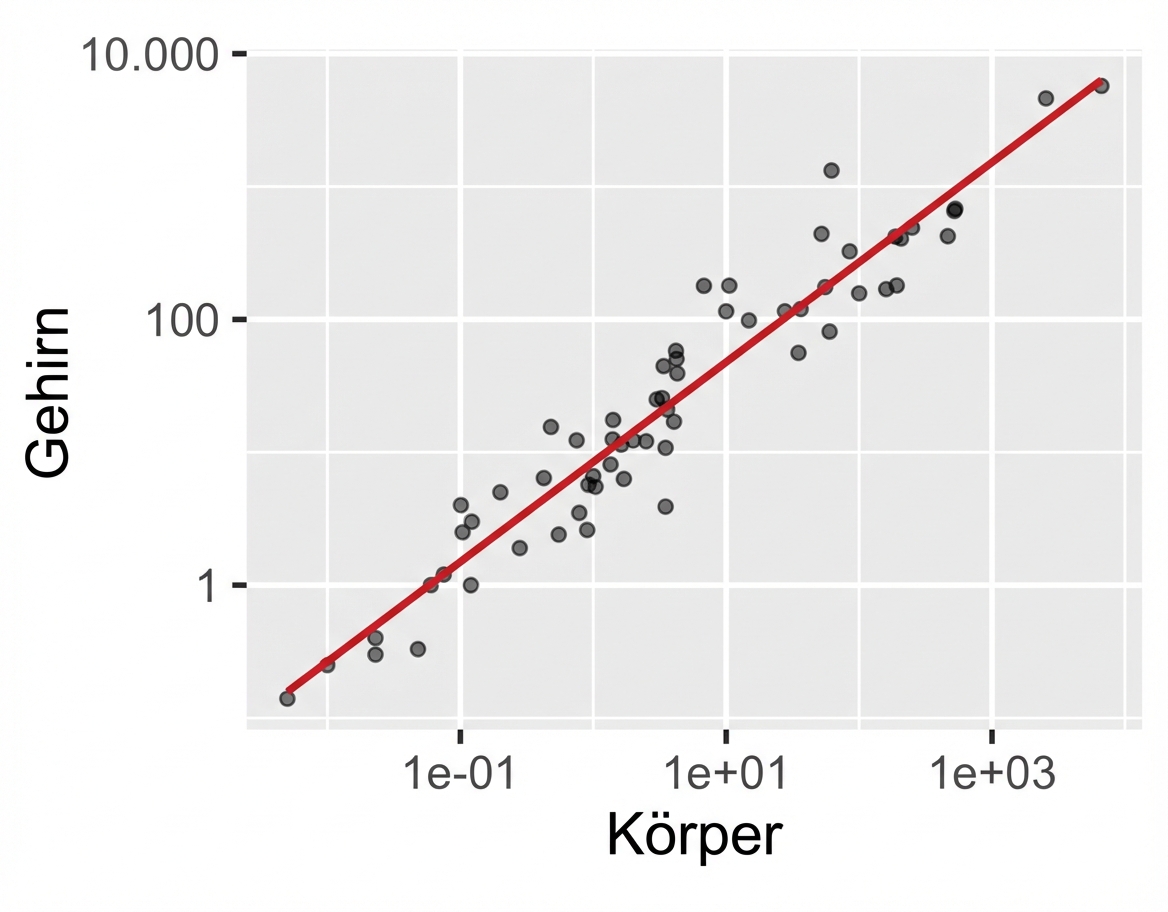
Erkunden: Feinabstimmung
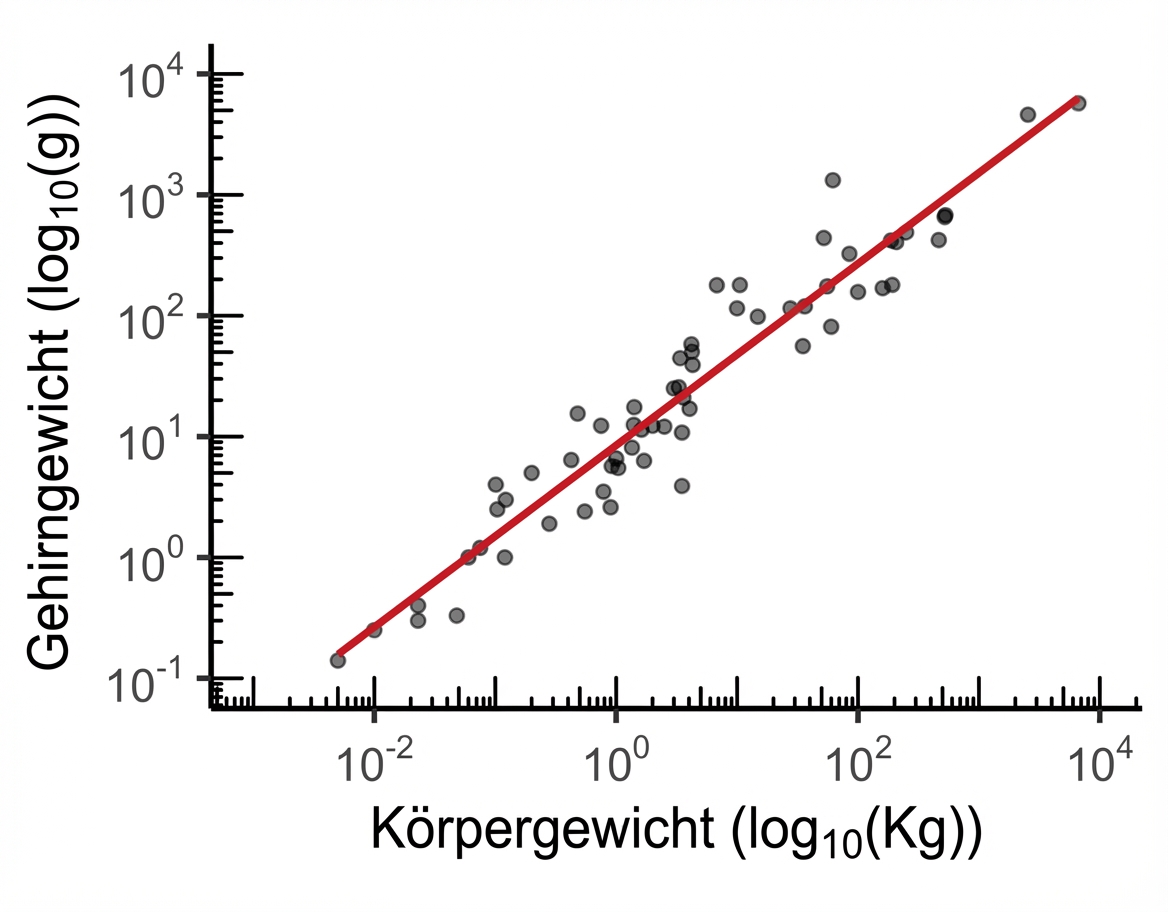
Publikationsreifes Diagramm
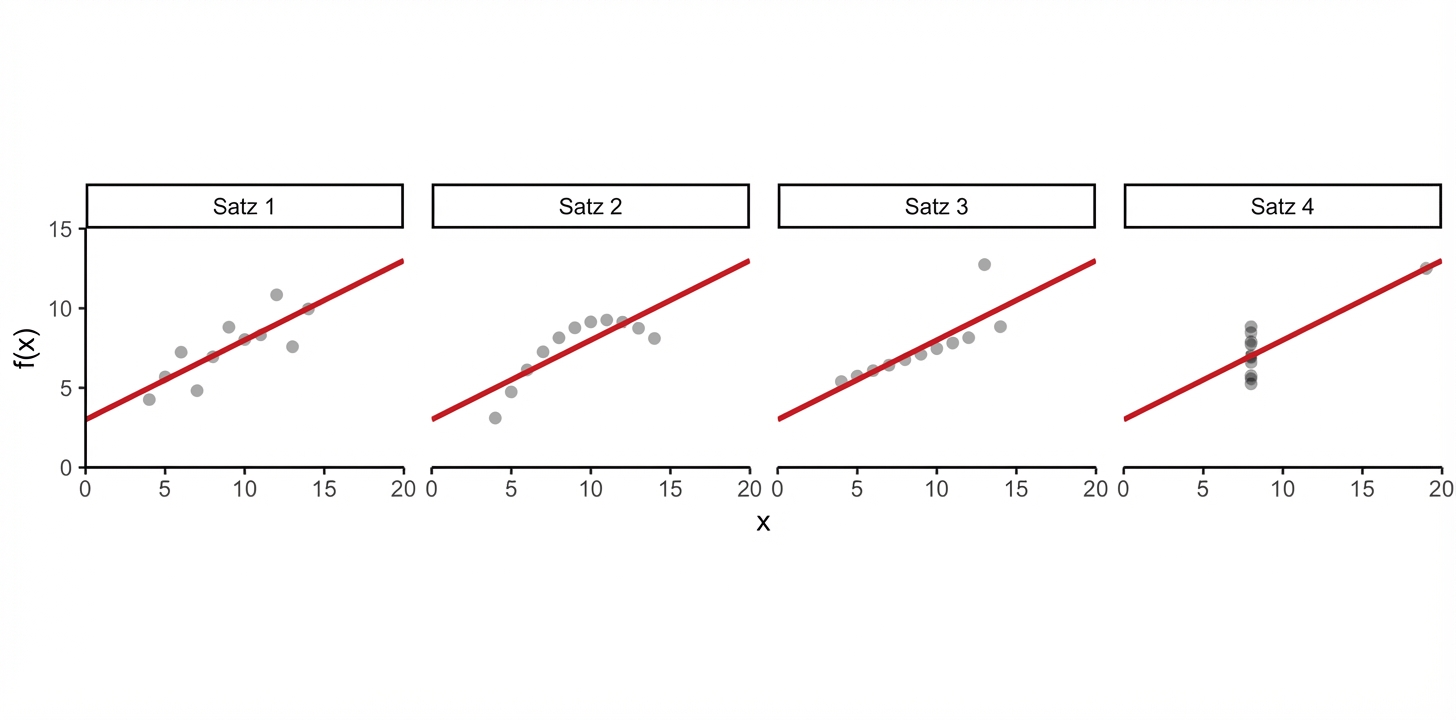
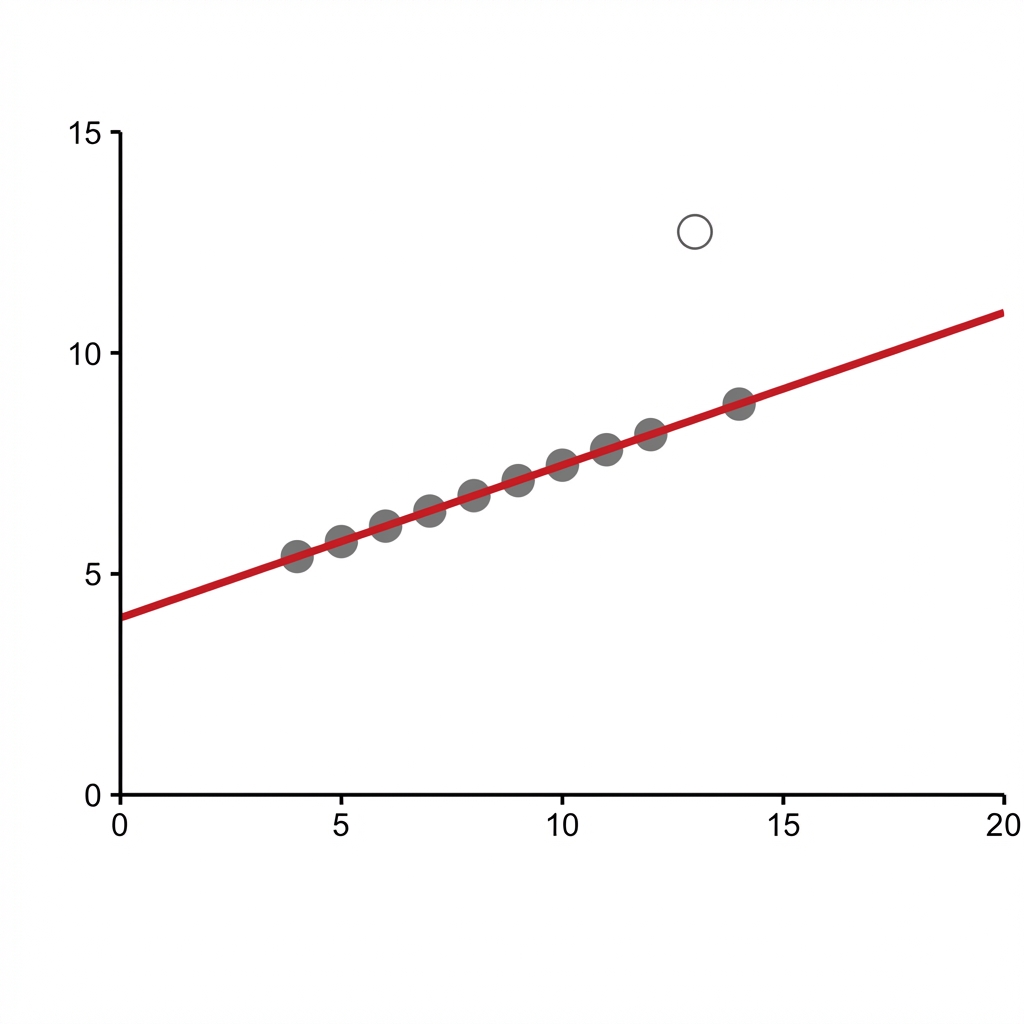
Anscombes Diagramme
Anscombes Diagramme
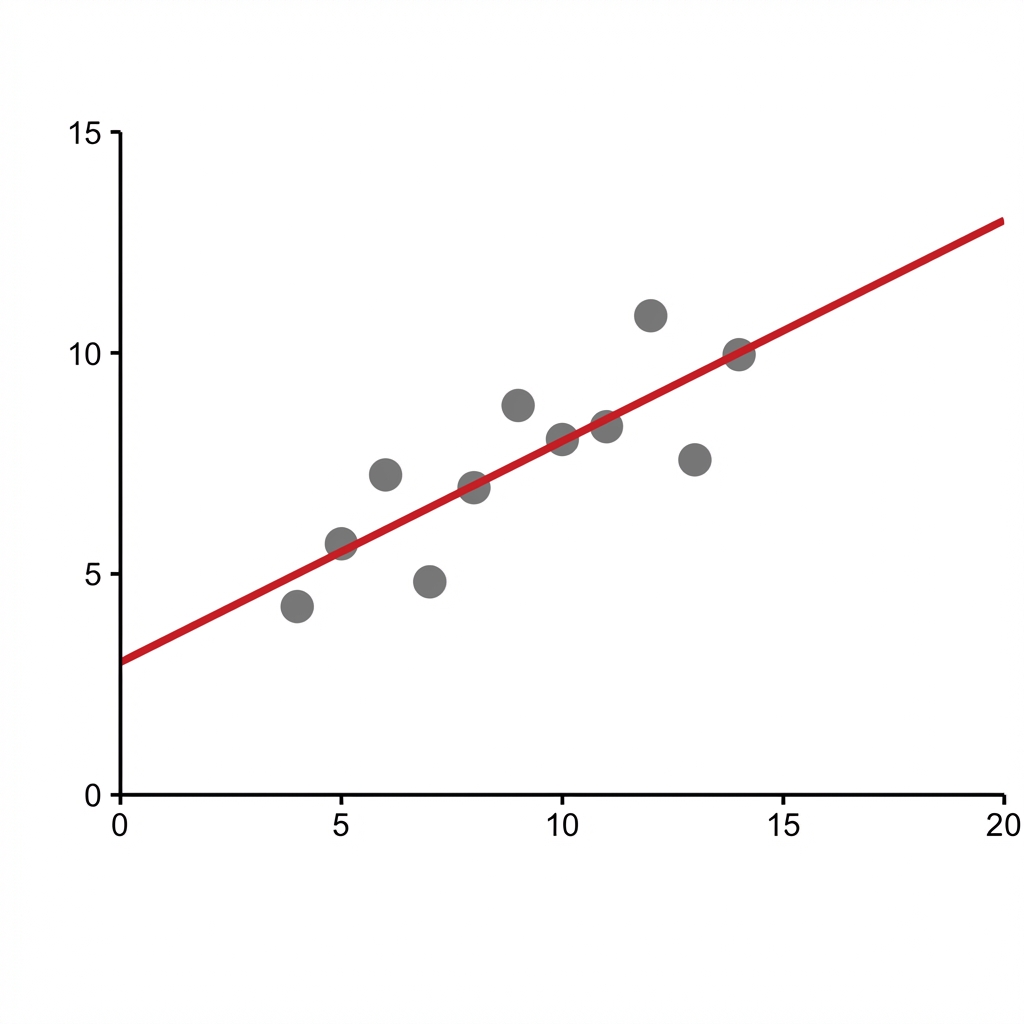
Anscombes Diagramme
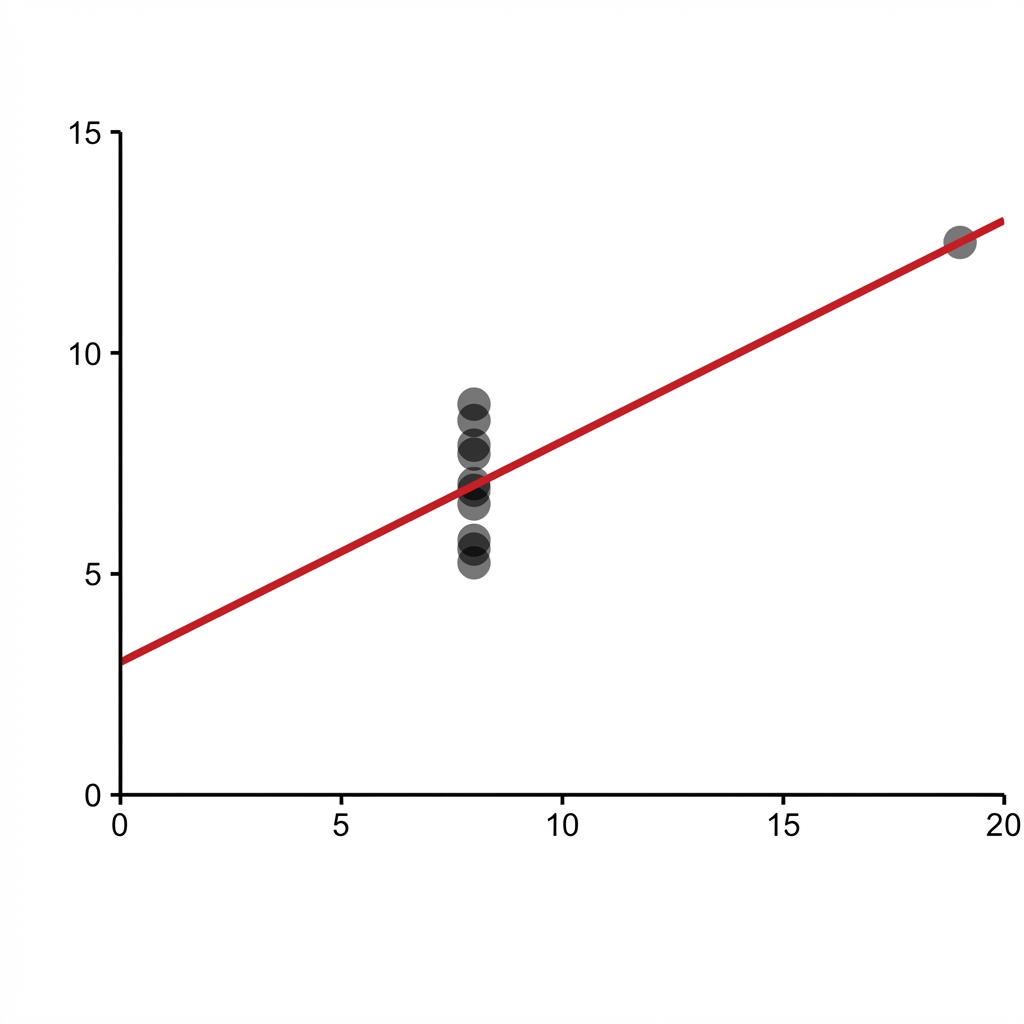
Anscombes Diagramme
Anscombes Diagramme
Anscombes Diagramme
Anscombes Diagramme
Anscombes Diagramme
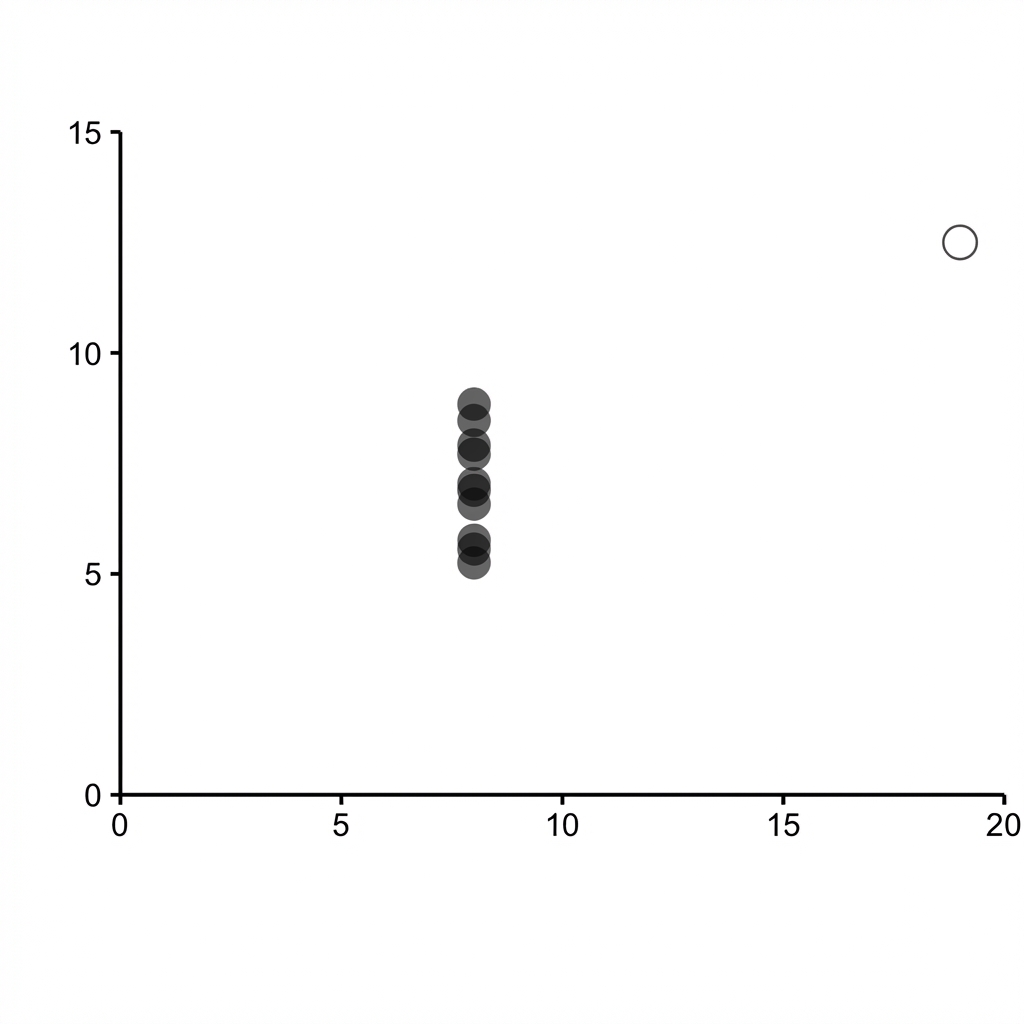
Anscombes Diagramme