Best Practices für ästhetische Elemente
Einführung in die Datenvisualisierung mit ggplot2

Rick Scavetta
Founder, Scavetta Academy
Die Form folgt der Funktion
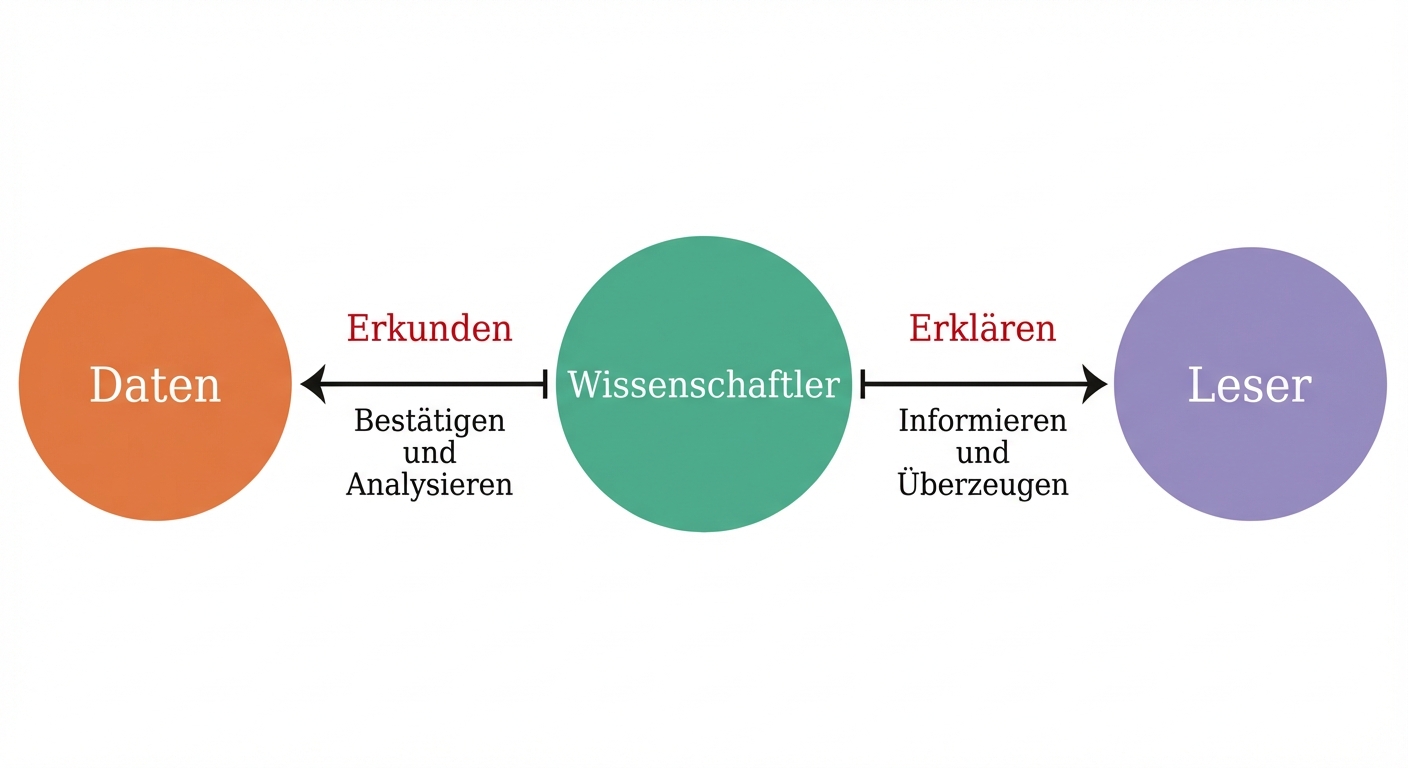
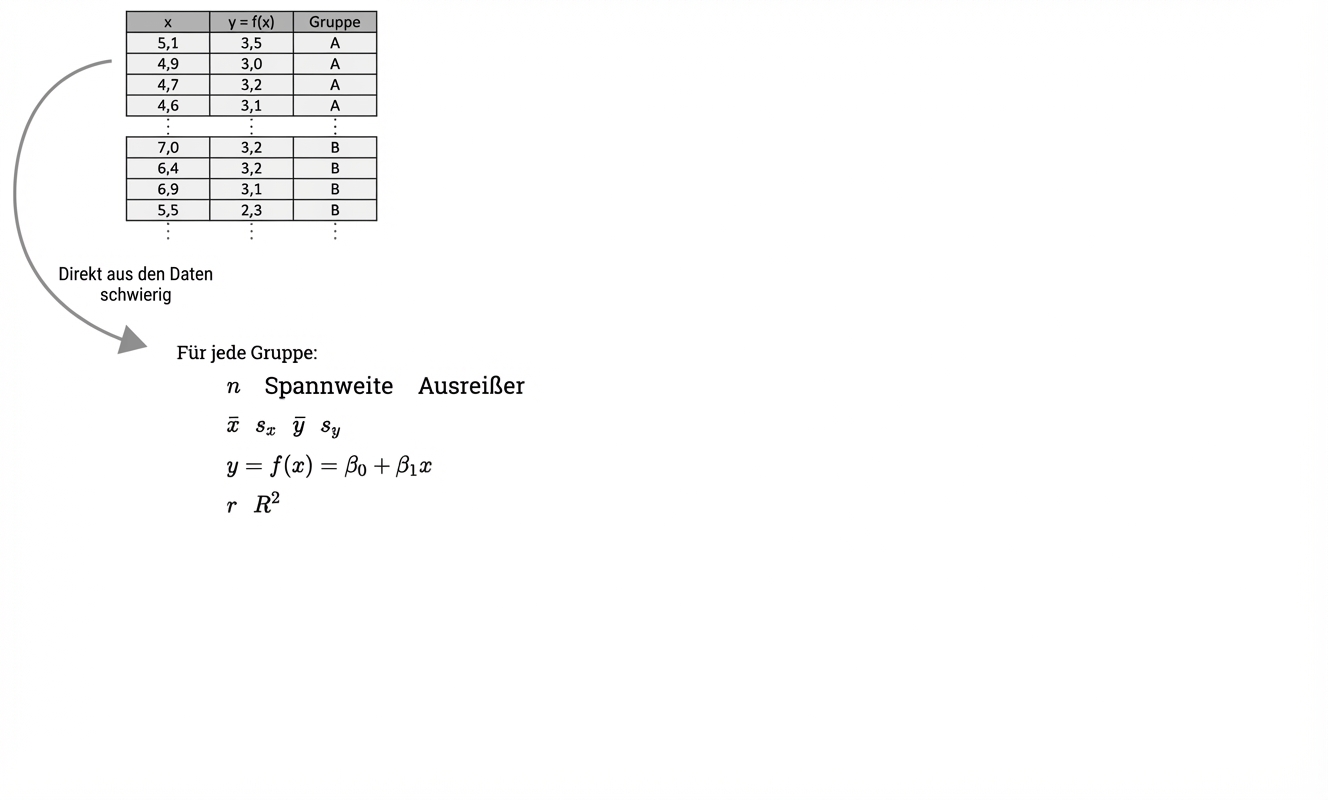
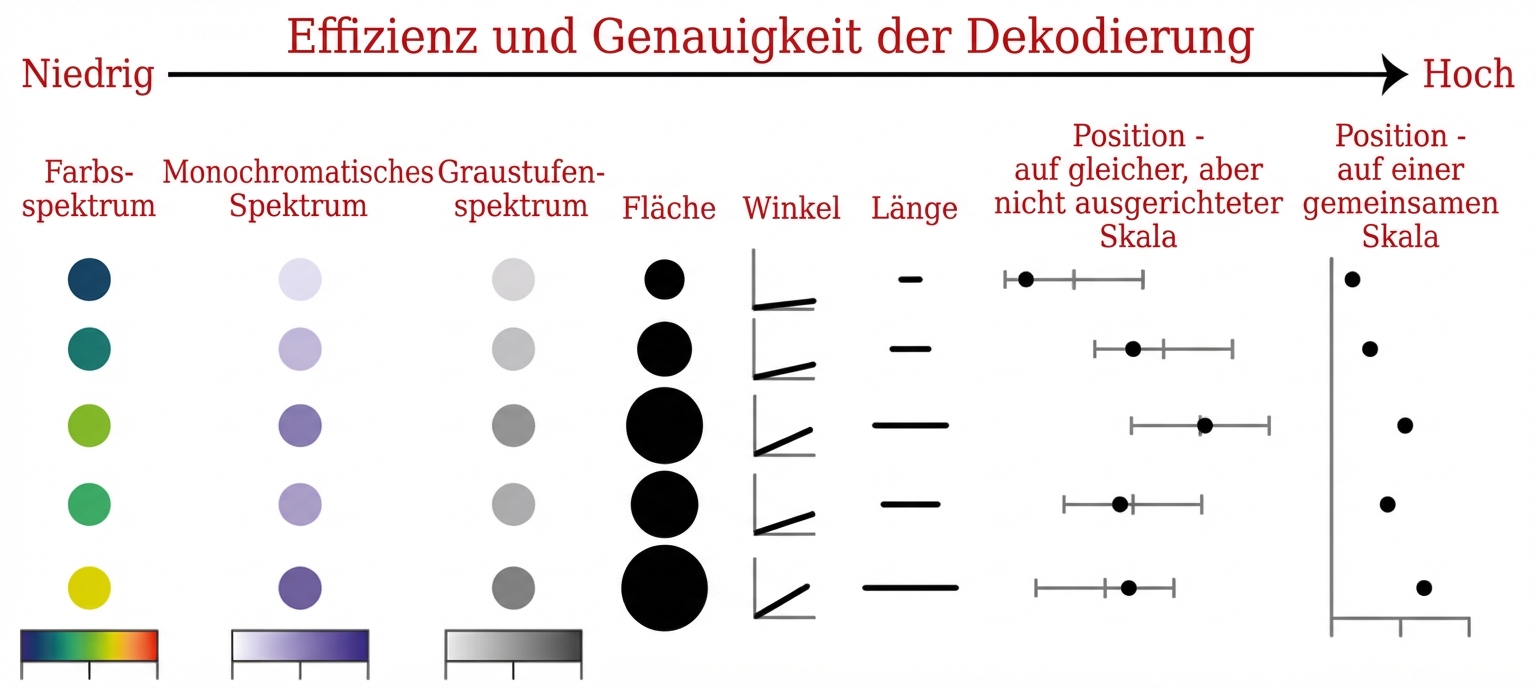
Informationen aus Daten extrahieren

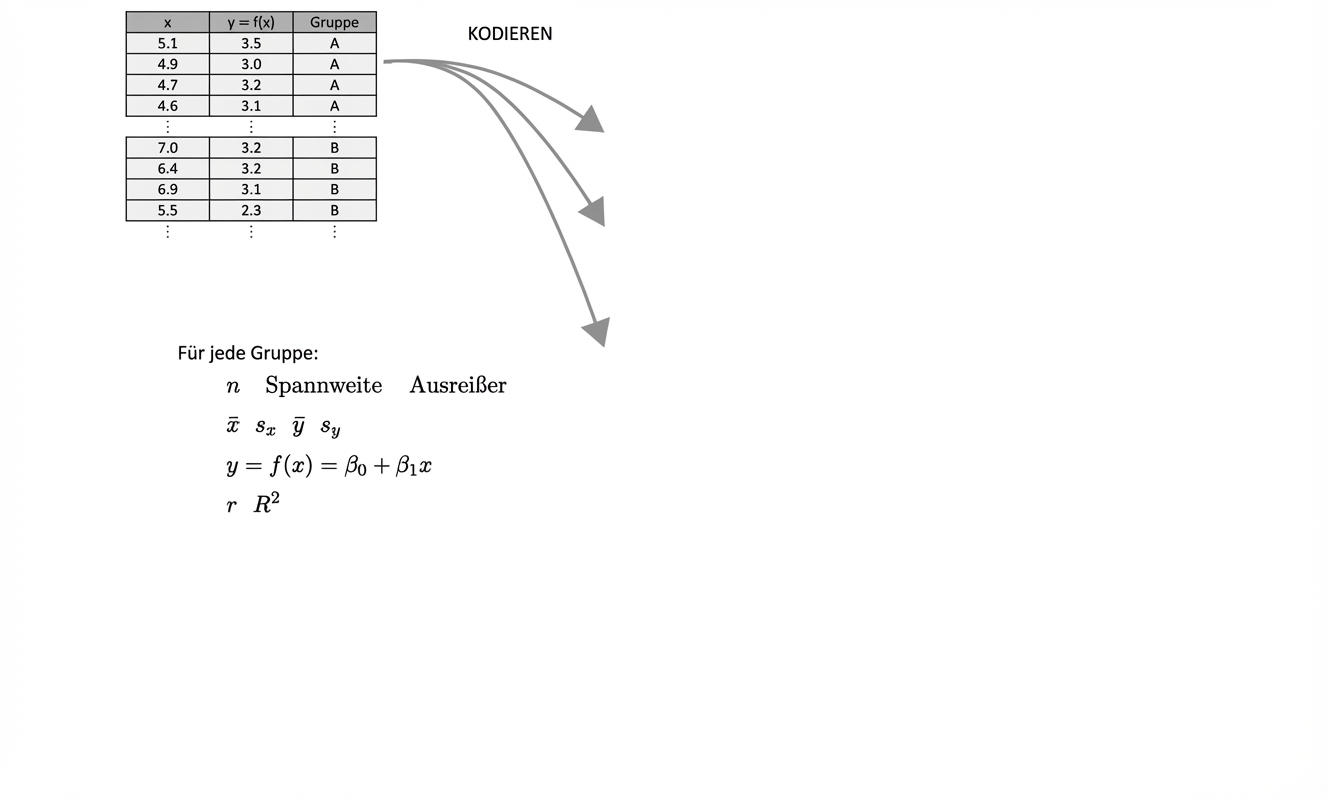
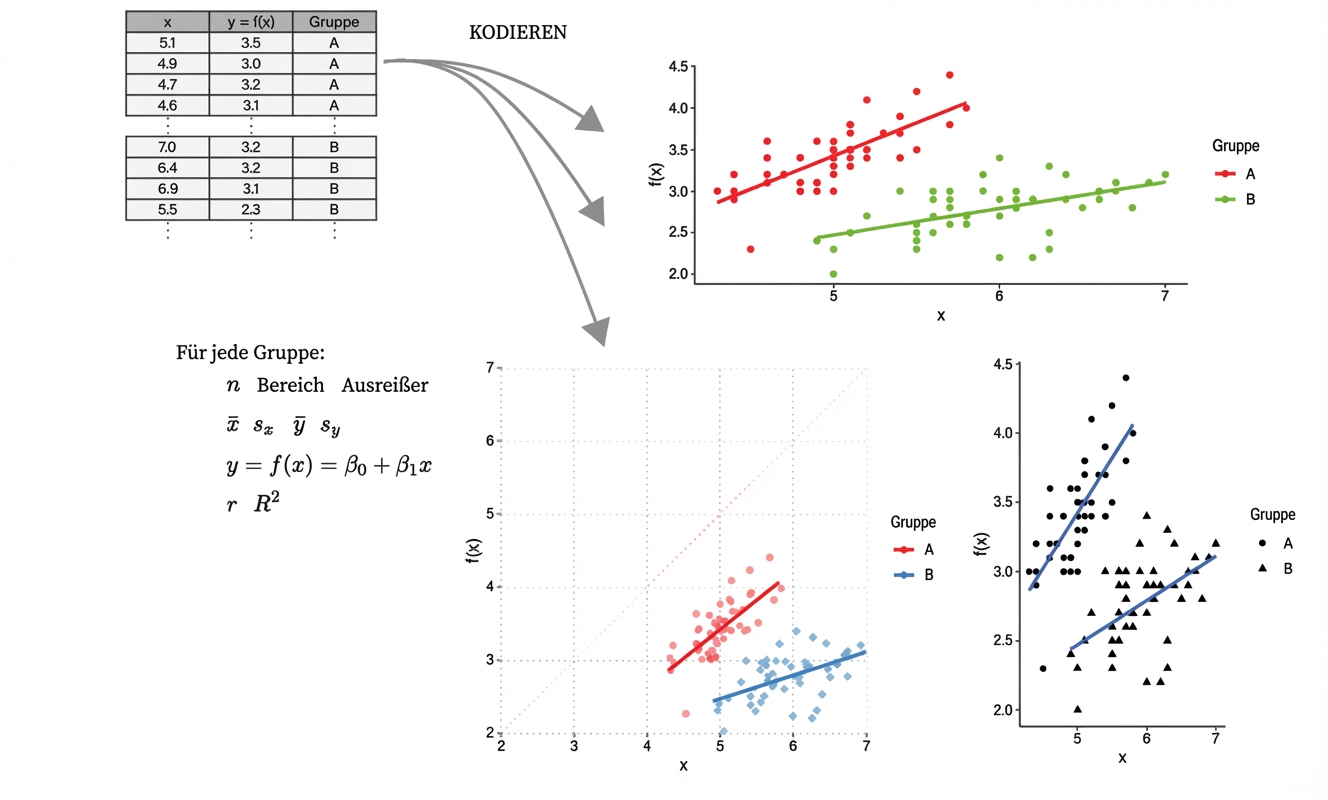
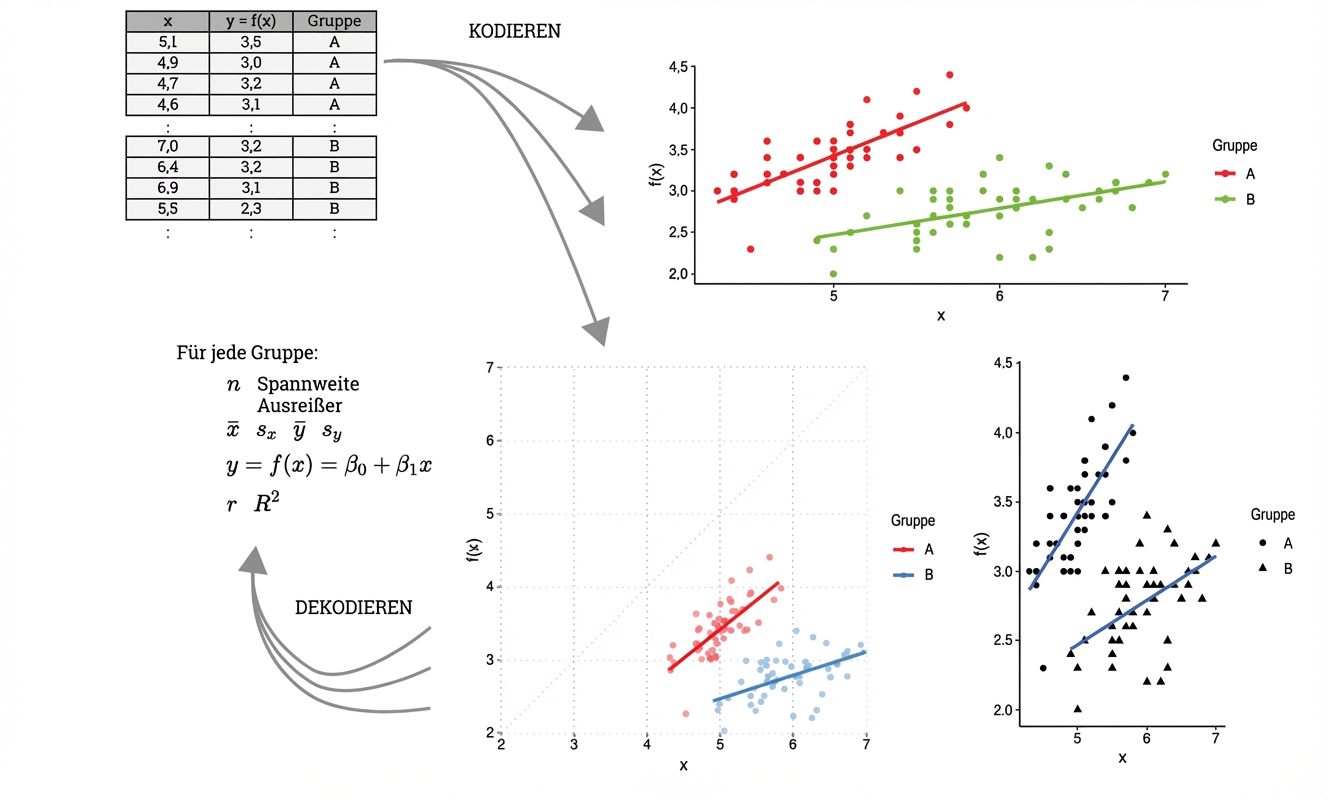
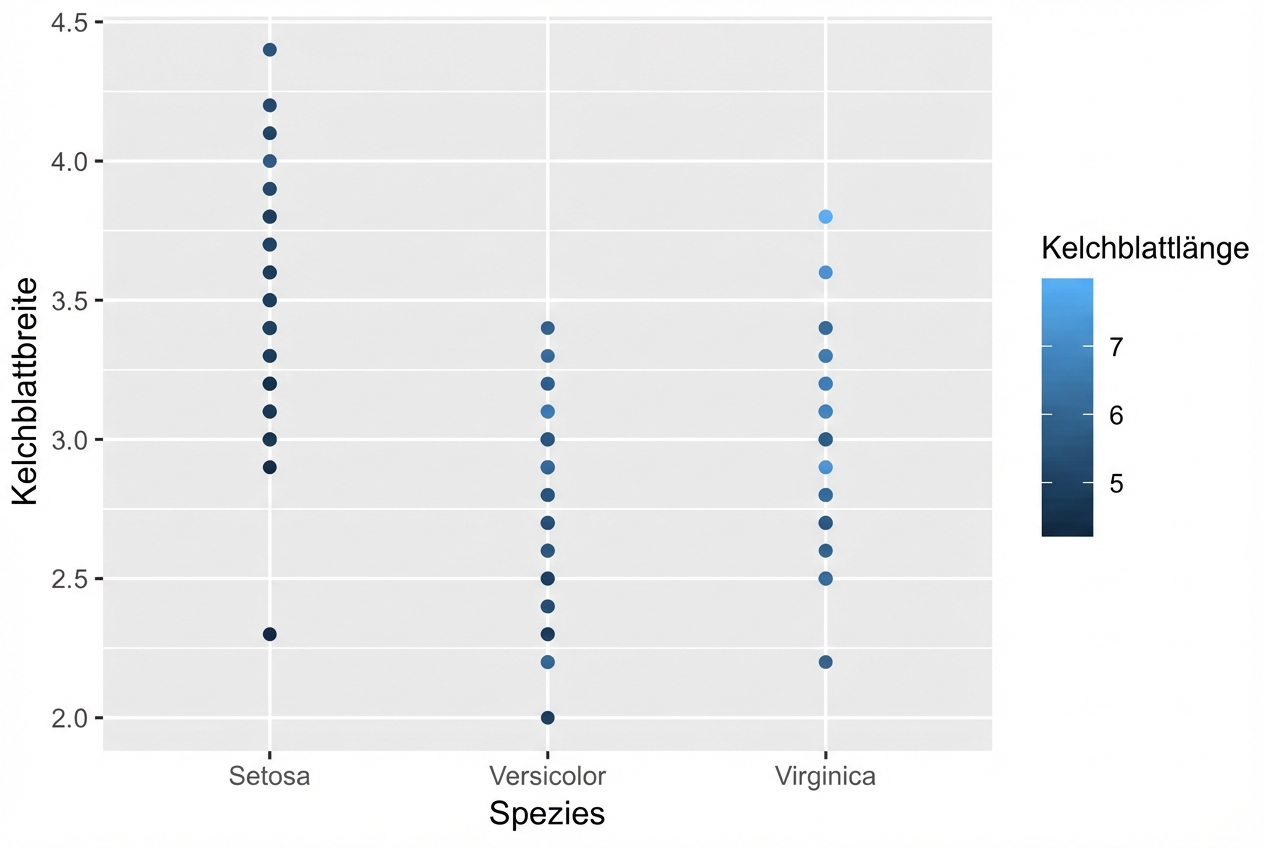
Ästhetische Elemente – kontinuierliche Variablen
Ästhetische Elemente – kontinuierliche Variablen
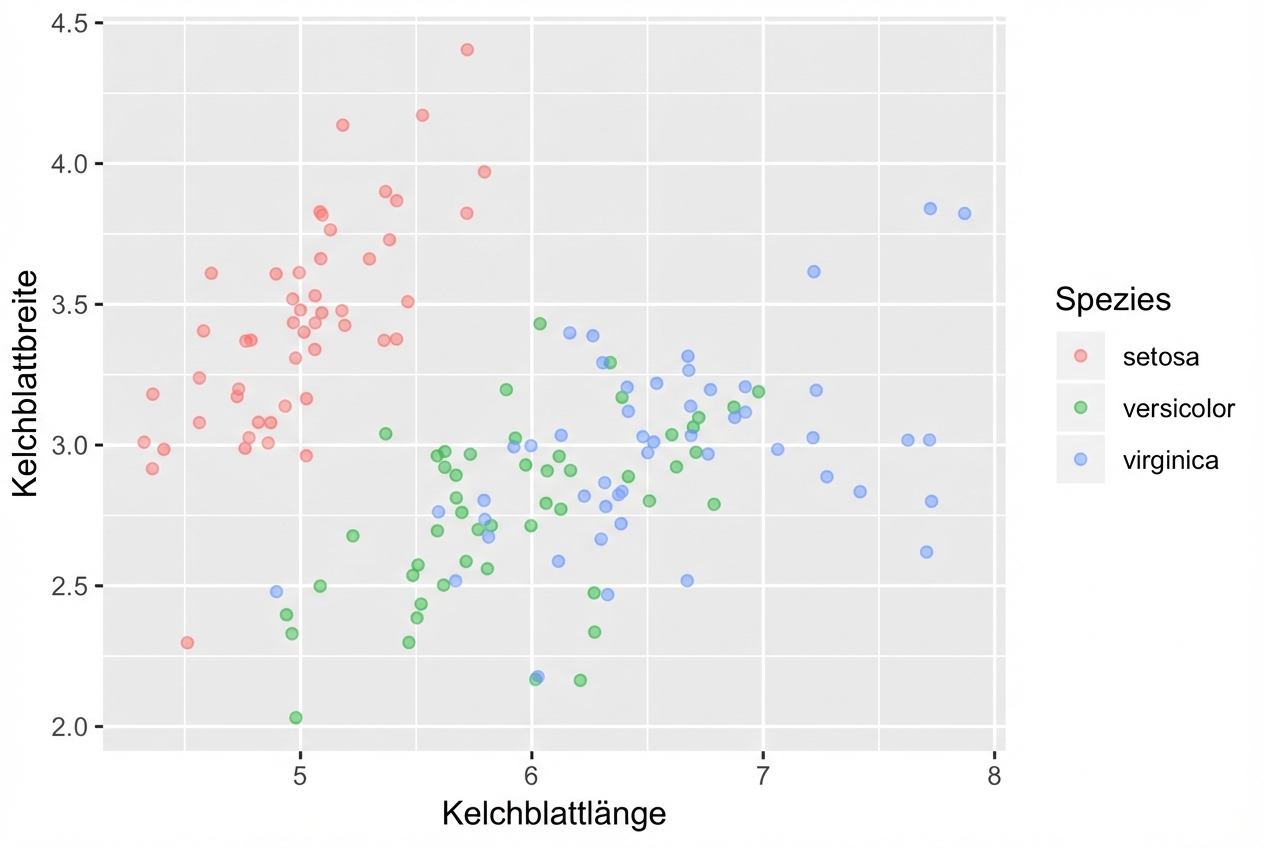
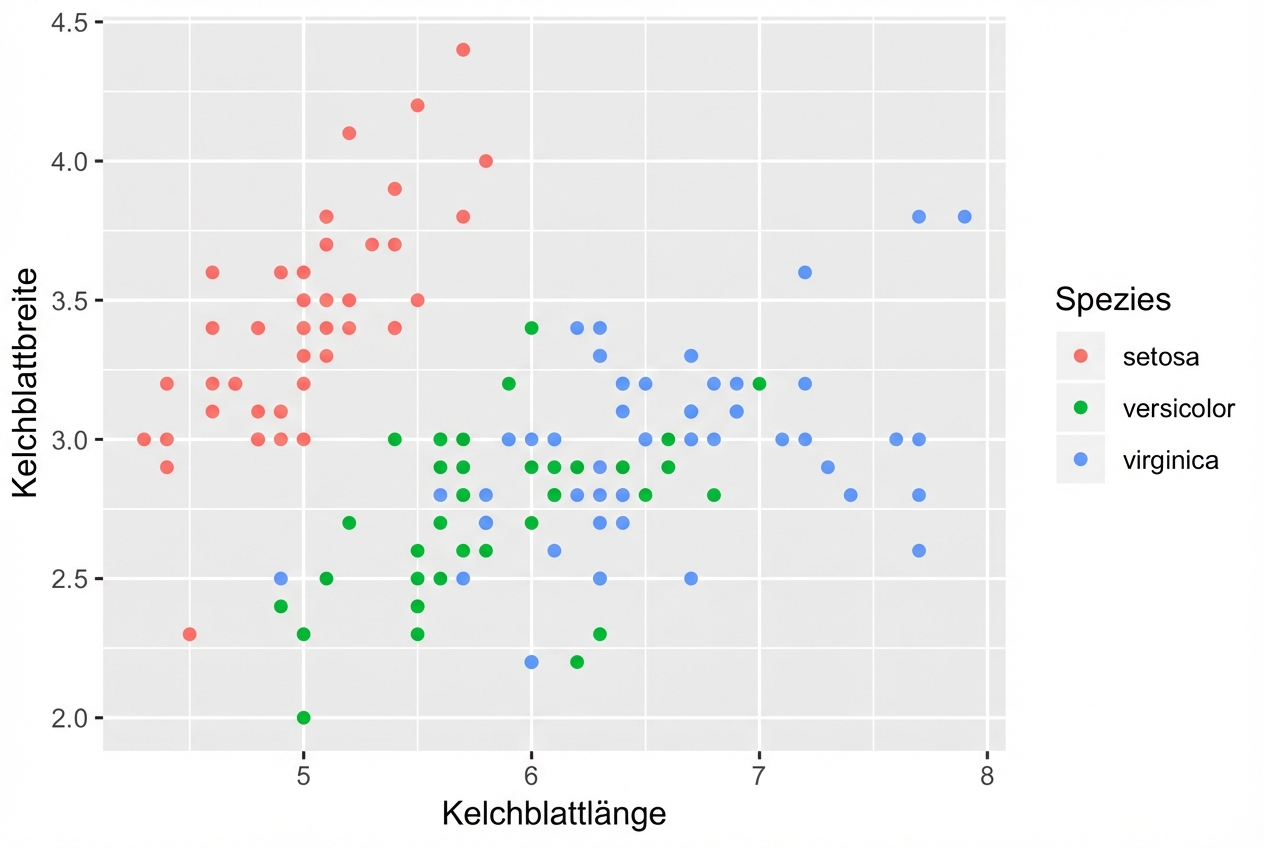
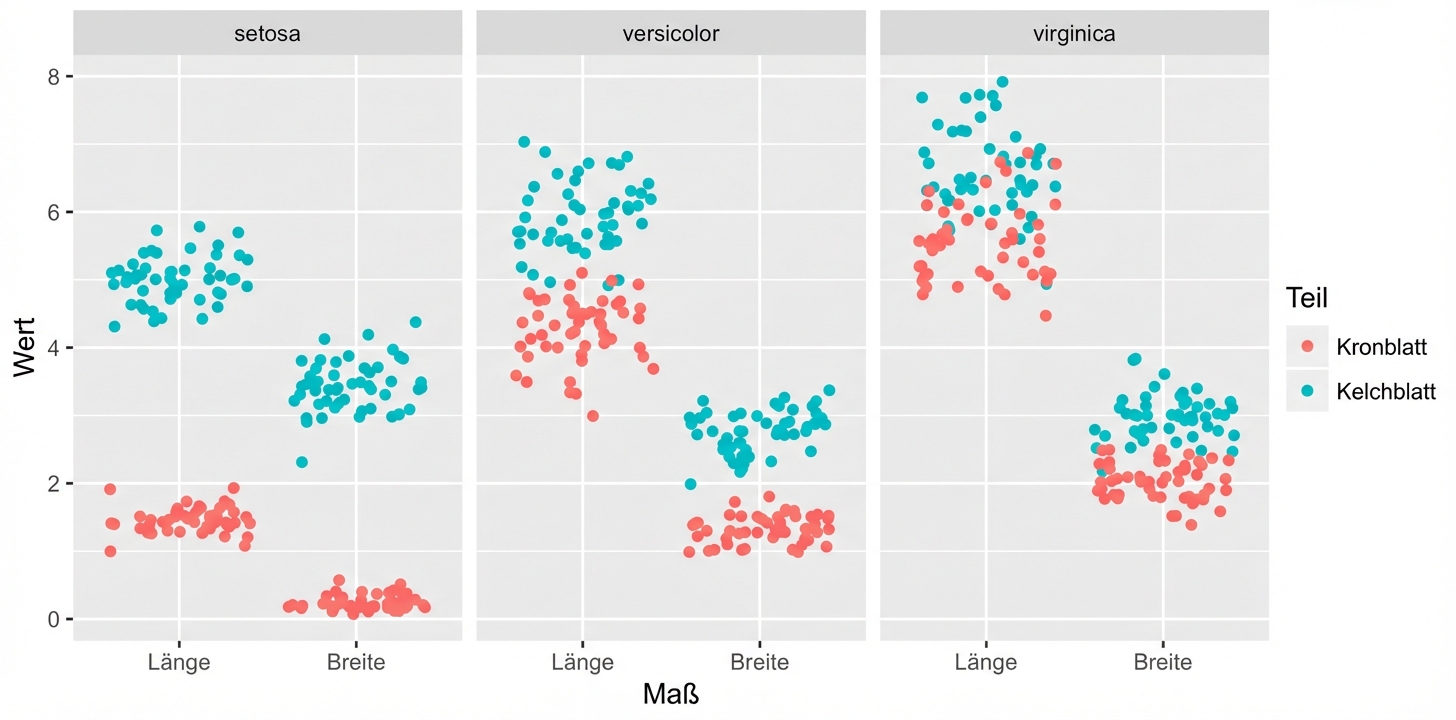
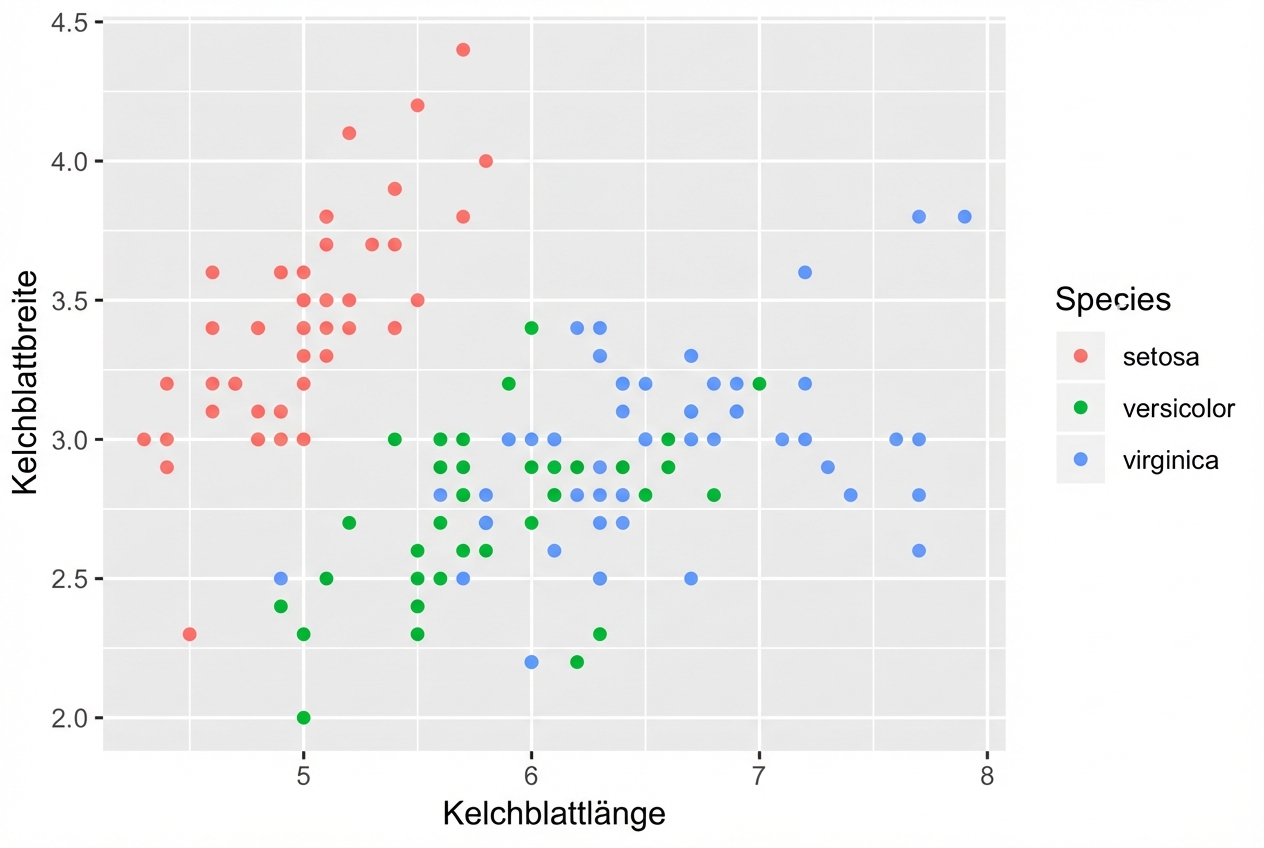
Drei Iris-Streudiagramme
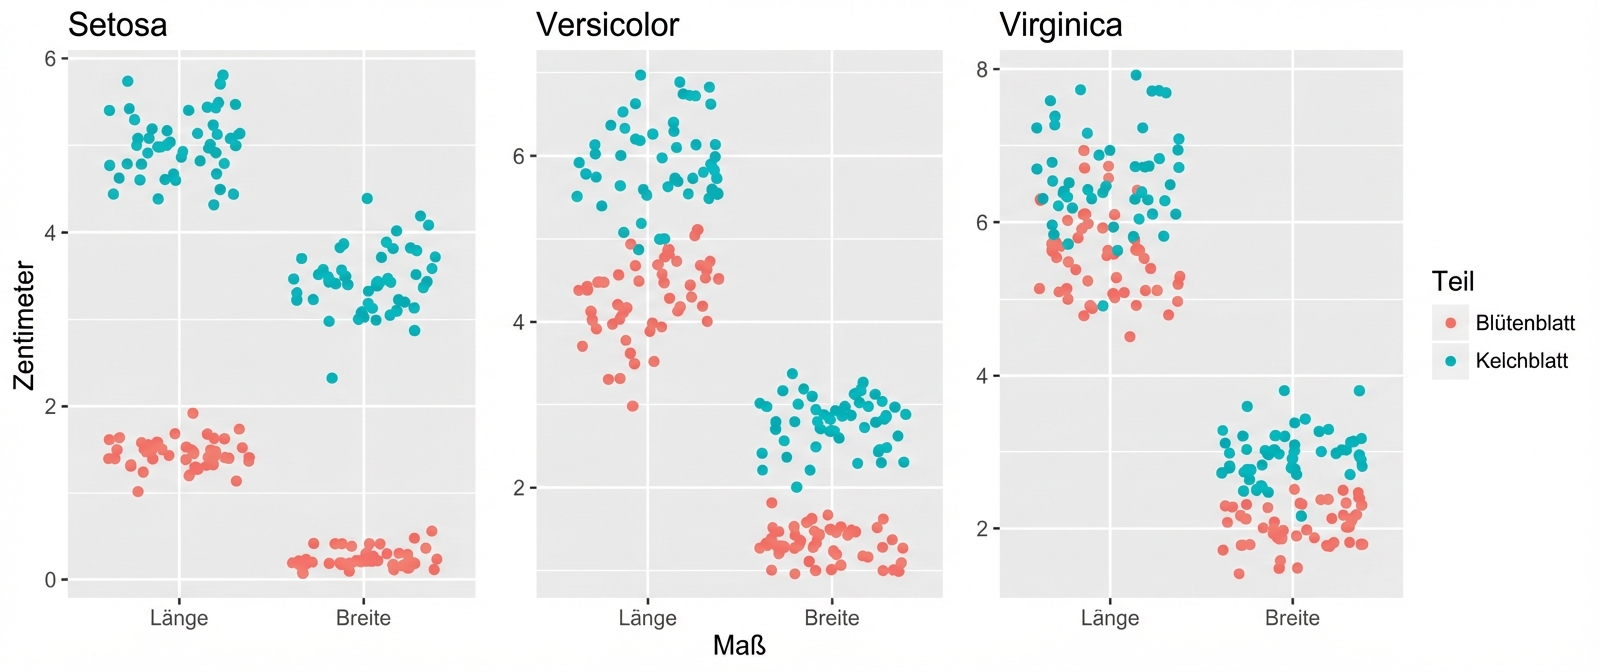
Drei Iris-Streudiagramme, nicht ausgerichtete y-Achsen
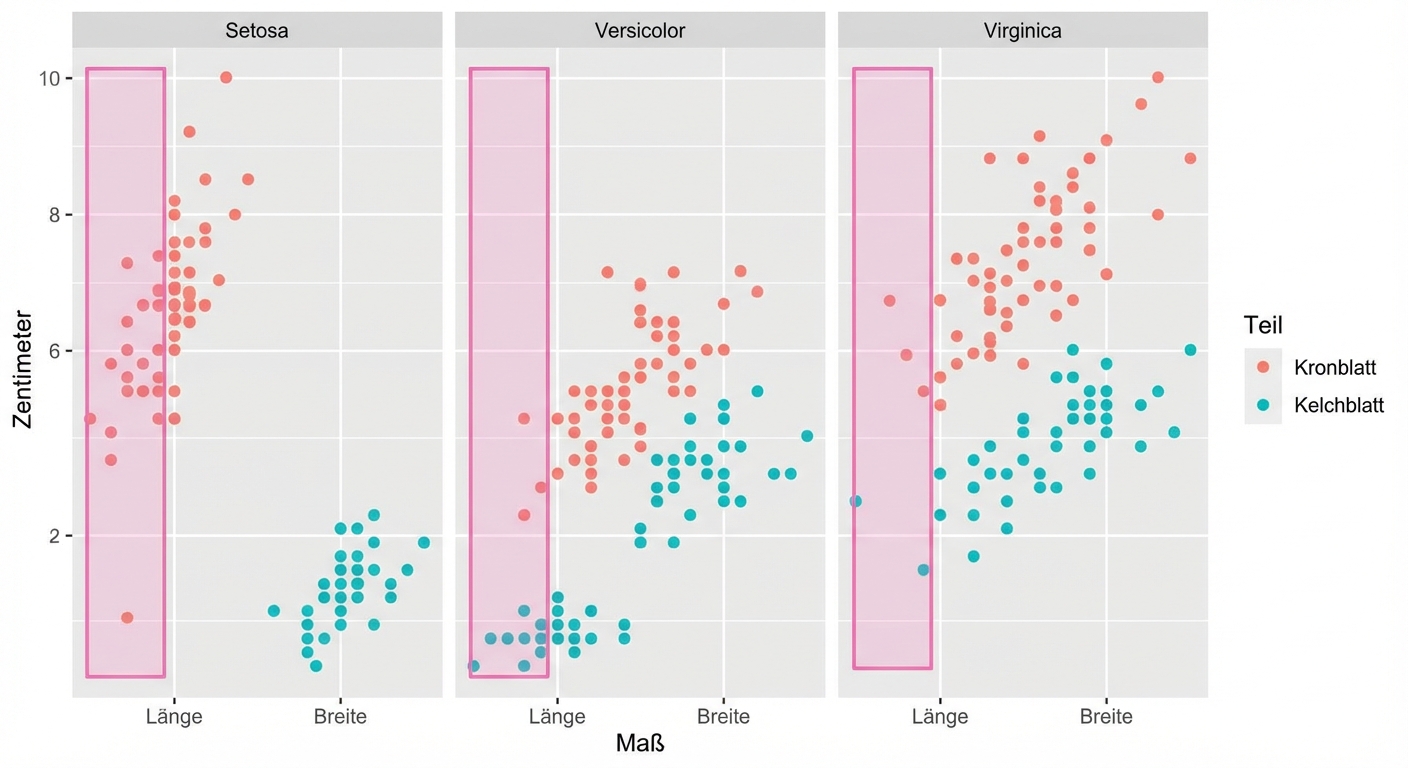
Einzelne facettierte Darstellung, gemeinsame y-Achse
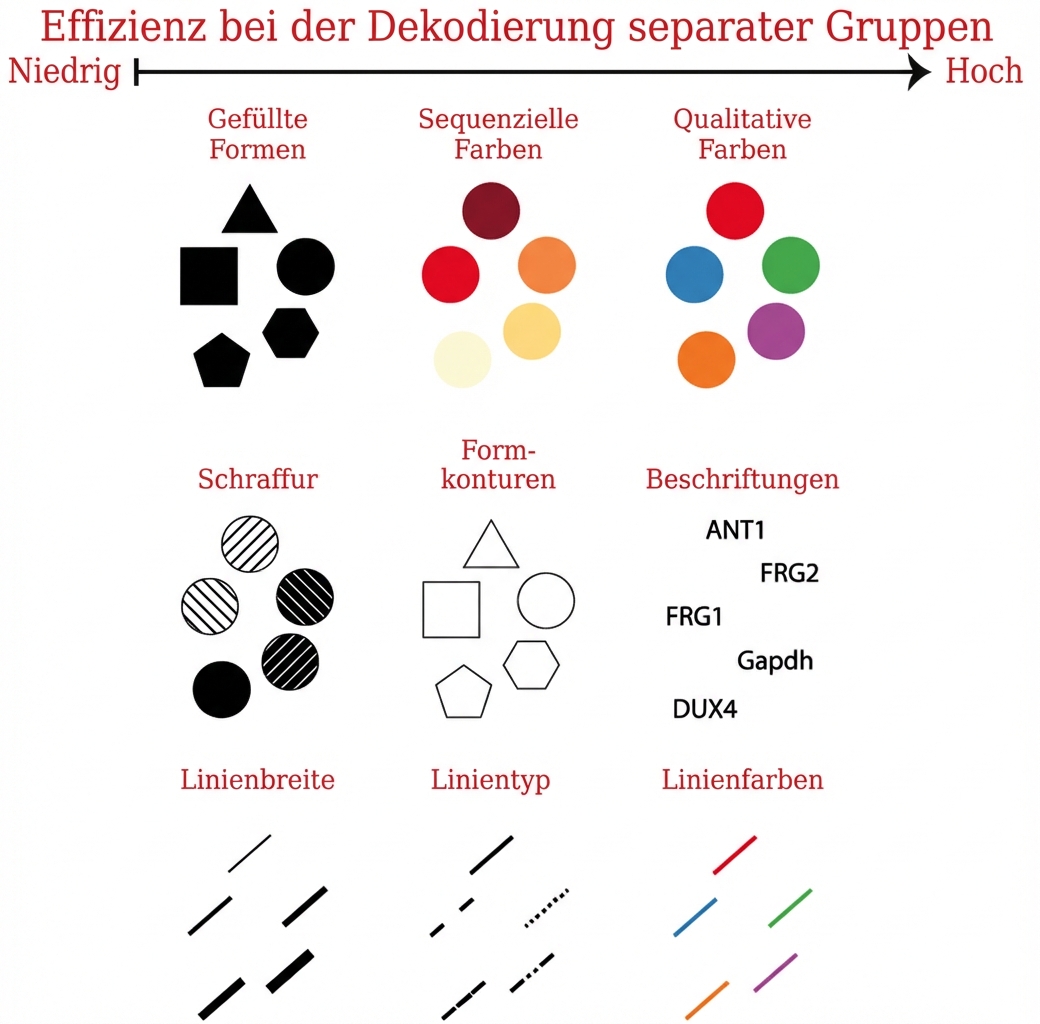
Ästhetische Elemente – kategoriale Variablen
Ästhetische Elemente – kategoriale Variablen