Grundlagen von Themes
Einführung in die Datenvisualisierung mit ggplot2

Rick Scavetta
Founder, Scavetta Academy
Ein Diagramm für den Anfang...
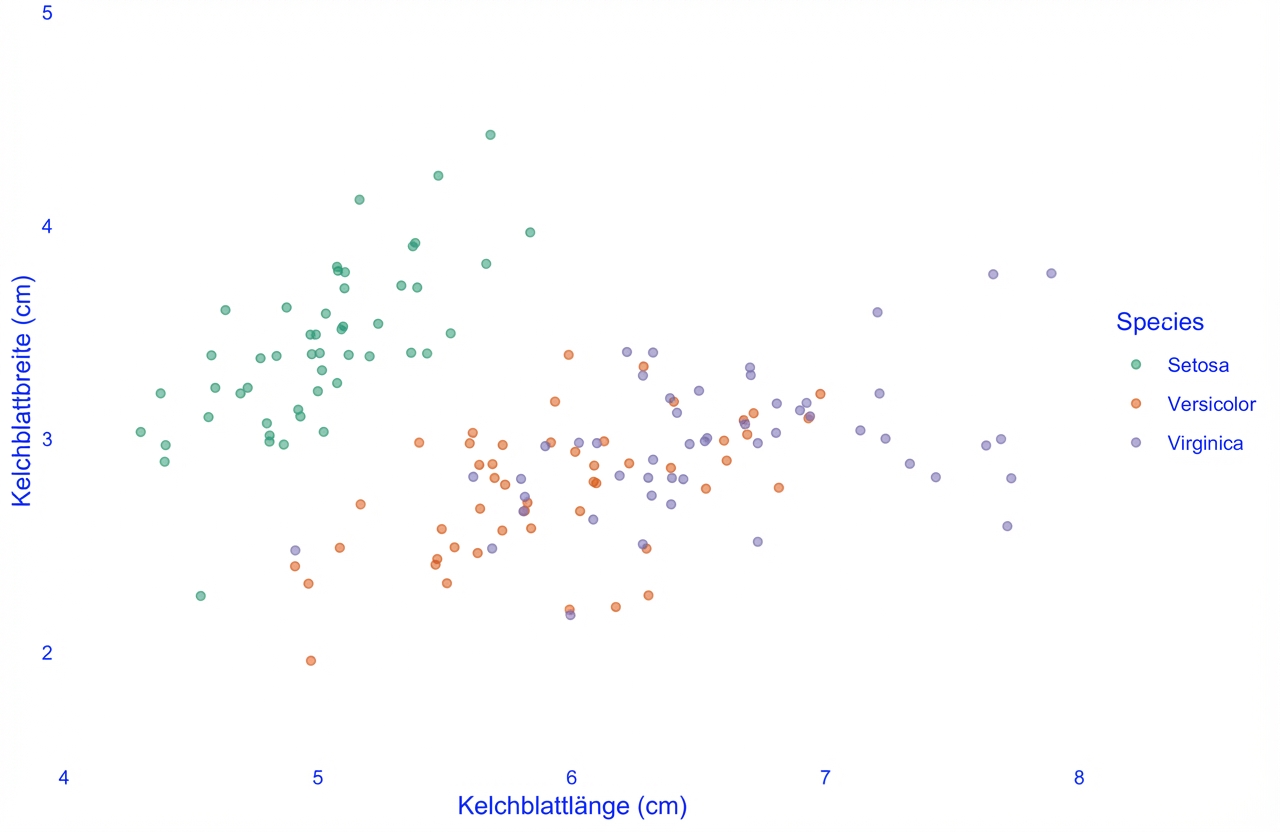
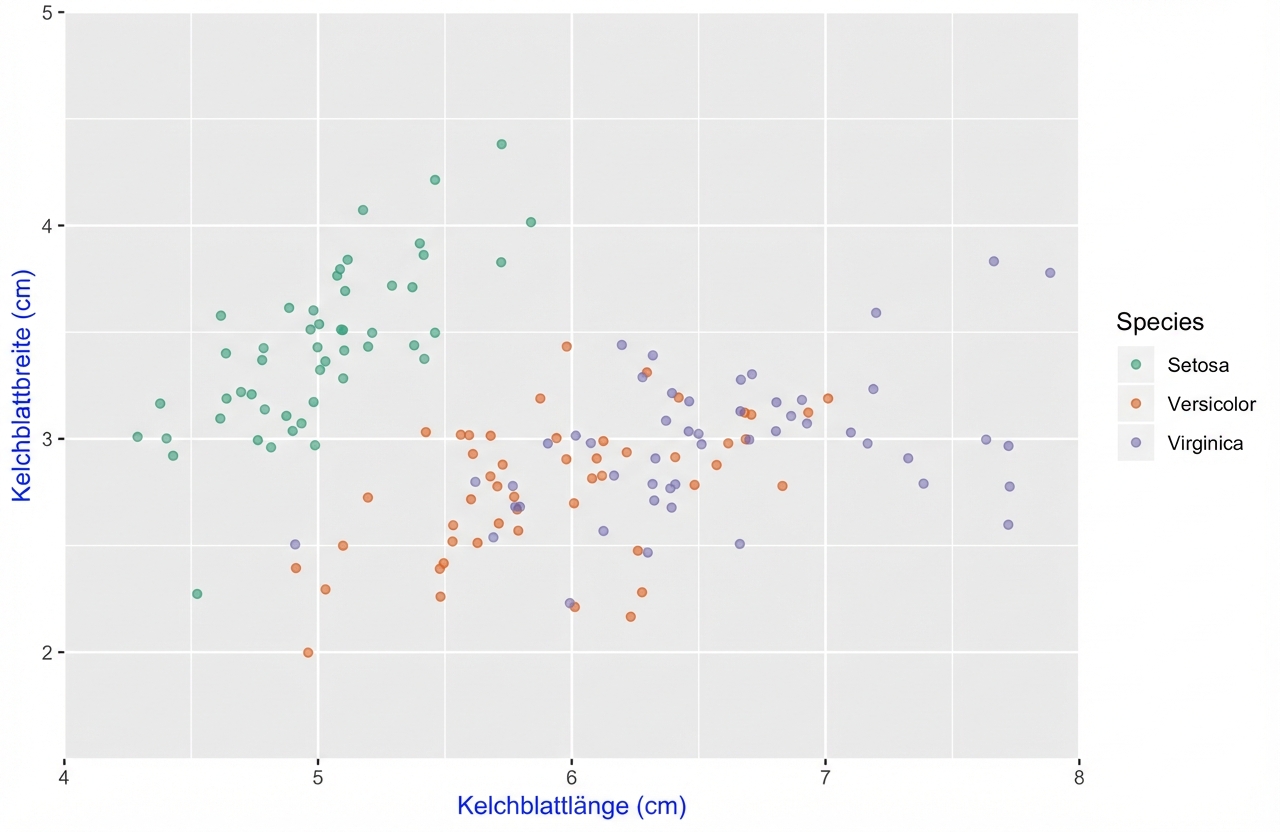
ggplot(iris, aes(x = Sepal.Length, y = Sepal.Width, color = Species)) +
  geom_jitter(alpha = 0.6)
Die Textelemente
Die Textelemente
Anpassen von Theme-Elementen
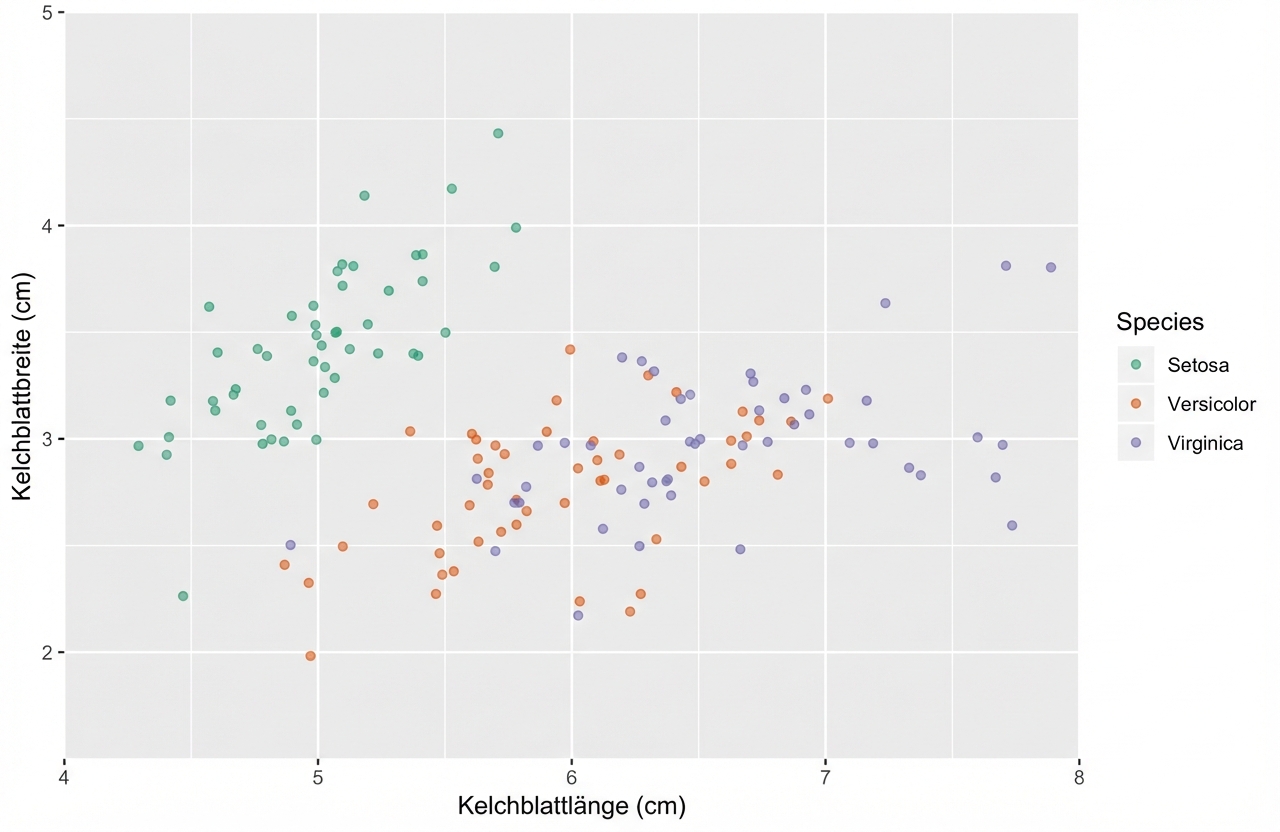
ggplot(iris, aes(x = Sepal.Length, y = Sepal.Width, color = Species)) +
  geom_jitter(alpha = 0.6) +
  theme(axis.title = element_text(color = "blue"))
Ein Diagramm für den Anfang...
ggplot(iris, aes(x = Sepal.Length, y = Sepal.Width, color = Species)) +
  geom_jitter(alpha = 0.6)
Linienelemente
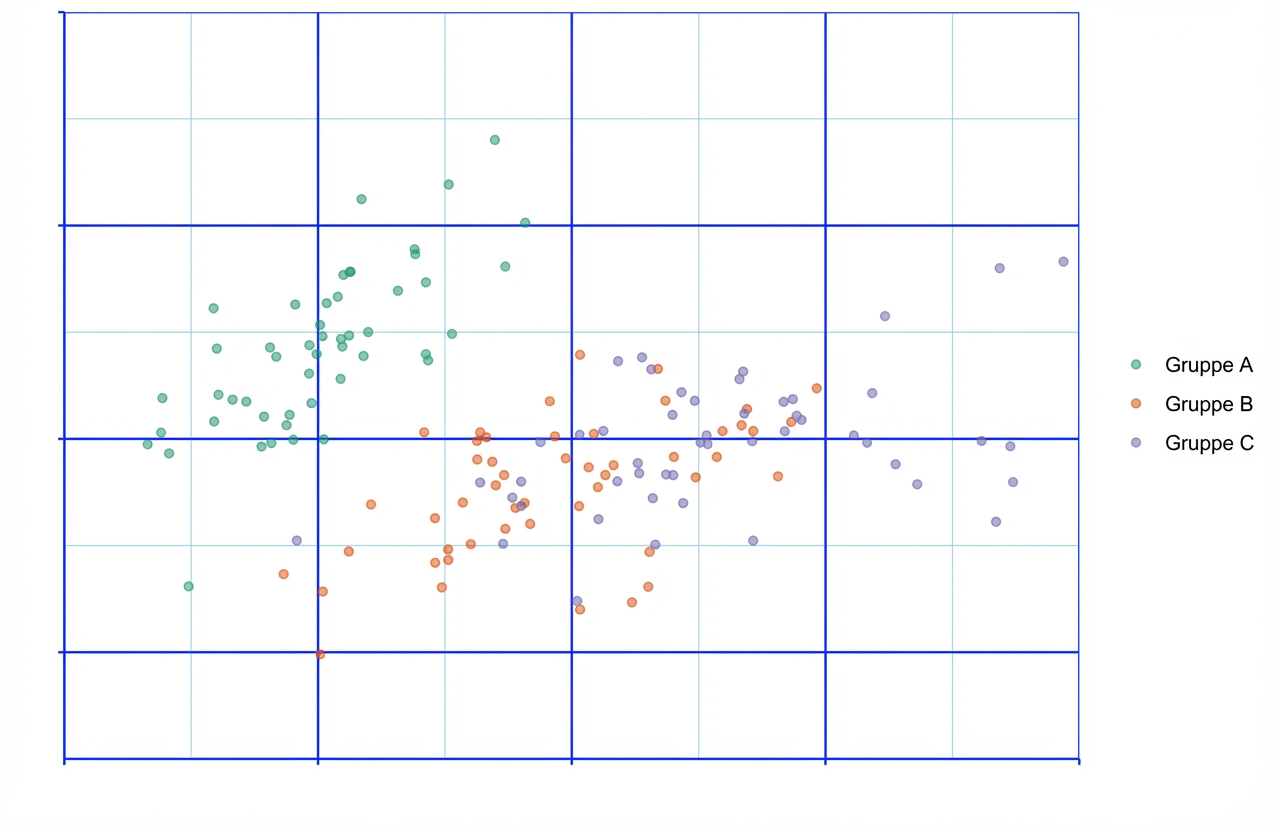
Ein Diagramm für den Anfang...
ggplot(iris, aes(x = Sepal.Length, y = Sepal.Width, color = Species)) +
  geom_jitter(alpha = 0.6)
Rechteckige Elemente
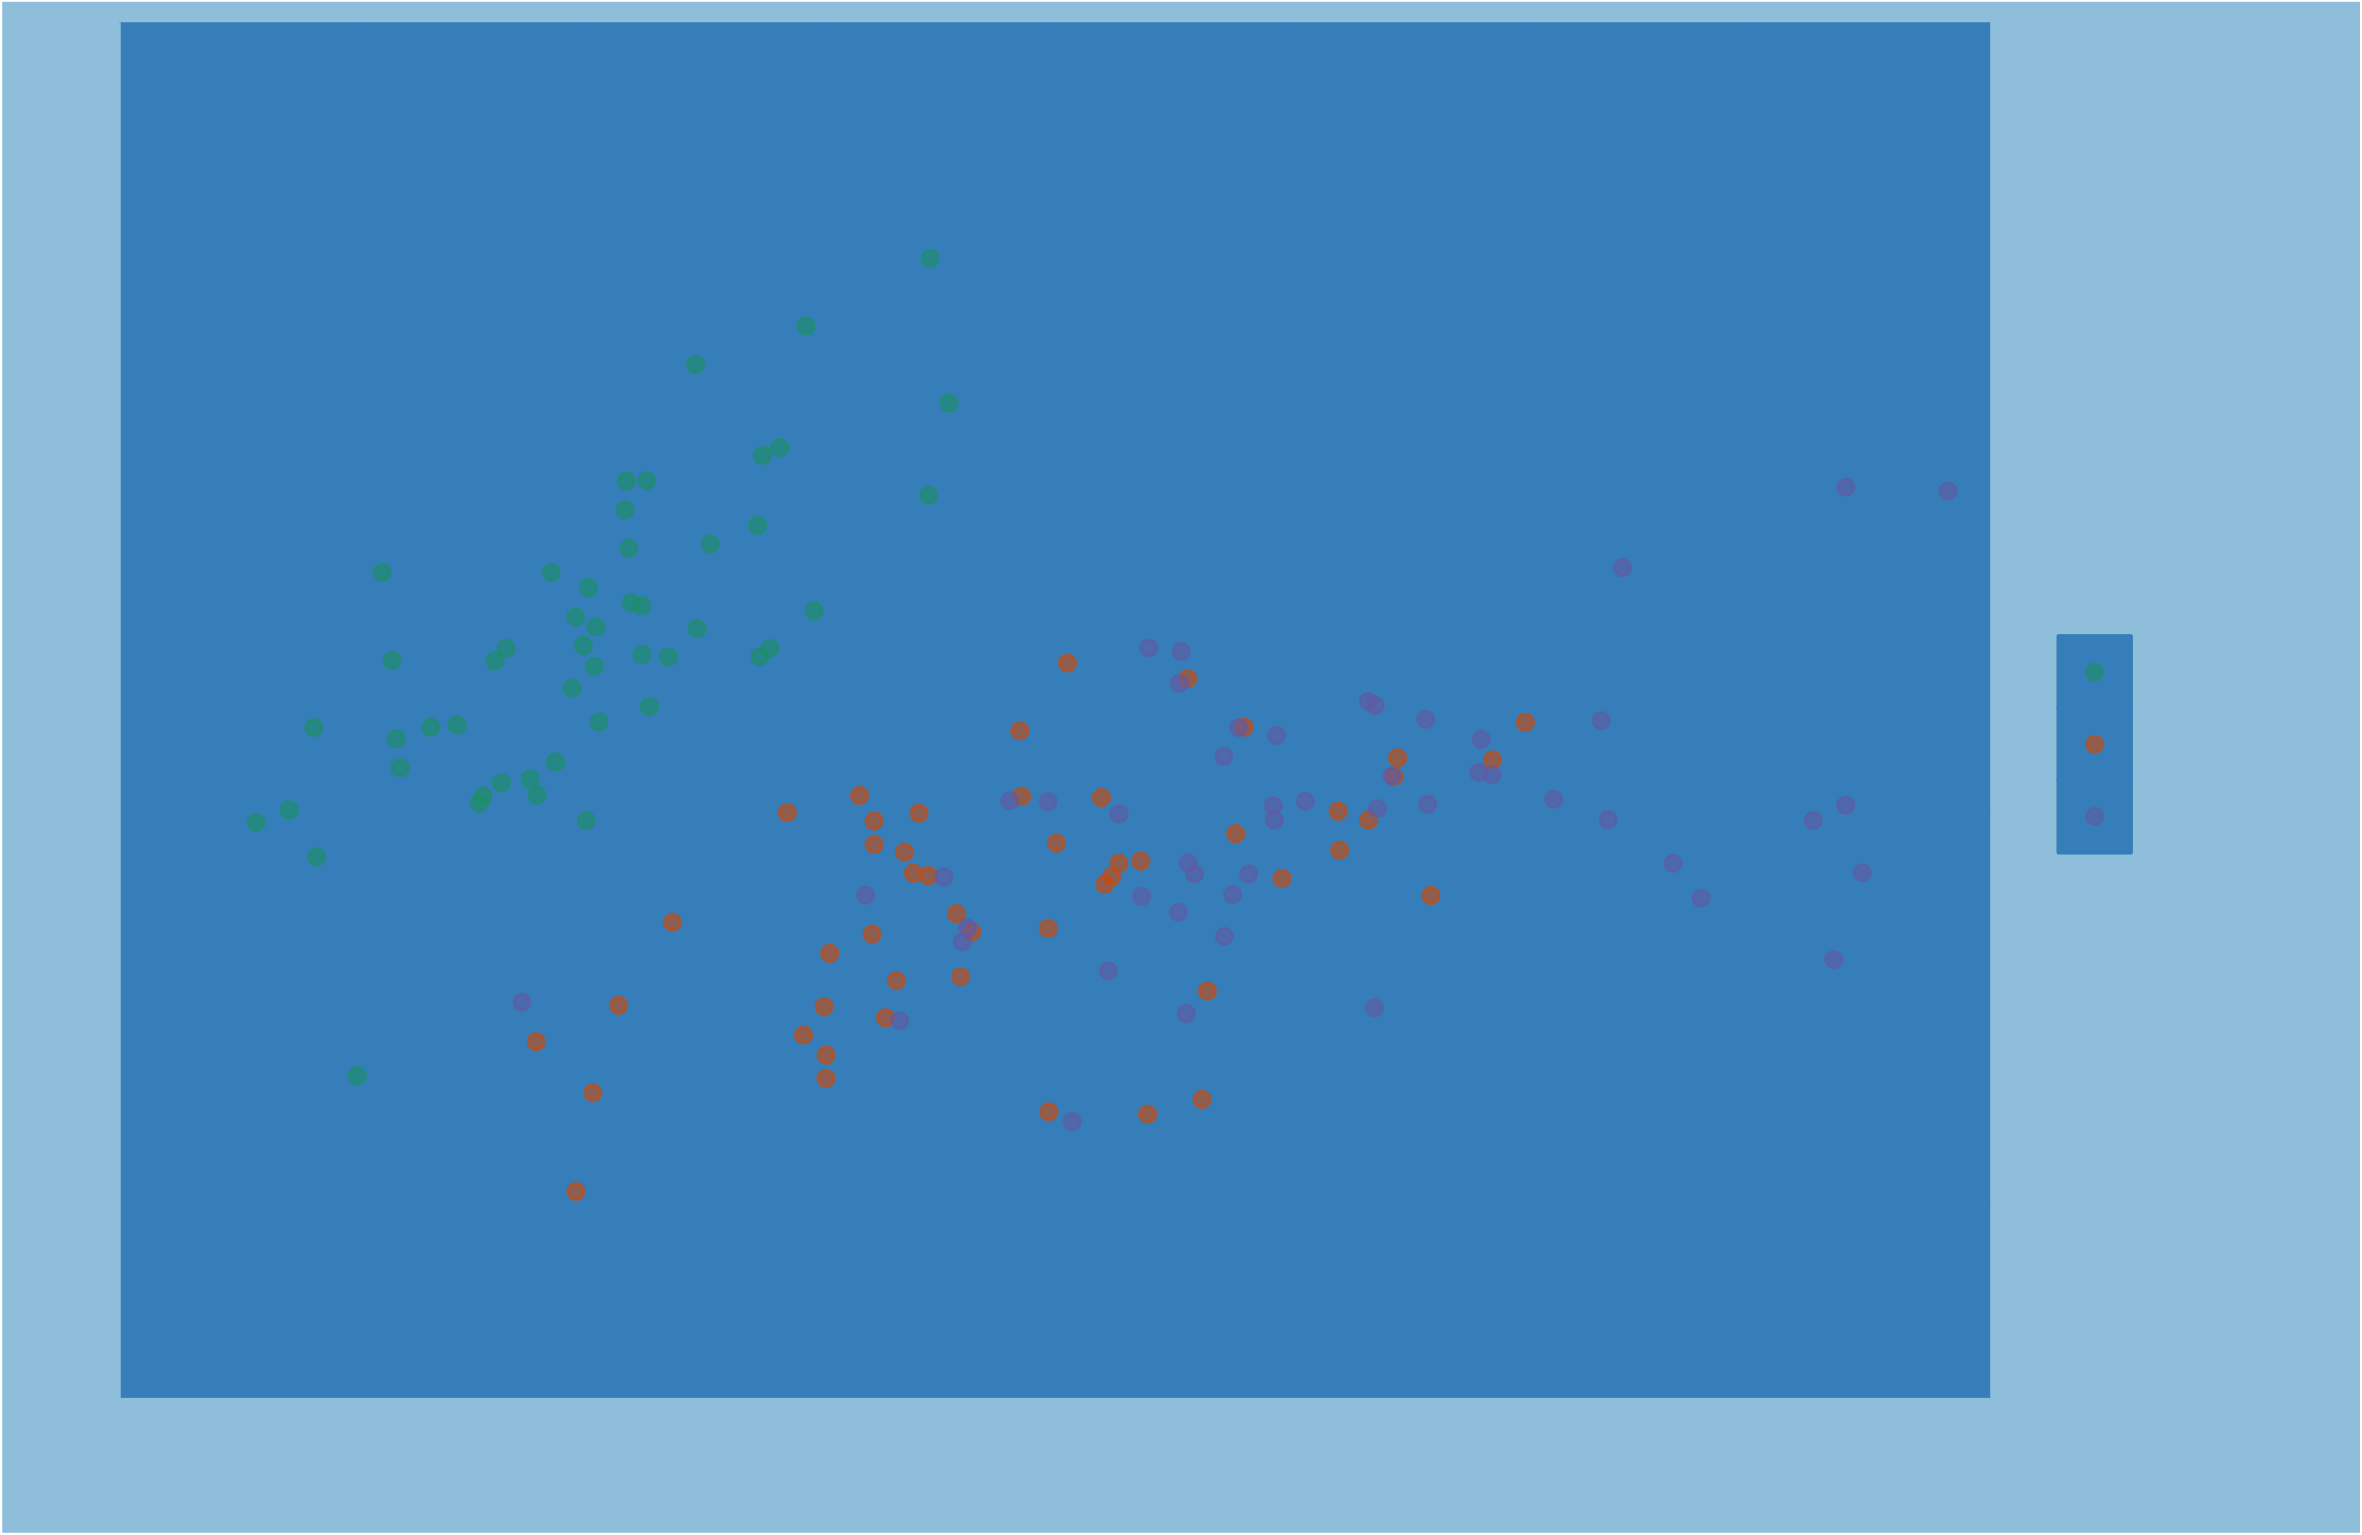
element_blank()
ggplot(iris, aes(x = Sepal.Length, y = Sepal.Width, color = Species)) +
geom_jitter(alpha = 0.6) +
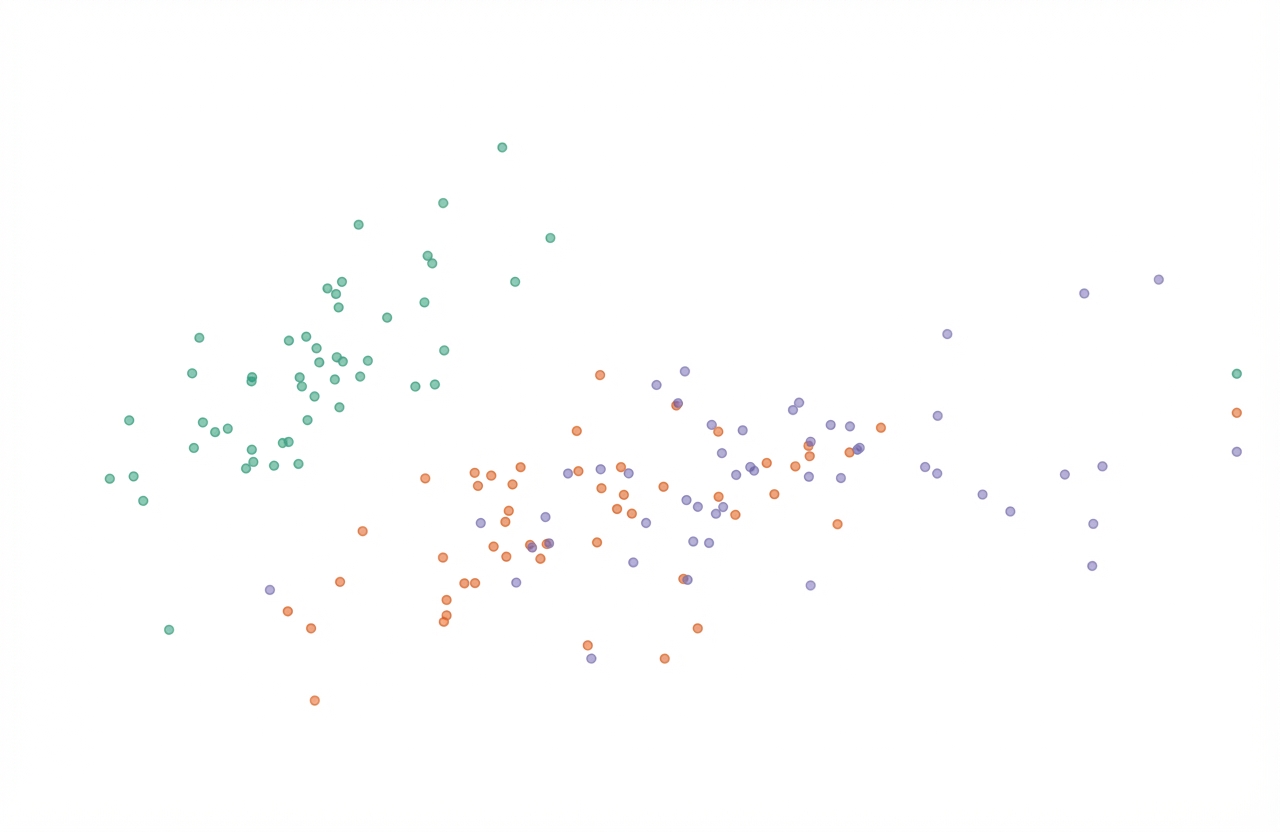
theme(line = element_blank(),
rect = element_blank(),
text = element_blank())