ggplot2-Ebenen
Einführung in die Datenvisualisierung mit ggplot2

Rick Scavetta
Founder, Scavetta Academy
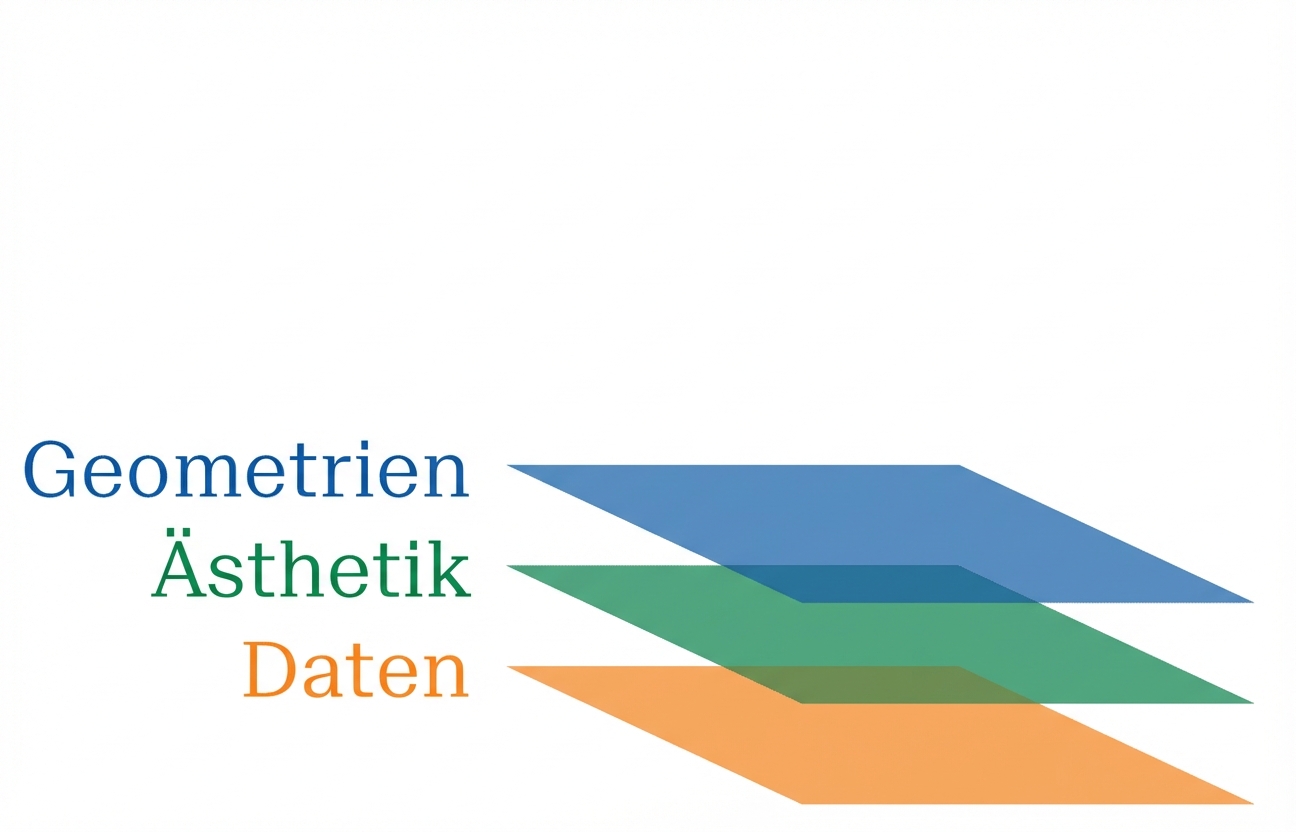
Daten

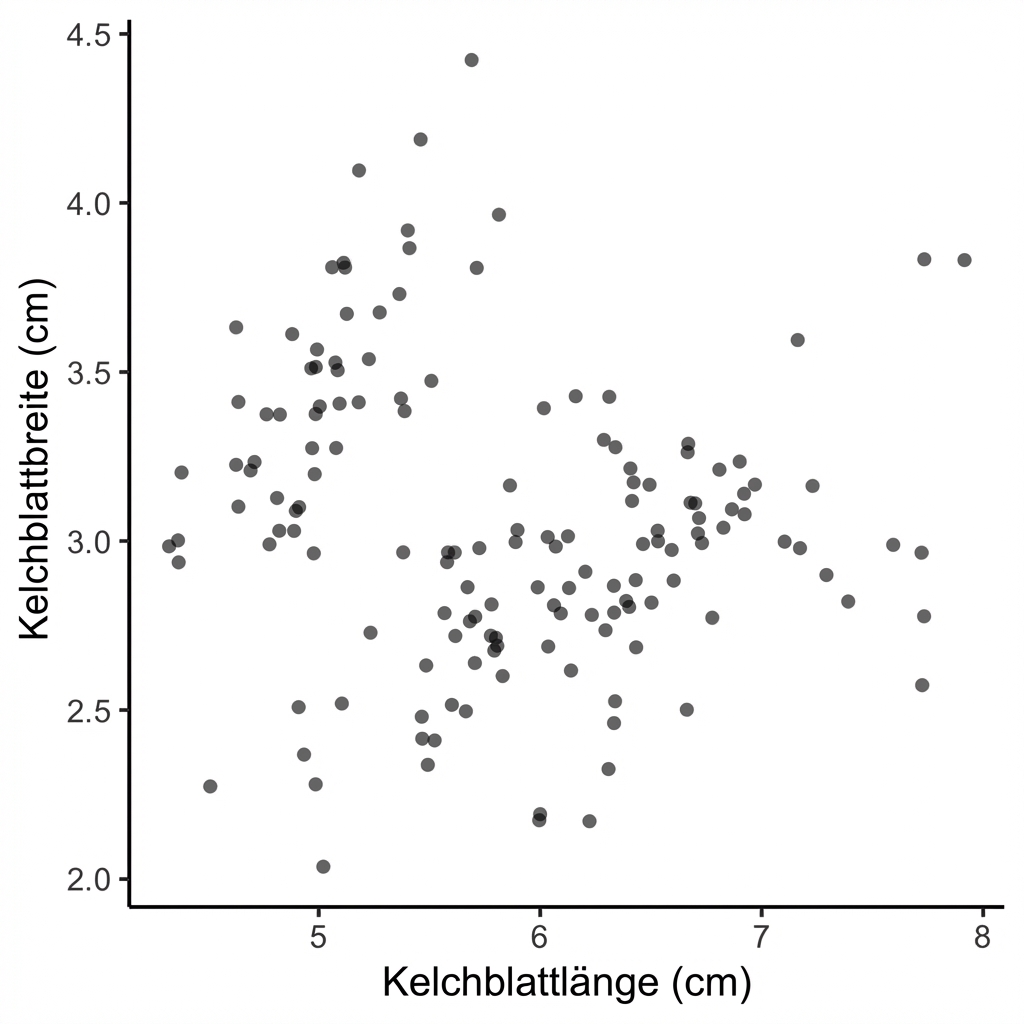
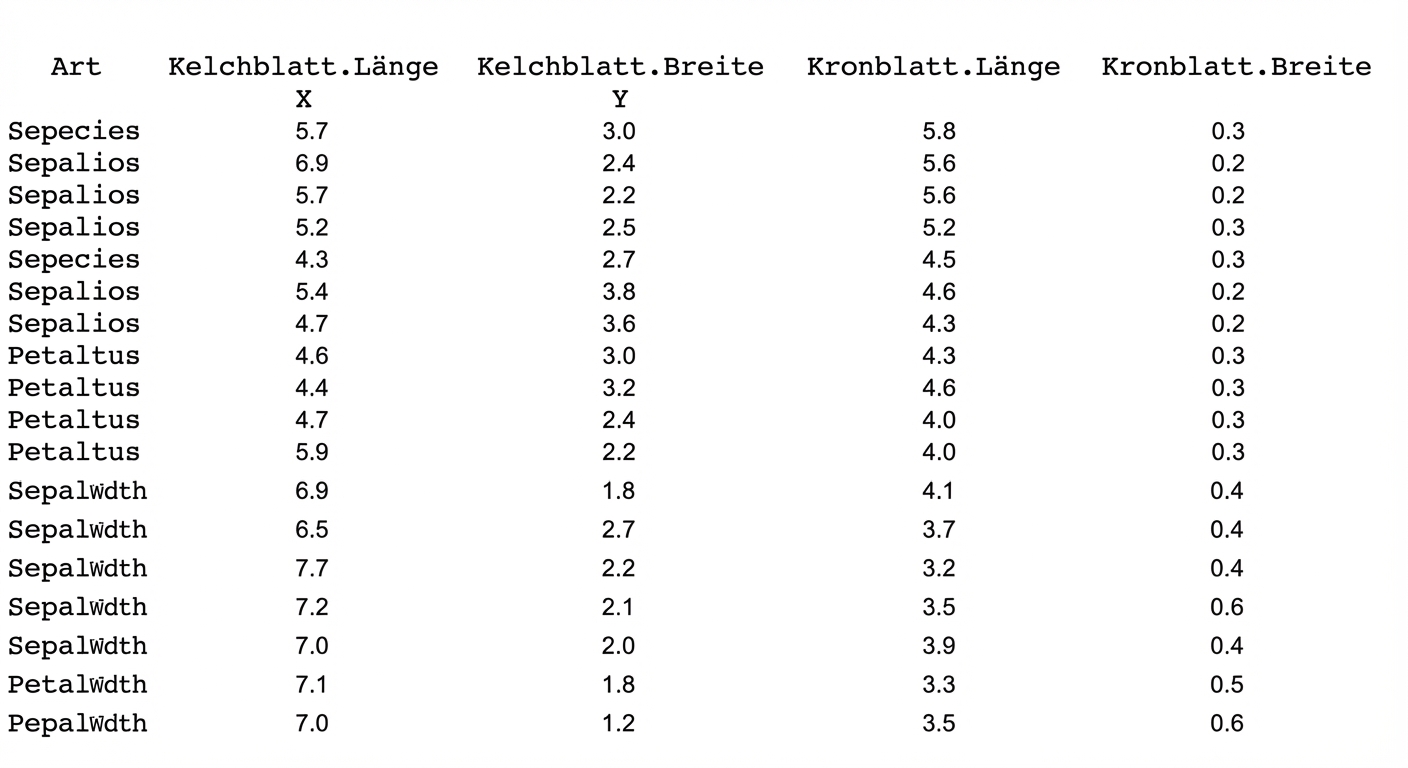
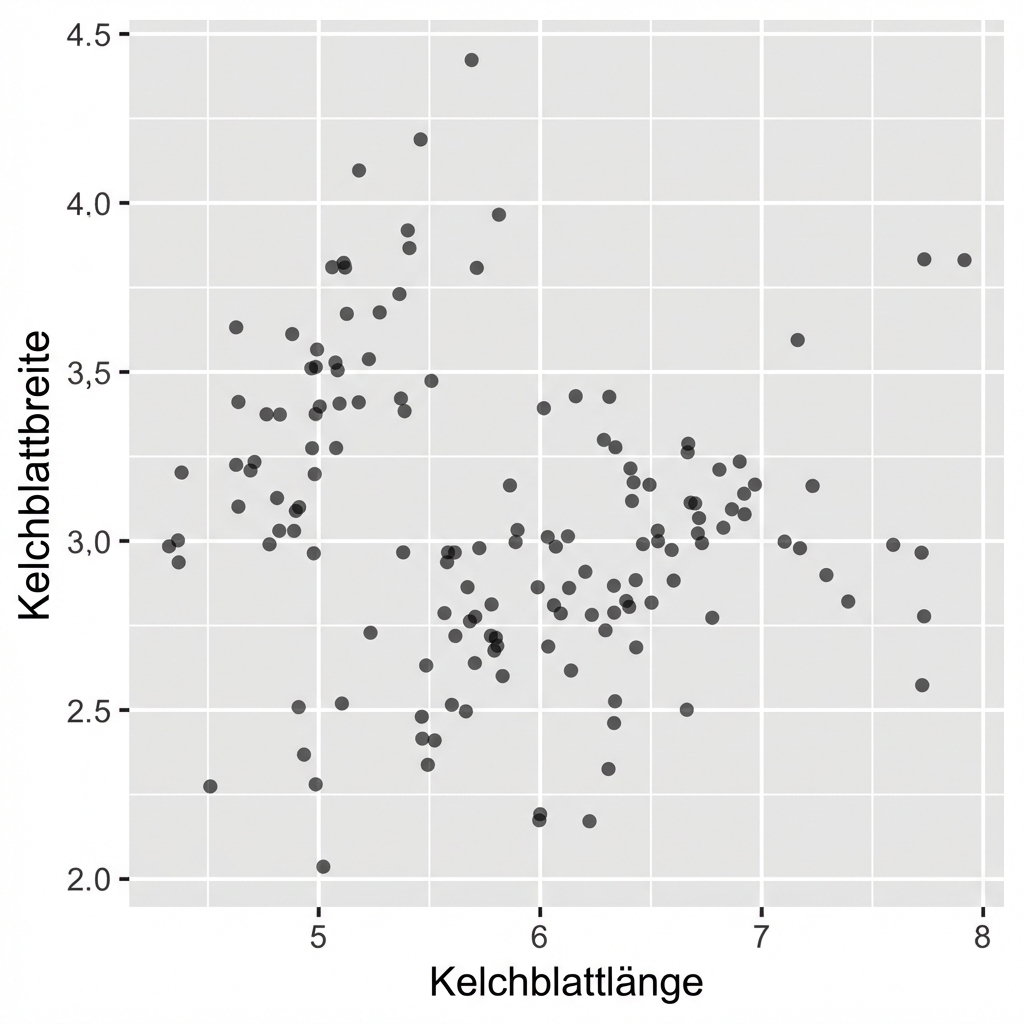
Iris-Datensatz
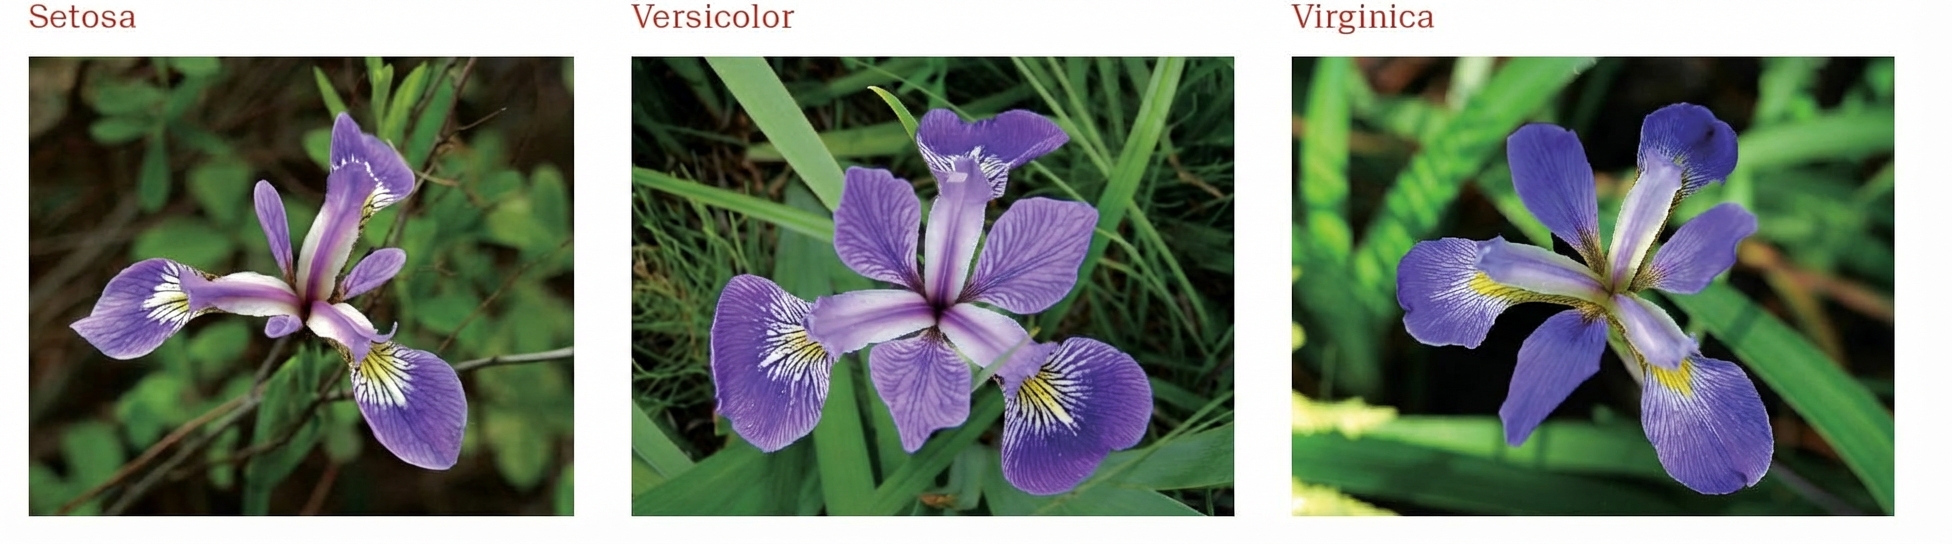
1 Fisher, R. A. (1936) The use of multiple measurements in taxonomic problems. Annals of Eugenics, 7, Part II, 179-188. 2 Anderson, Edgar (1935). The irises of the Gaspe Peninsula, Bulletin of the American Iris Society, 59, 2-5.
Ästhetische Elemente

Iris-Ästhetik
Geometrien
Iris-Geometrien
Themen

Iris-Themes