Die Normalverteilung
Einführung in die Statistik in Python

Maggie Matsui
Content Developer, DataCamp
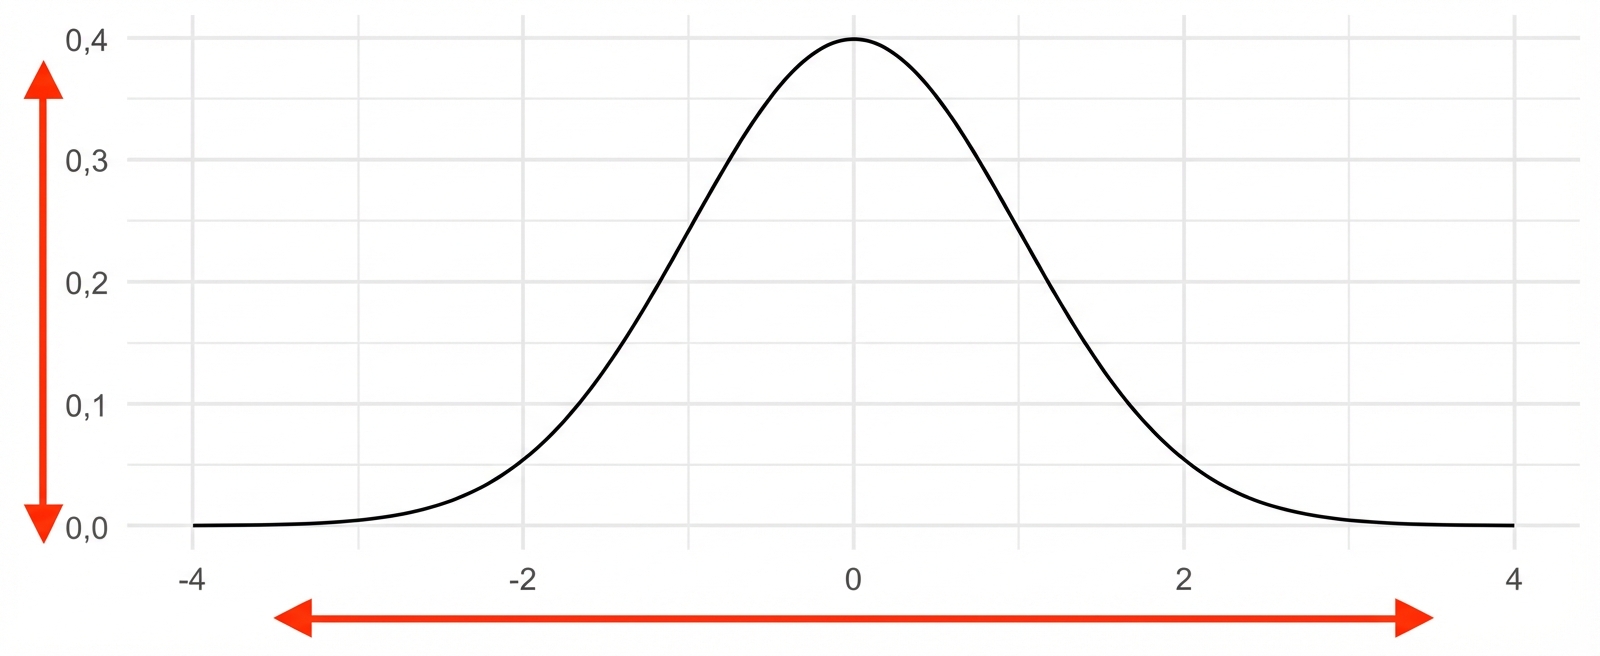
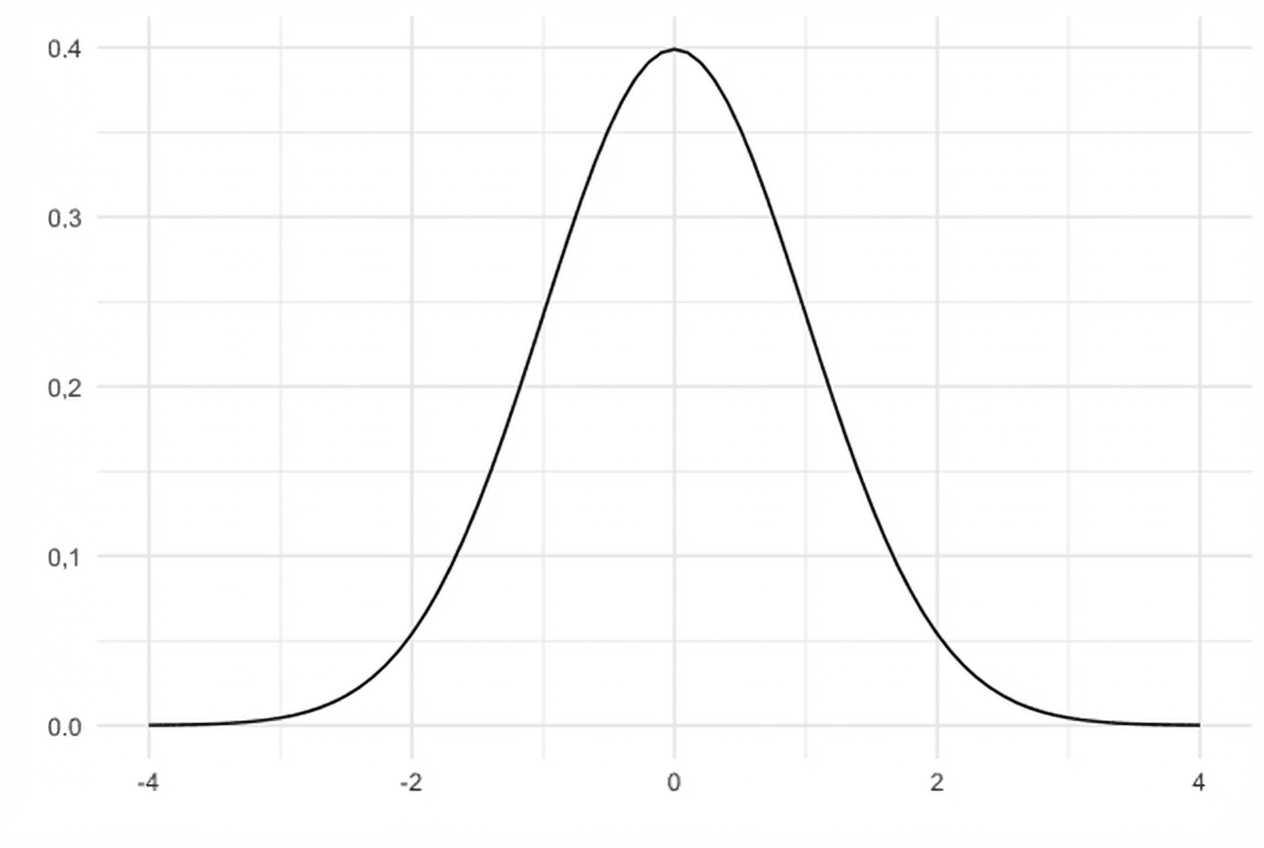
Was ist die Normalverteilung?
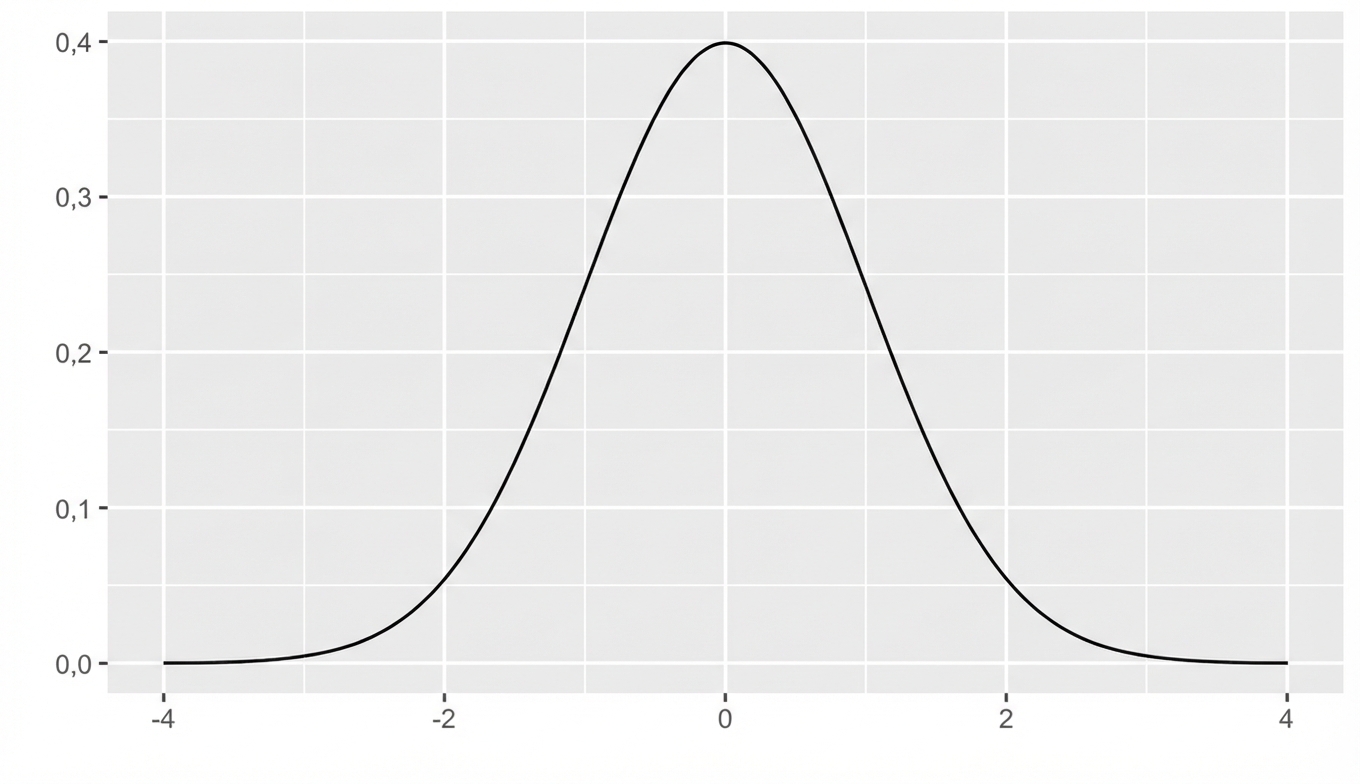
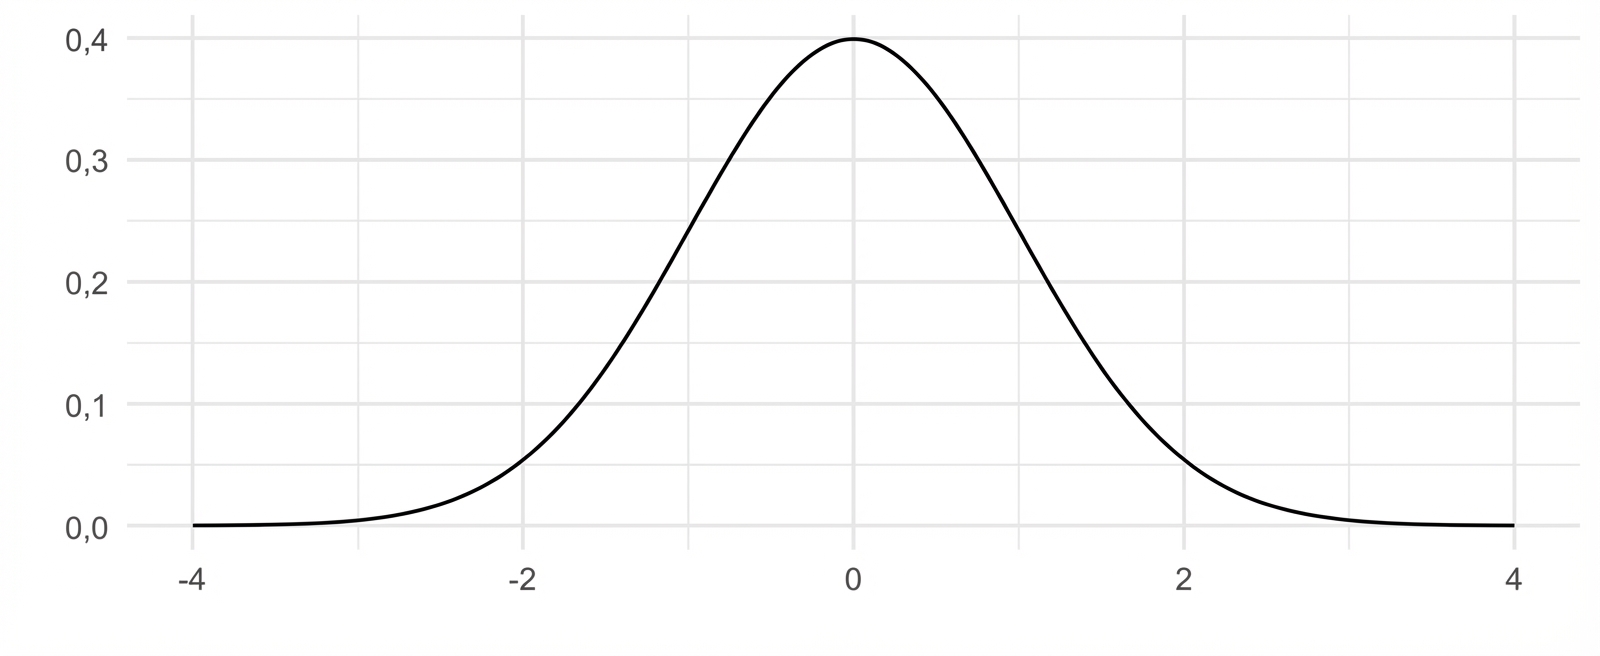
Symmetrisch
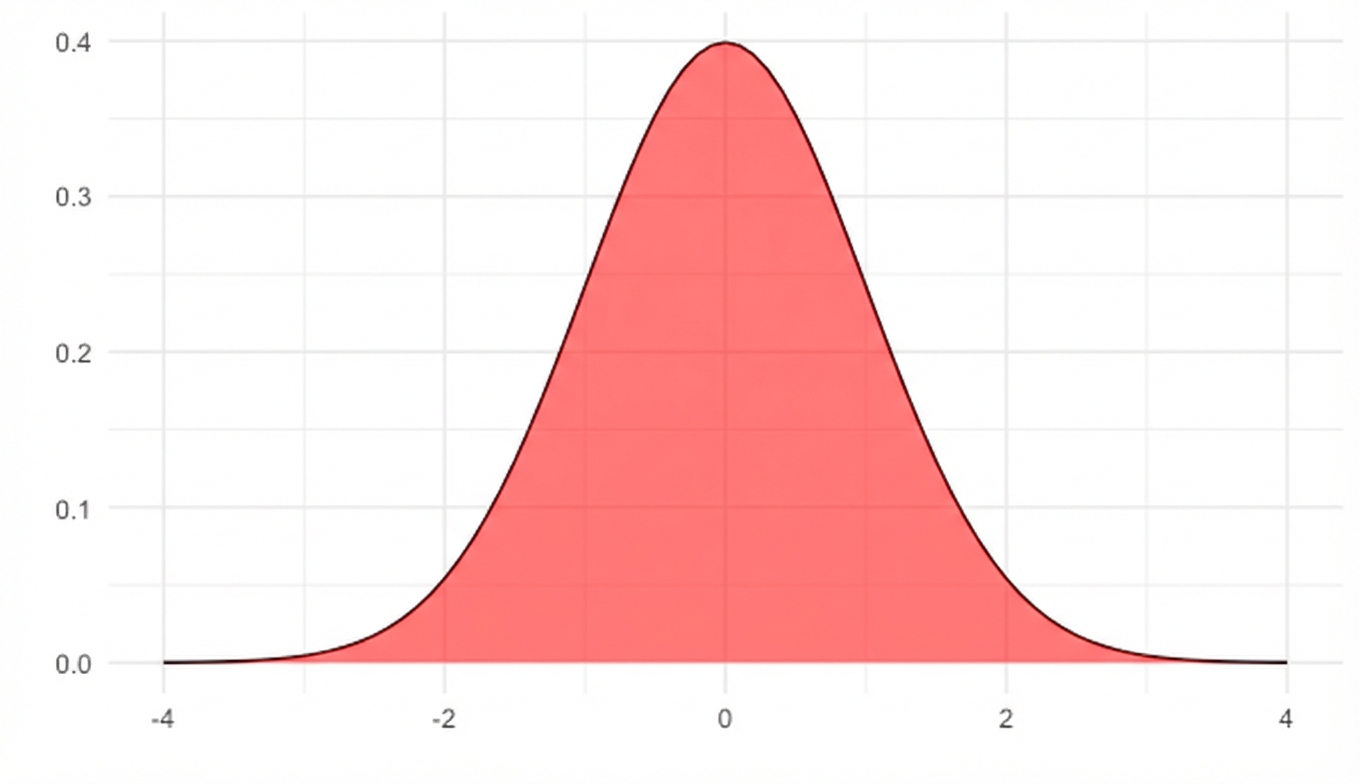
Fläche = 1
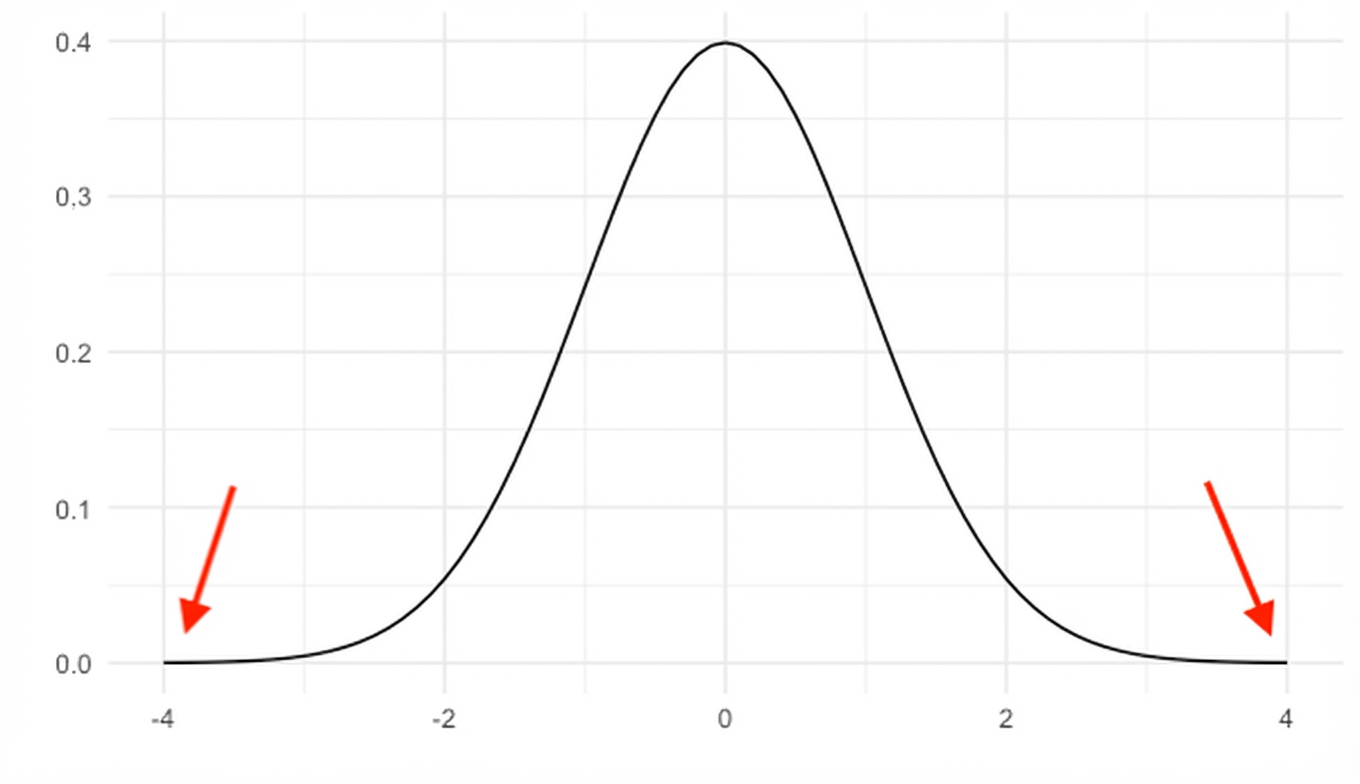
Kurve trifft niemals 0
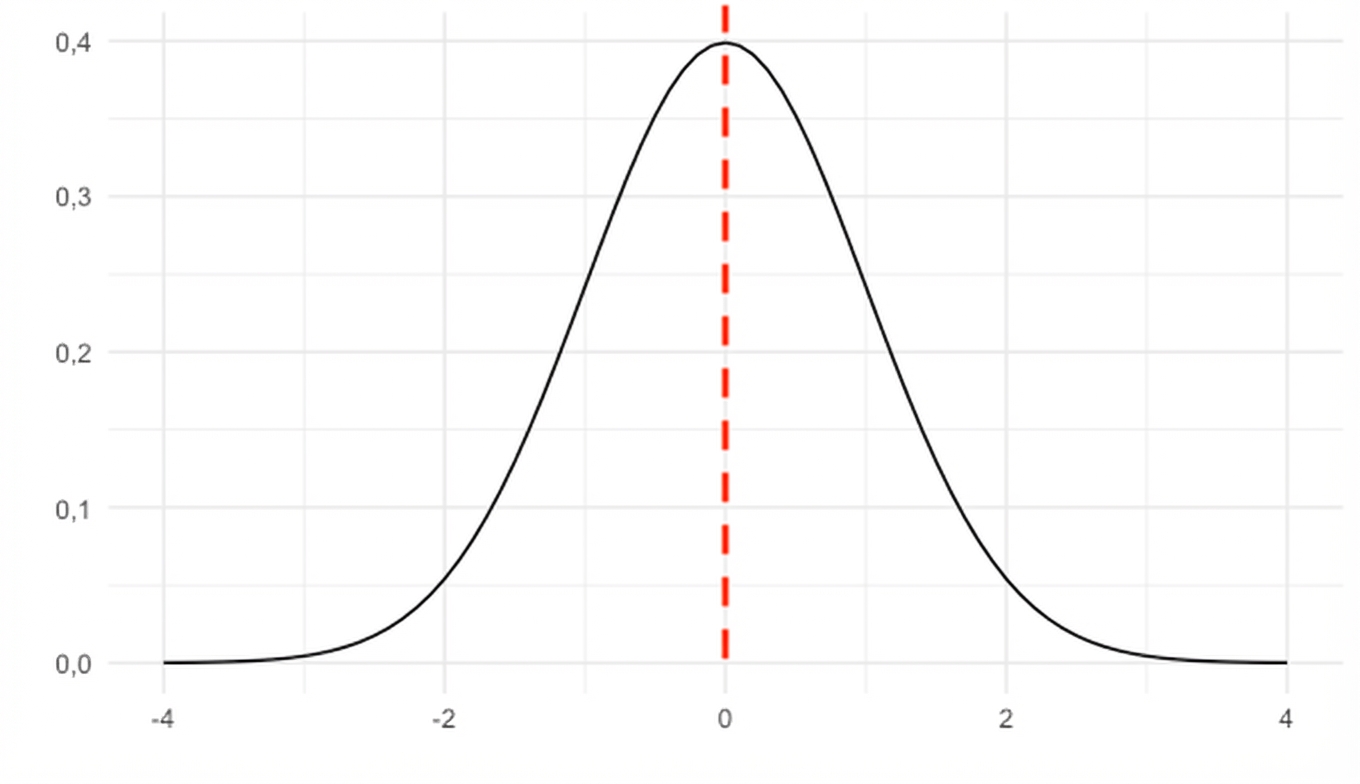
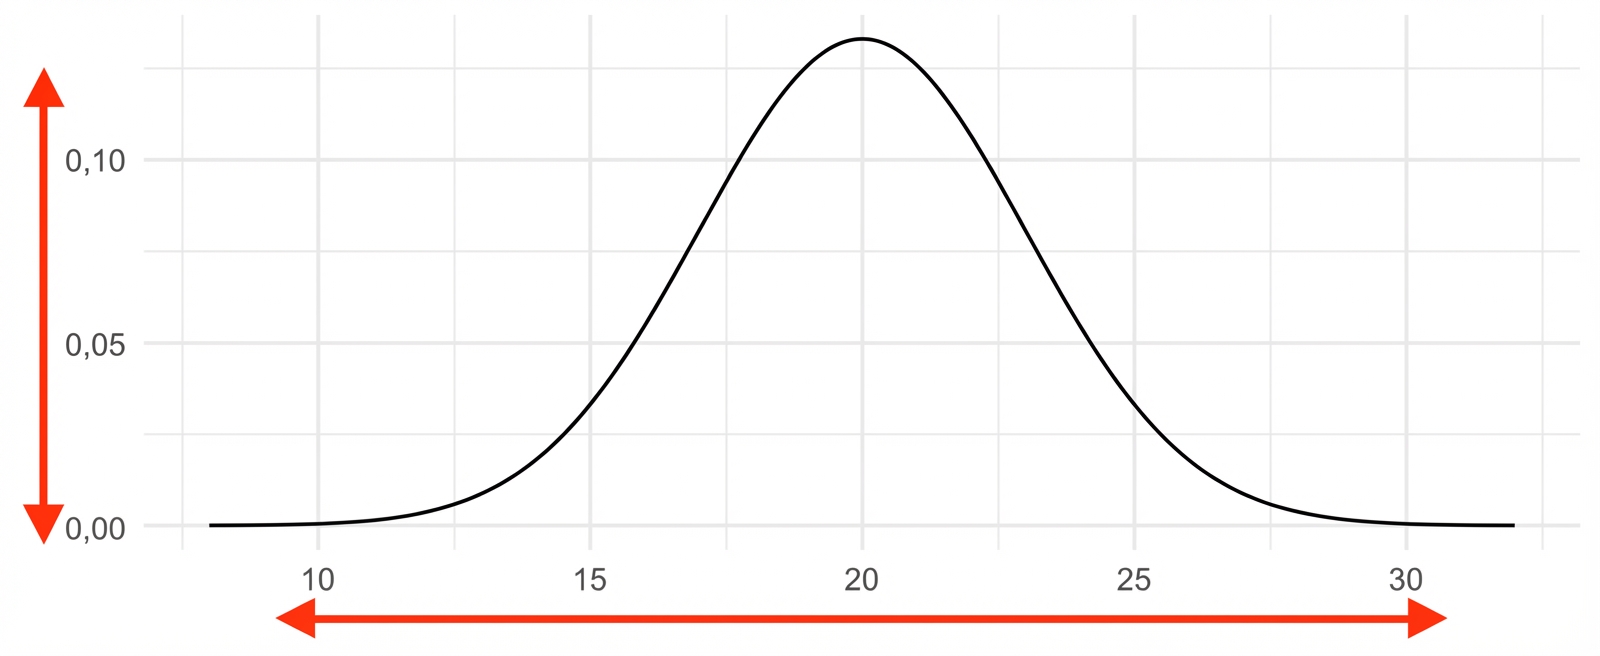
Beschrieben durch Mittelwert und Standardabweichung
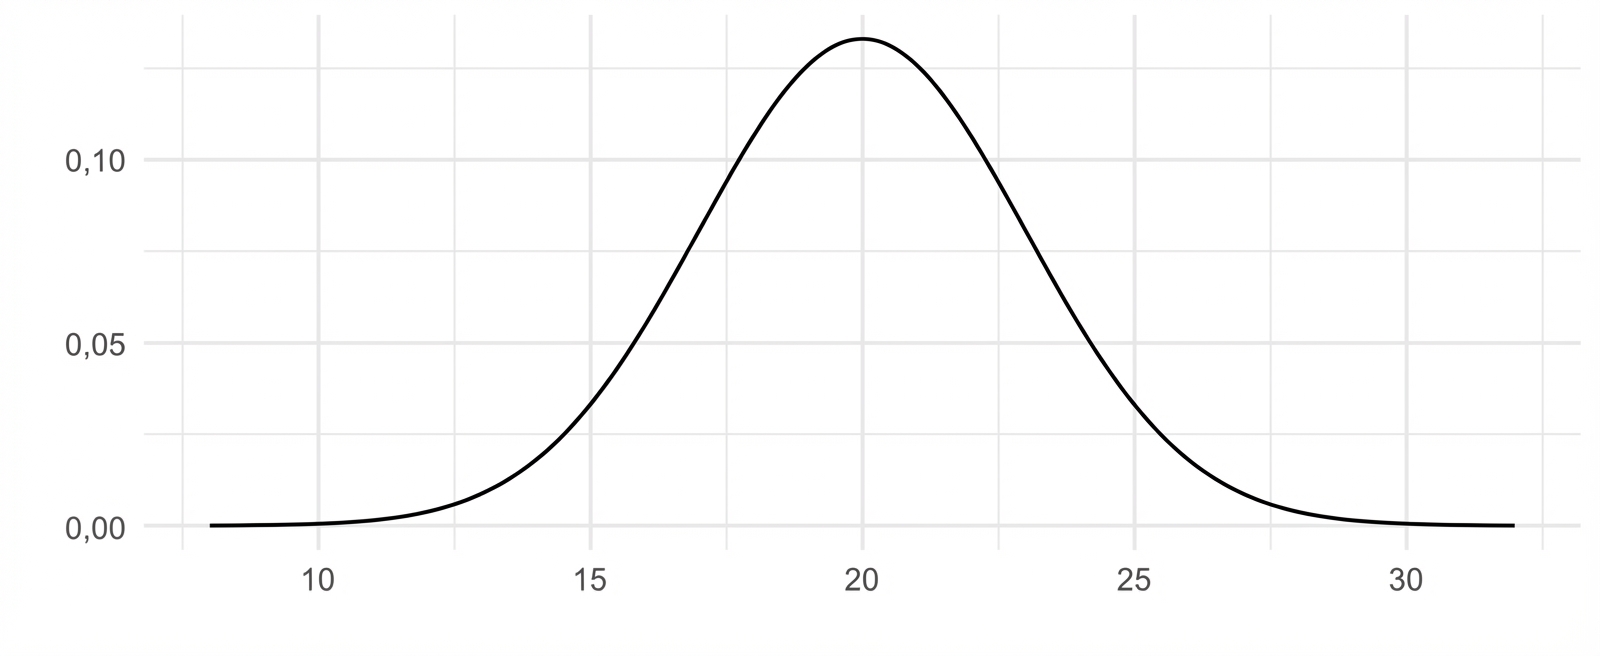
Beschrieben durch Mittelwert und Standardabweichung
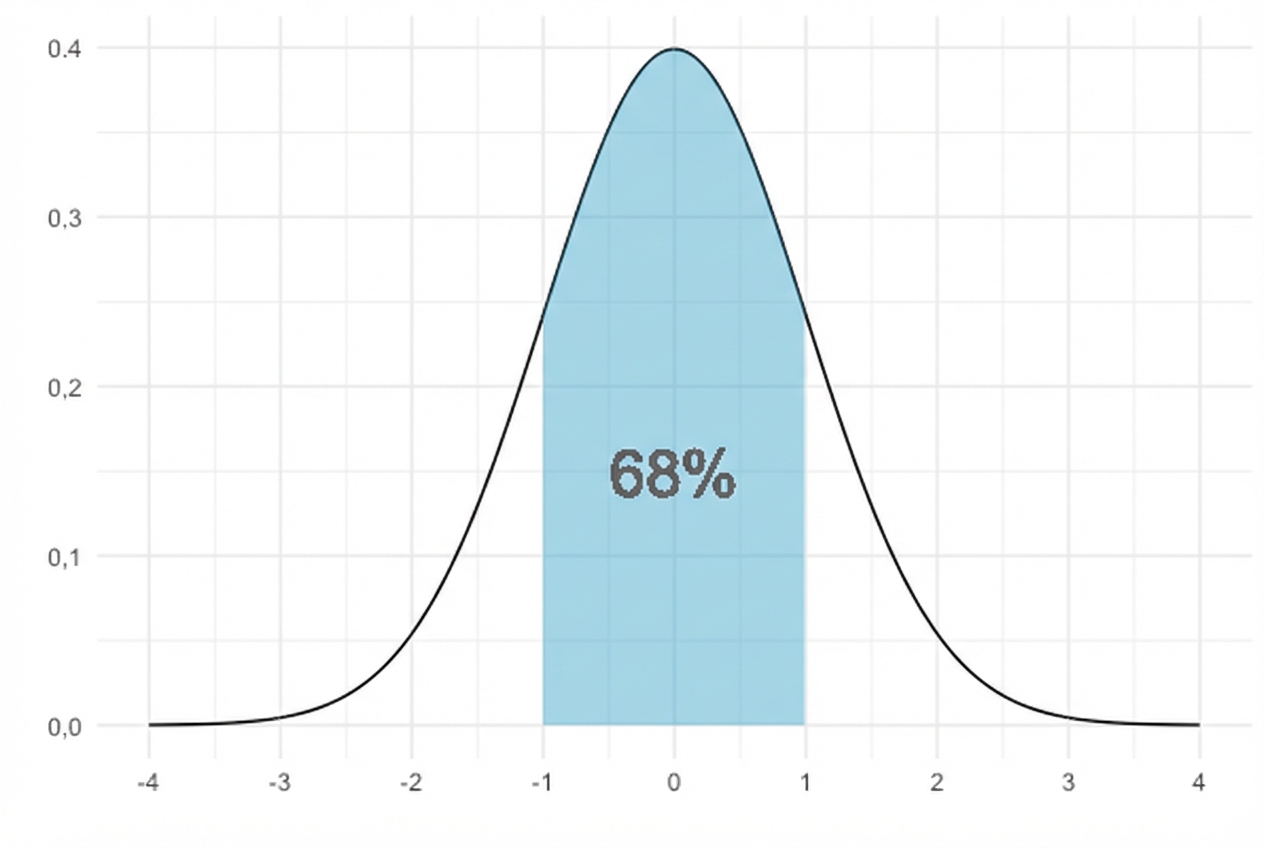
Flächen unterhalb der Normalverteilungskurve
68 % liegt innerhalb von 1 Standardabweichung
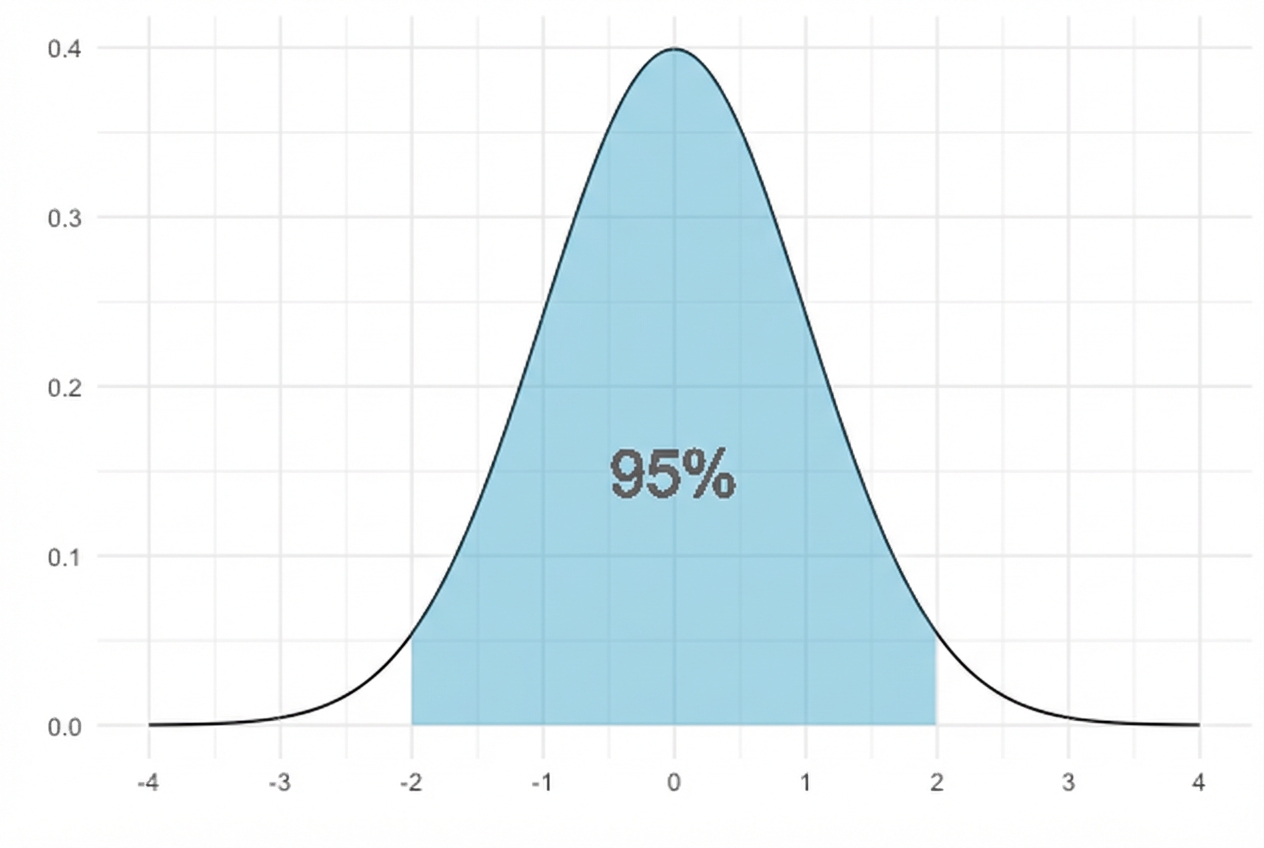
Flächen unterhalb der Normalverteilungskurve
95% liegt innerhalb von 2 Standardabweichungen
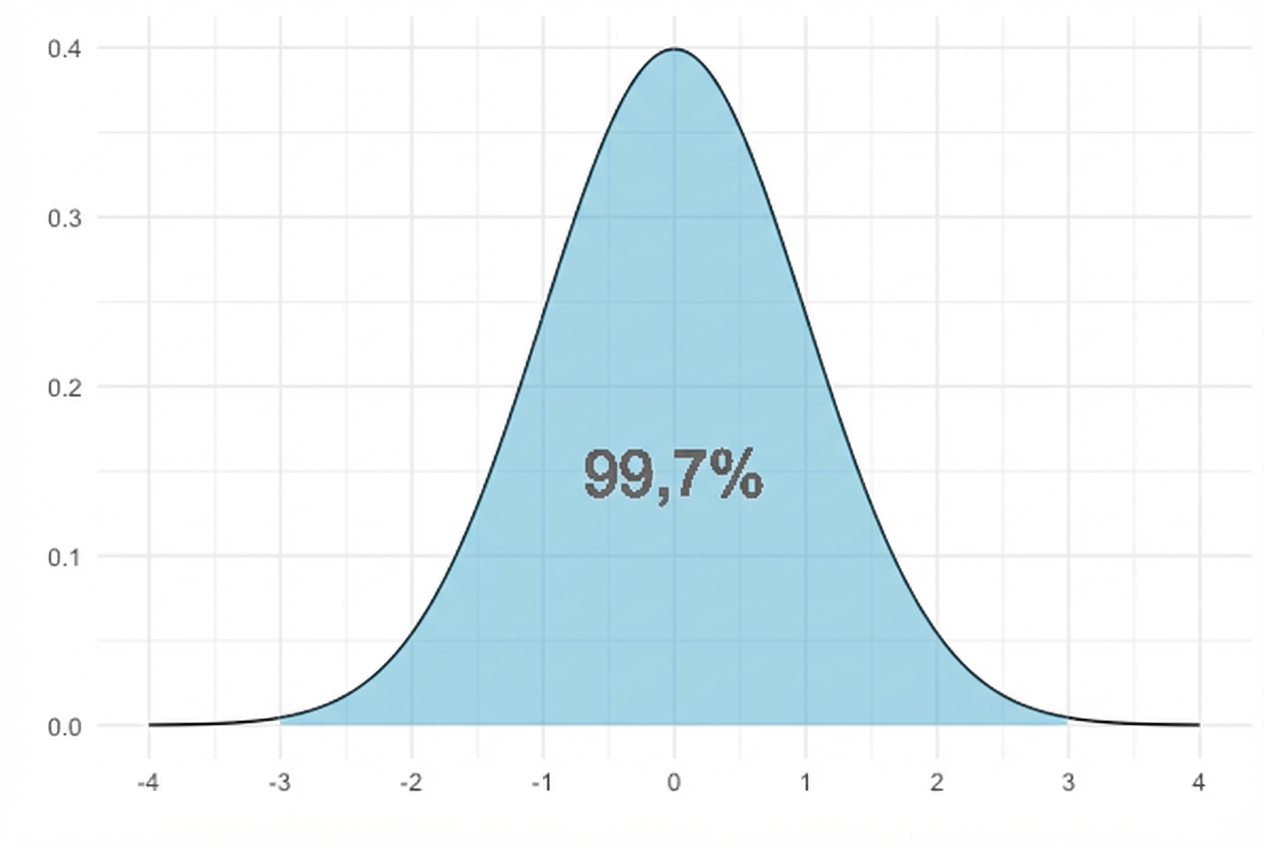
Flächen unterhalb der Normalverteilungskurve
99,7% liegen innerhalb von 3 Standardabweichungen
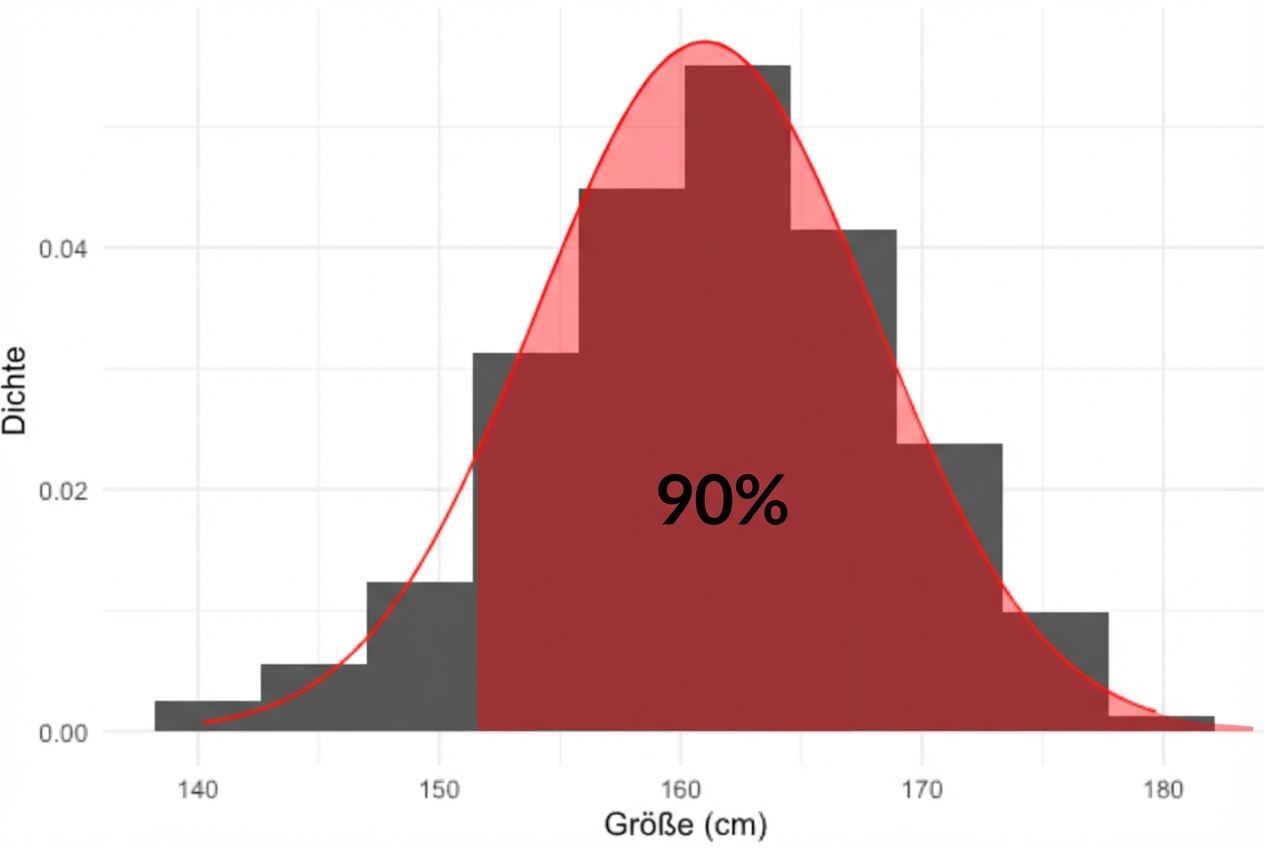
Viele Histogramme sehen wie Normalverteilungen aus
Normalverteilung
Körpergrößen von Frauen aus NHANES
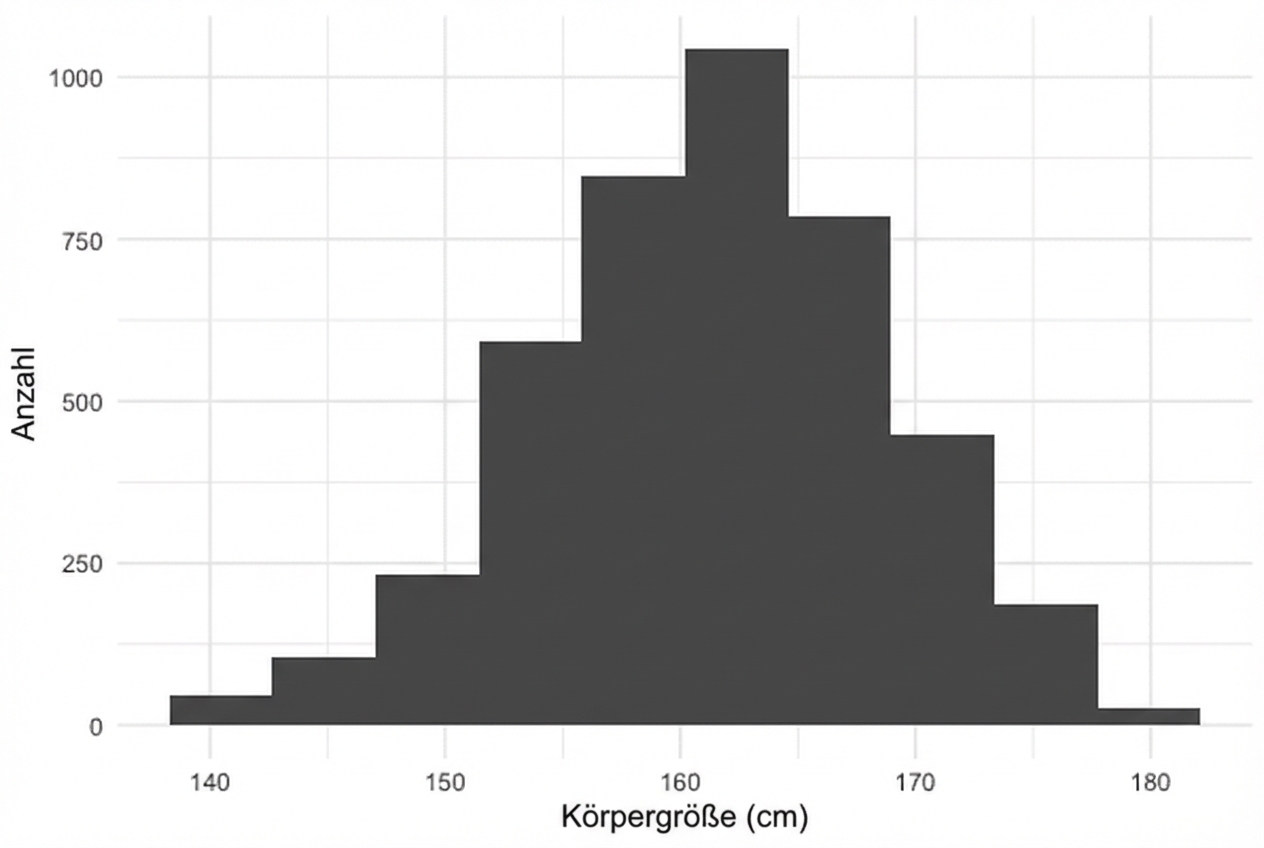
Mittelwert: 161 cm Standardabweichung: 7 cm
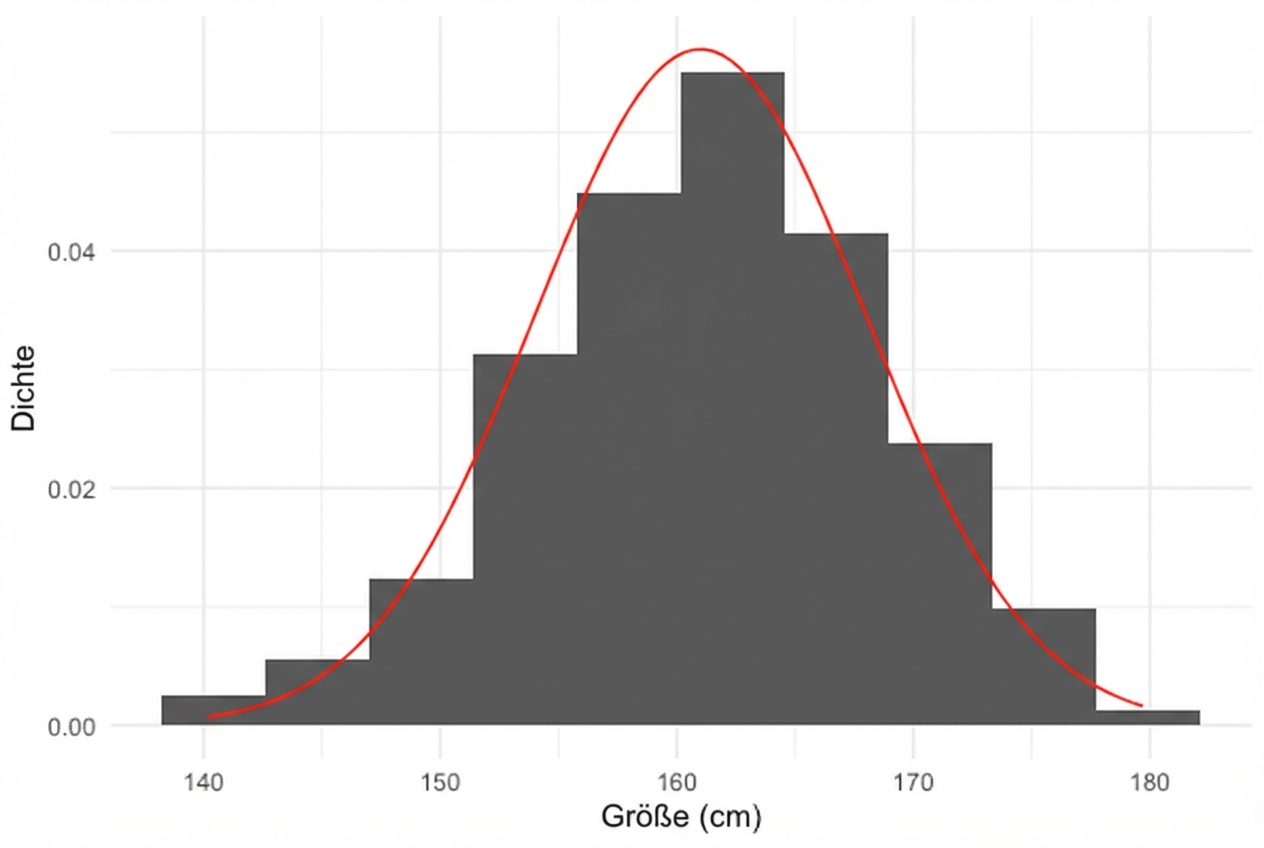
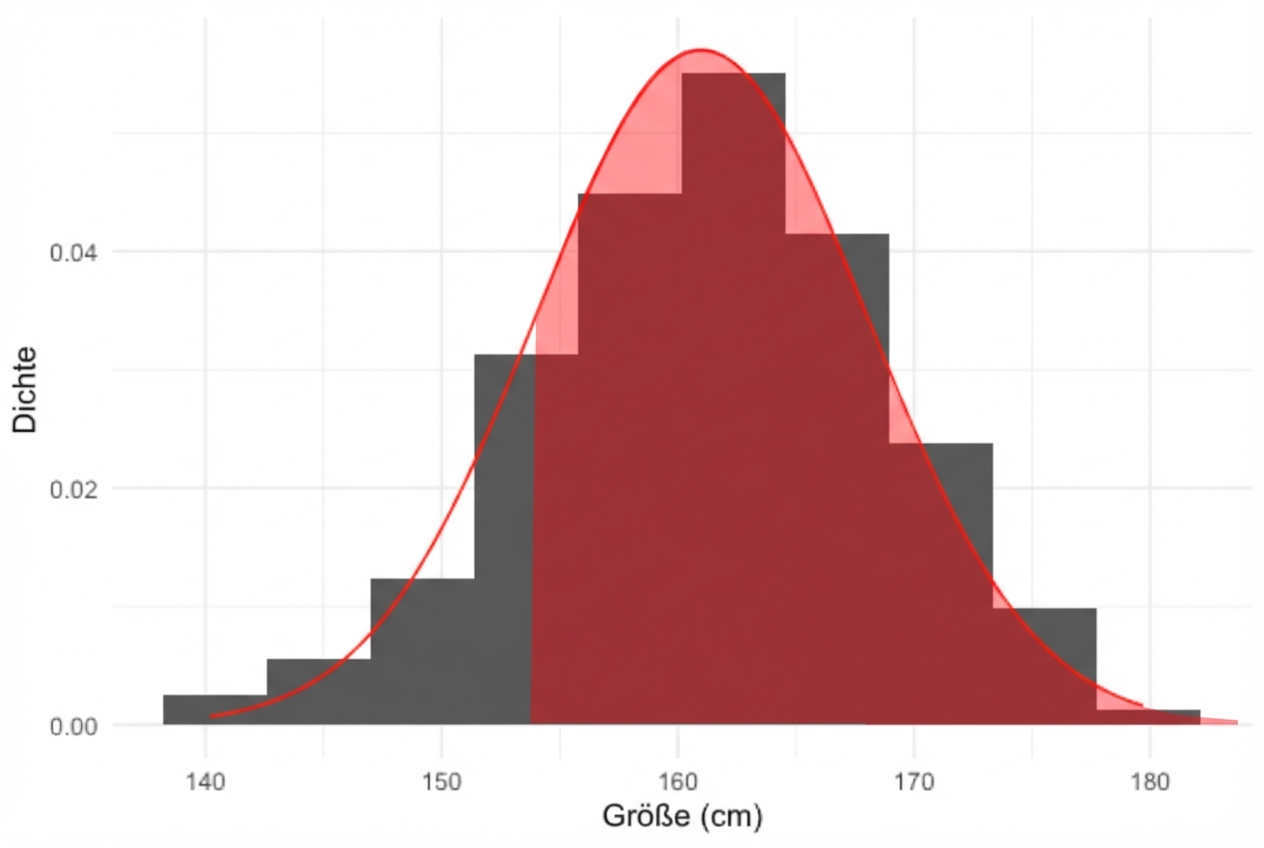
Annäherung der Daten mit der Normalverteilung
Wie viel Prozent der Frauen sind kleiner als 154 cm?
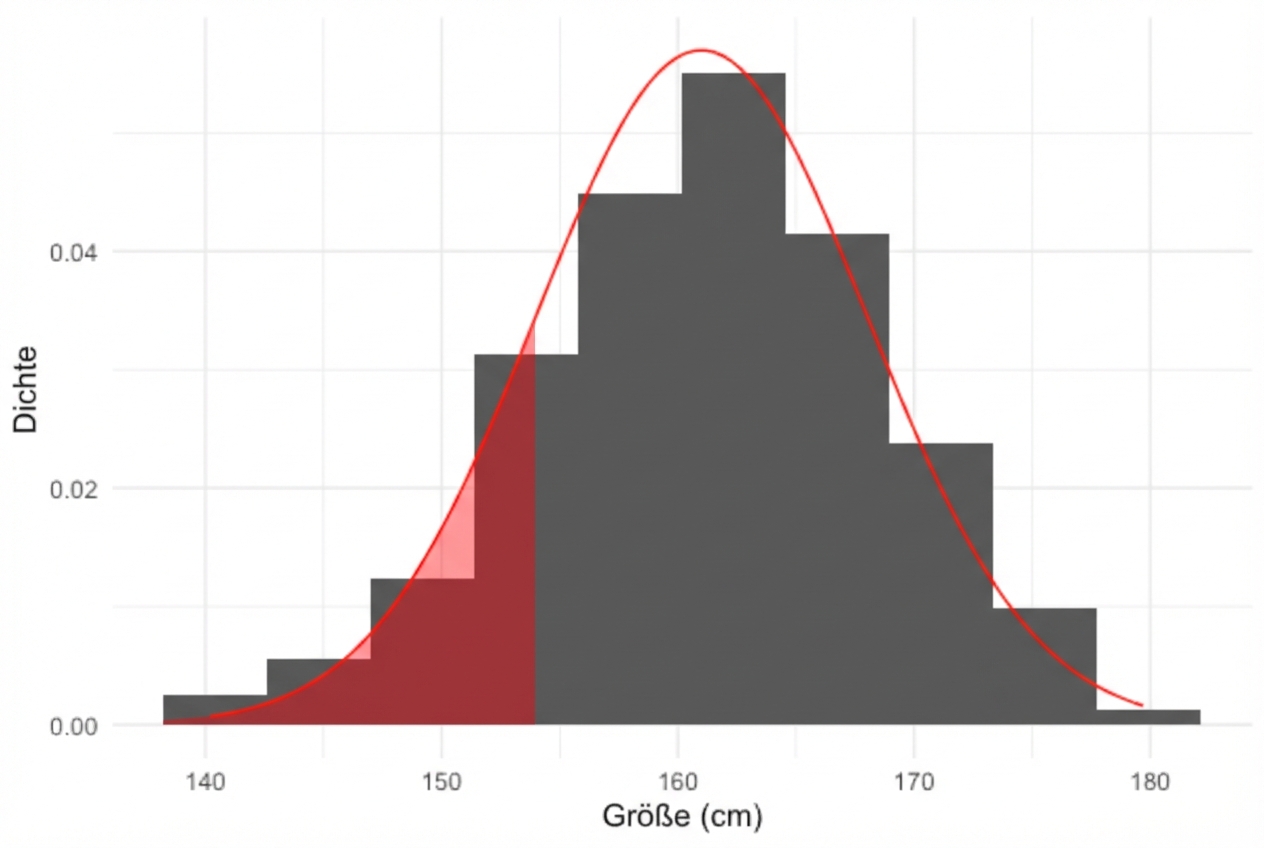
16 % der Frauen in der Umfrage sind kleiner als 154 cm
Wie viel Prozent der Frauen sind größer als 154 cm?
Wie viel Prozent der Frauen sind 154-157 cm groß?
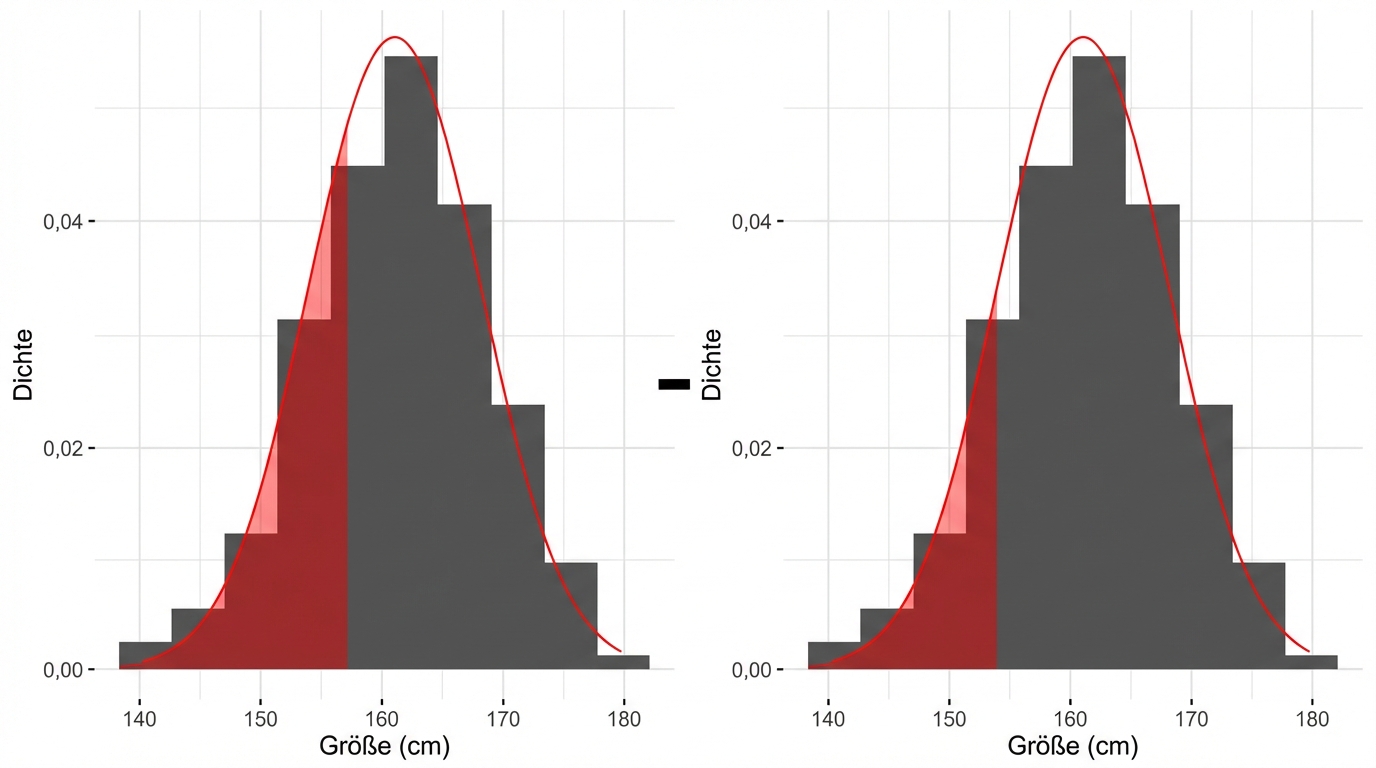
norm.cdf(157, 161, 7) - norm.cdf(154, 161, 7)
Wie viel Prozent der Frauen sind 154-157 cm groß?
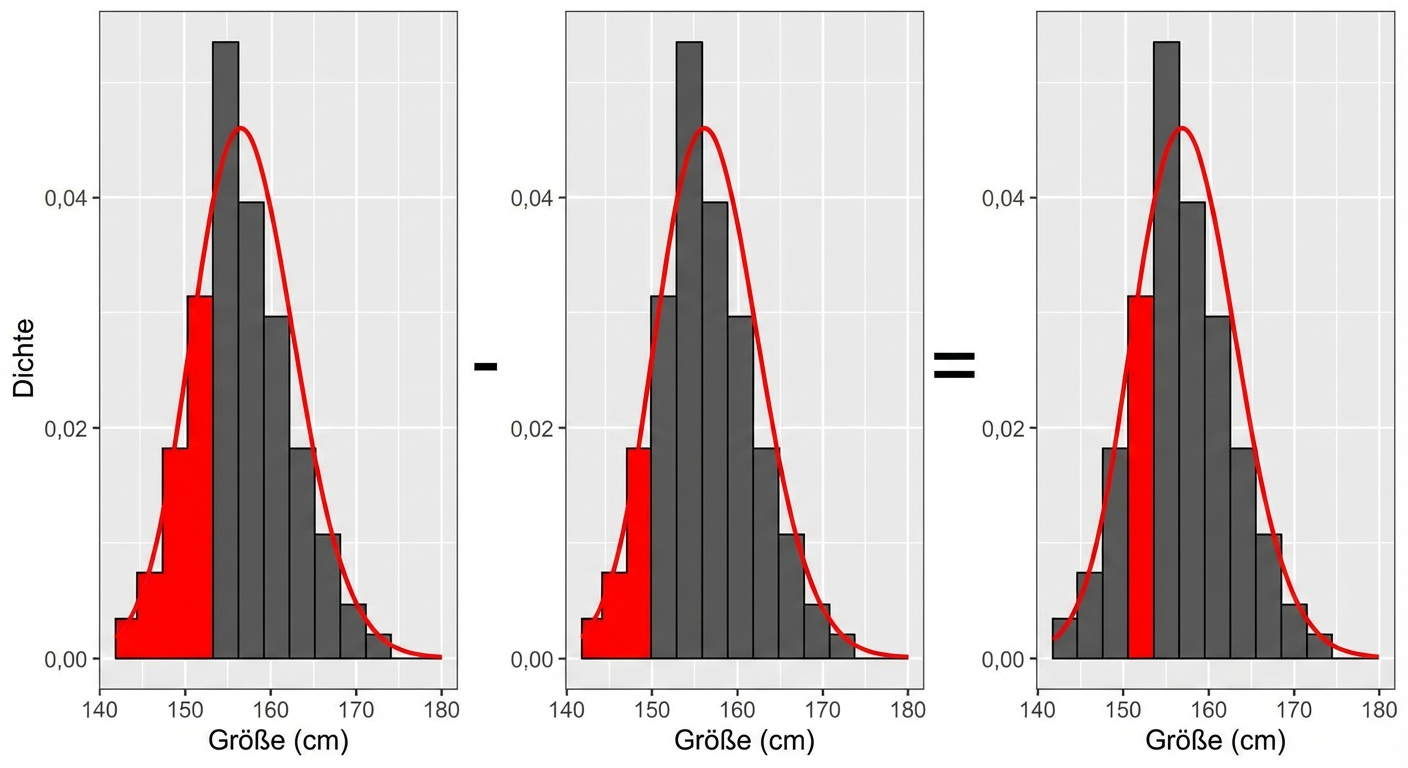
norm.cdf(157, 161, 7) - norm.cdf(154, 161, 7)
0.1252
Wie groß sind 90 % der Frauen, die kleiner sind?
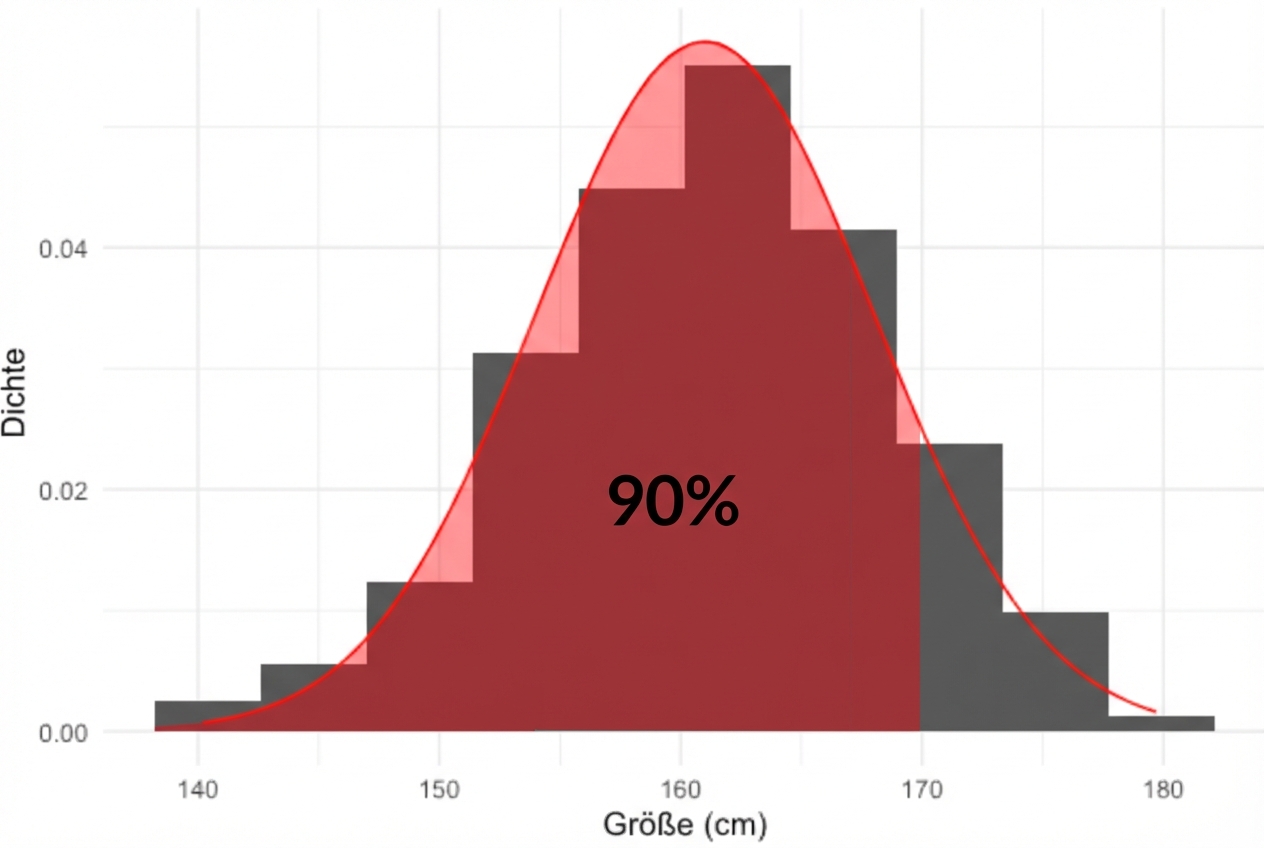
Wie groß sind 90 % der Frauen, die größer sind?