Liniendiagramme
Einführung in das Tidyverse

David Robinson
Chief Data Scientist, DataCamp
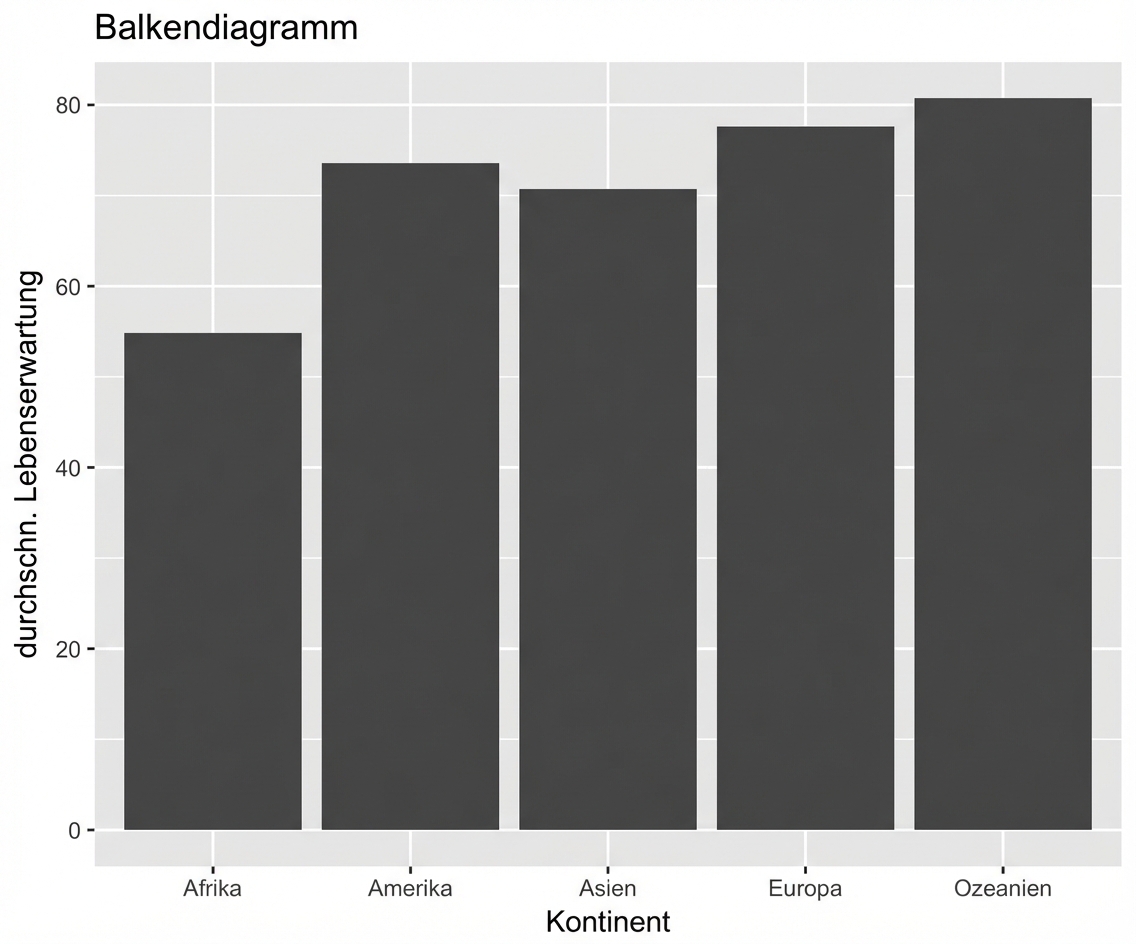
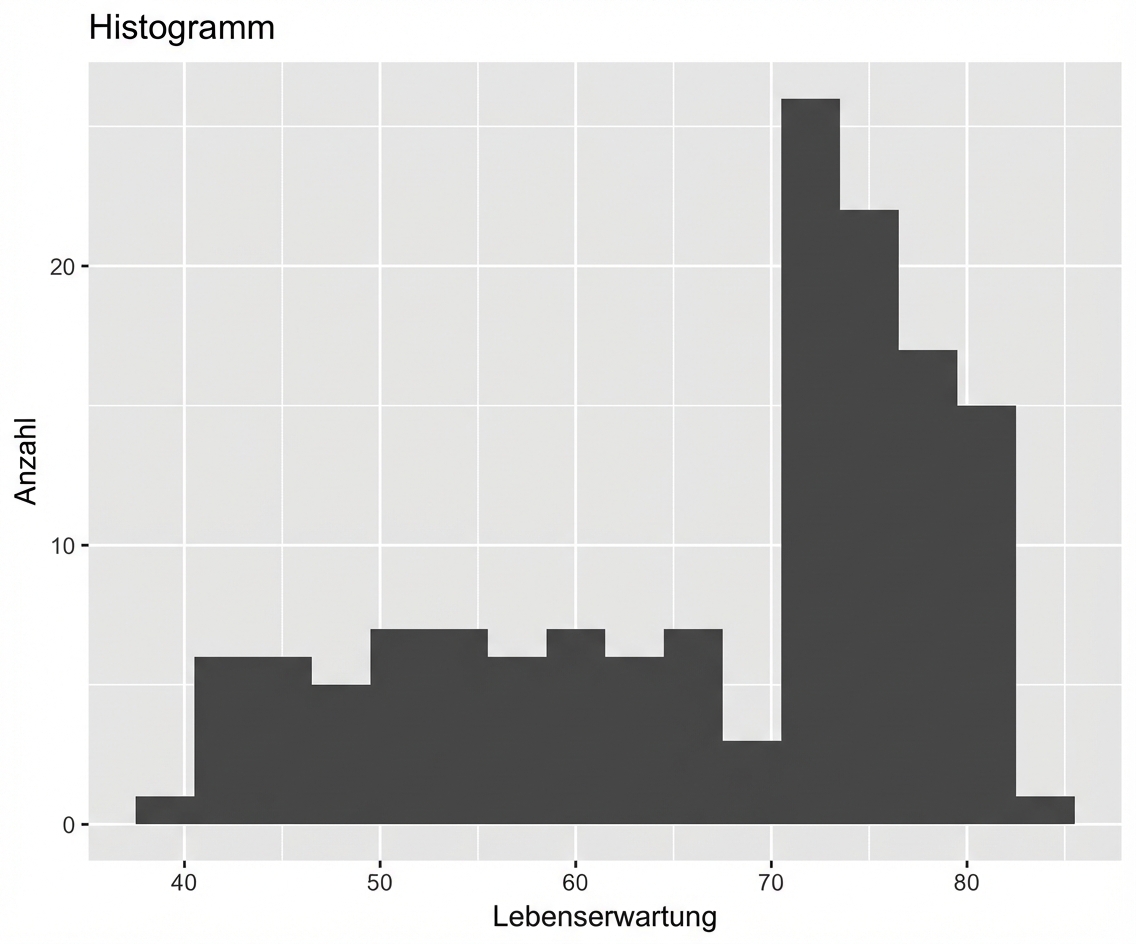
Arten von Diagrammen
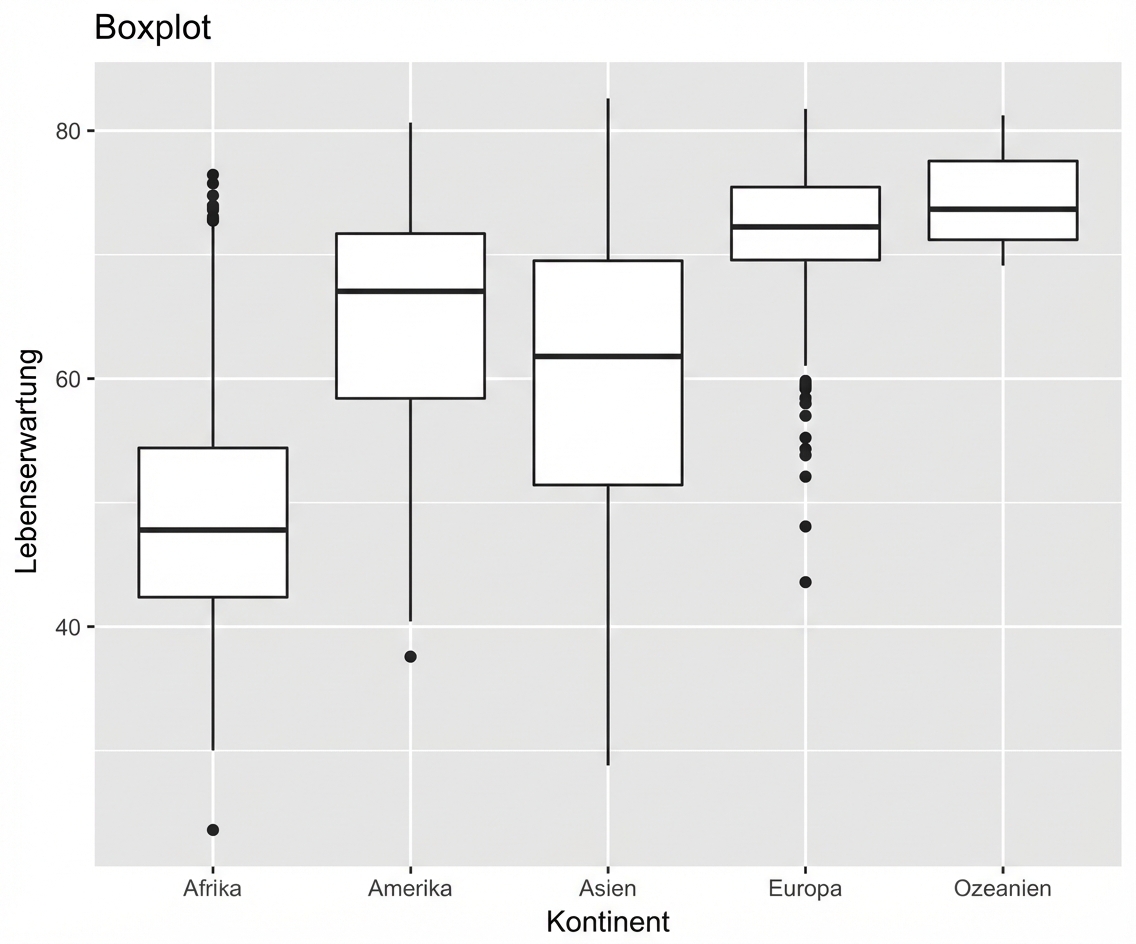
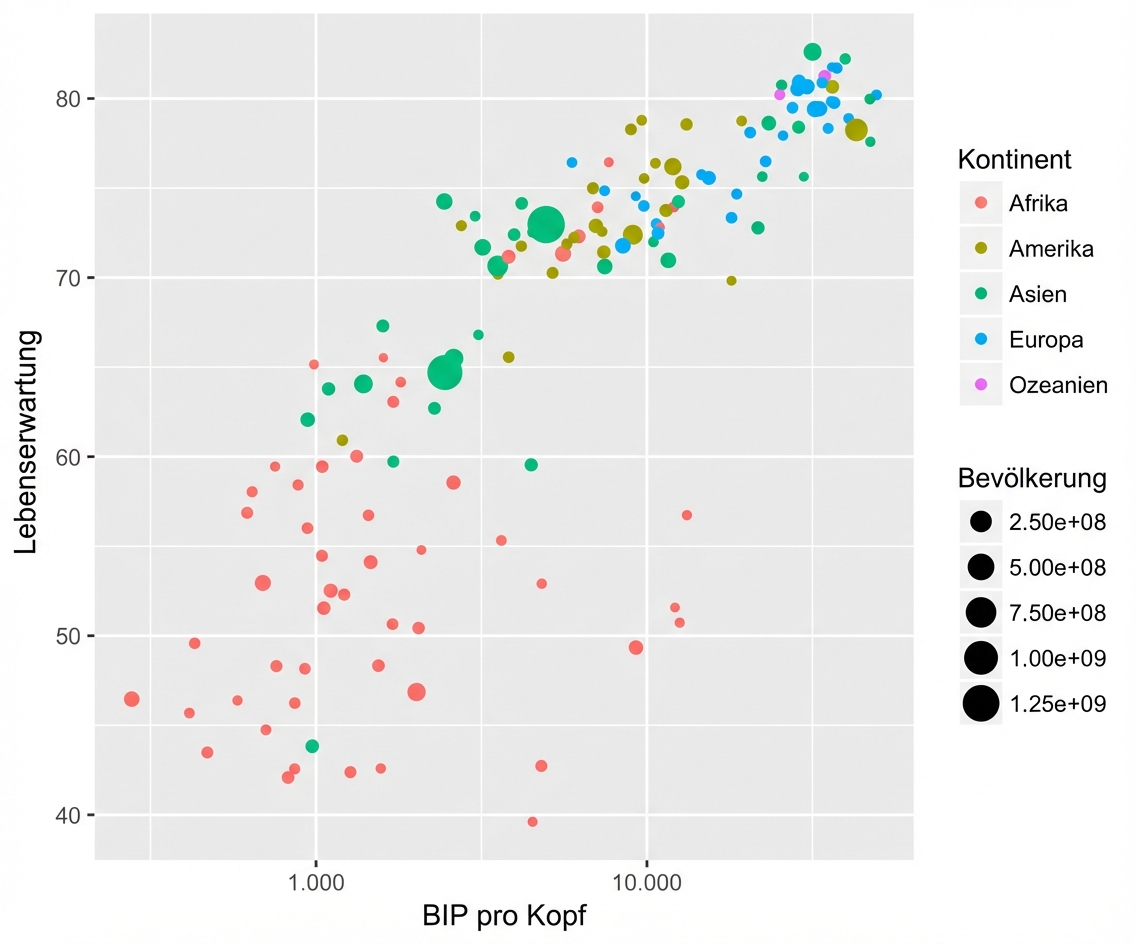
Streudiagramm und Liniendiagramm im Vergleich
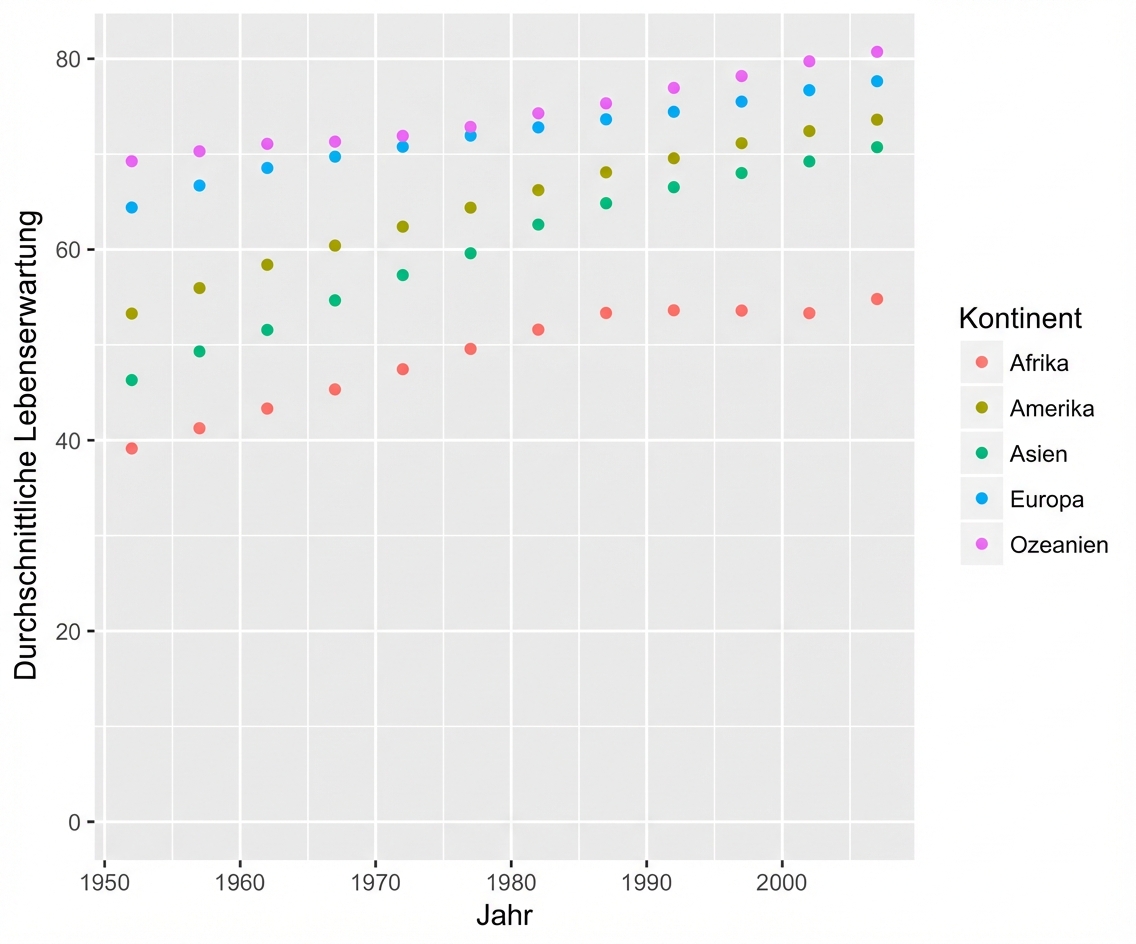
geom_point()
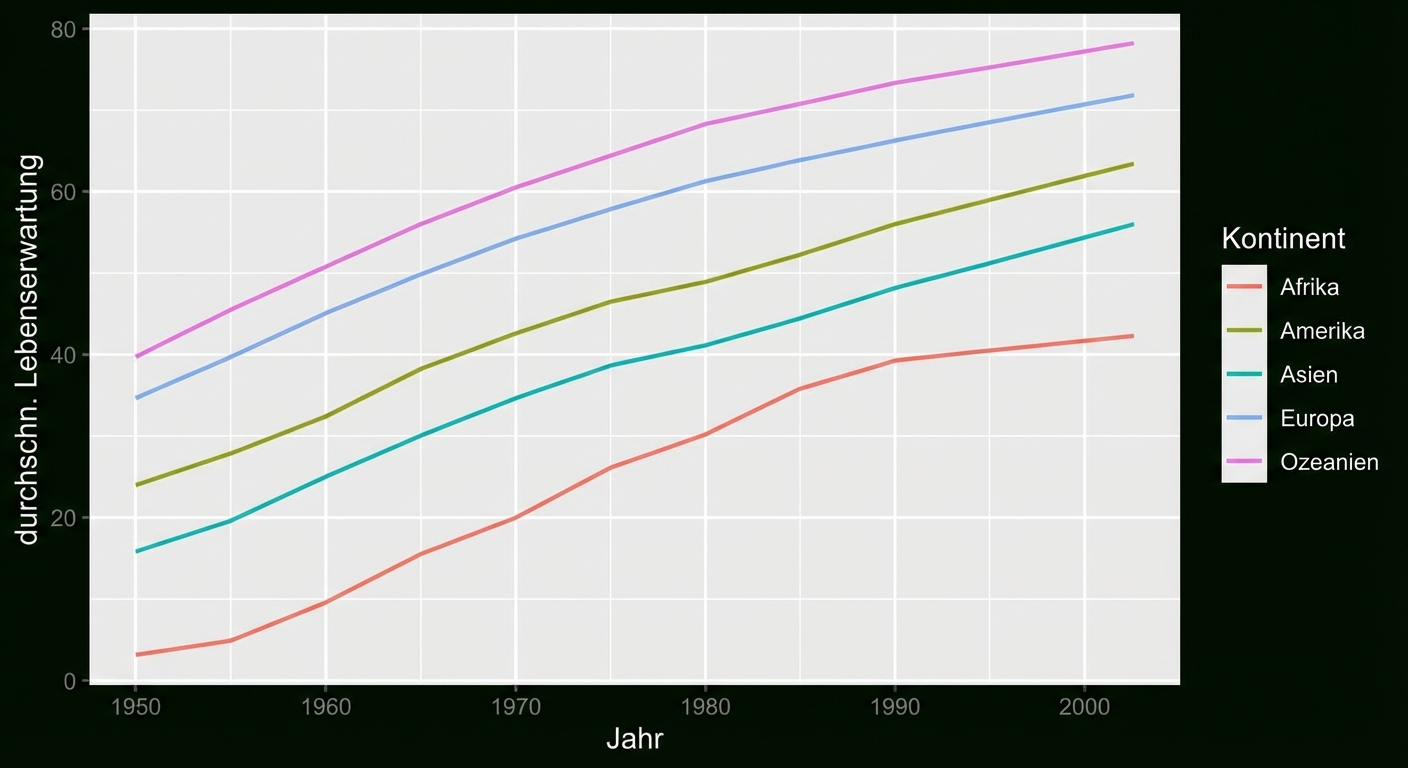
geom_line()
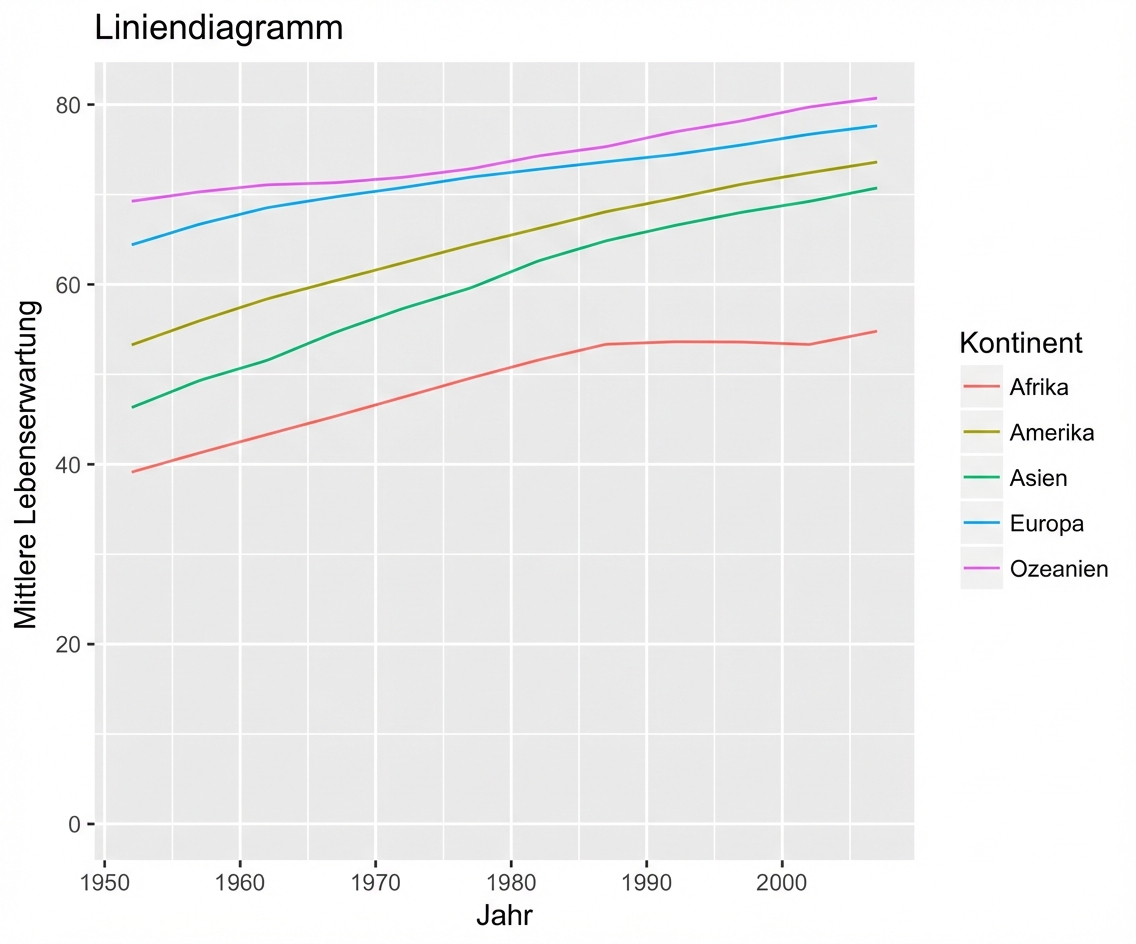
Liniendiagramm
ggplot(year_continent, aes(x = year, y = meanLifeExp, color = continent)) +
  geom_line() +
  expand_limits(y = 0)

