Bar plots

Introduction to the Tidyverse

David Robinson

Chief Data Scientist, DataCamp

Summarizing by continent

by_continent <- gapminder %>%
  filter(year == 2007) %>%
  group_by(continent) %>%
  summarize(meanLifeExp = mean(lifeExp))

by_continent
# A tibble: 5 x 2
  continent meanLifeExp
      <fct>       <dbl>
1    Africa    54.80604
2  Americas    73.60812
3      Asia    70.72848
4    Europe    77.64860
5   Oceania    80.71950
Introduction to the Tidyverse

Bar plot

fl3nTfr.png

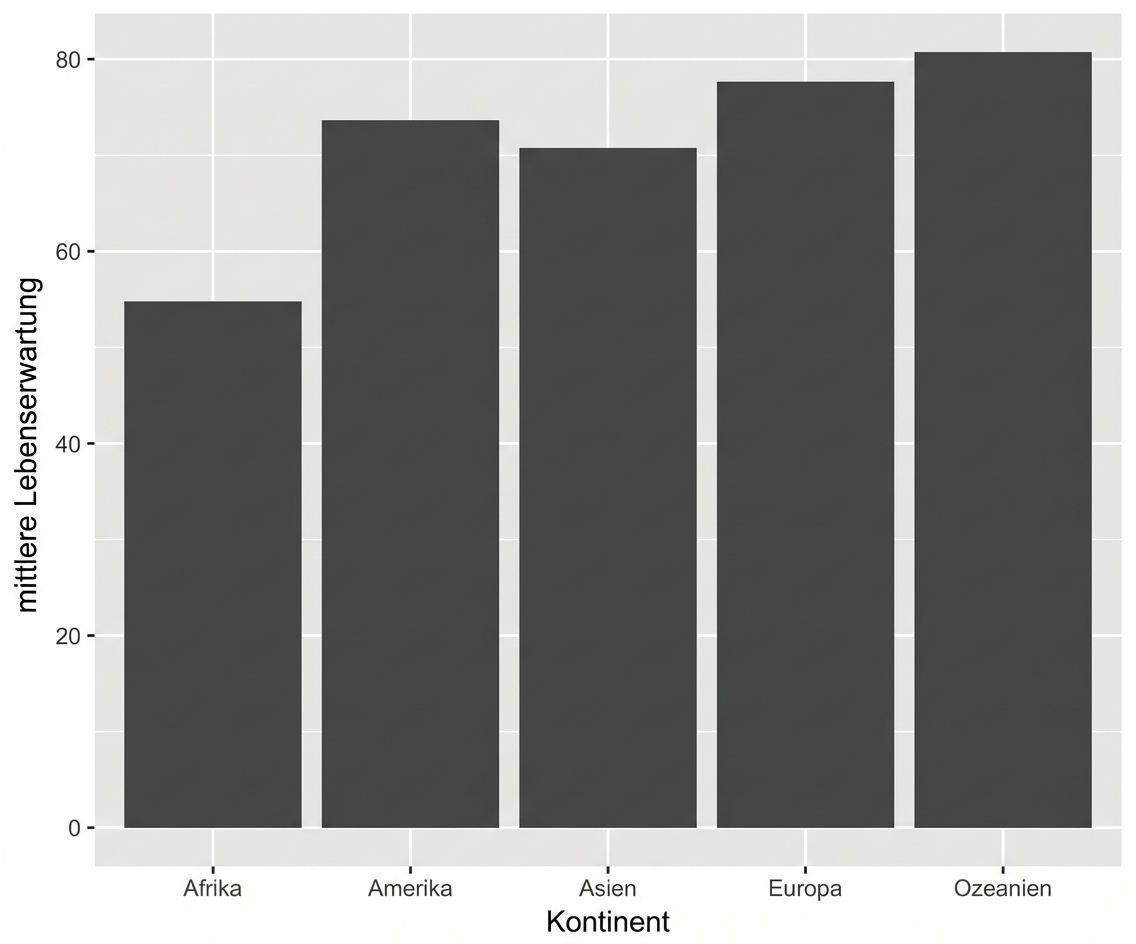
ggplot(by_continent, aes(x = continent, y = meanLifeExp)) +
  geom_col()
Introduction to the Tidyverse

Let's practice!

Introduction to the Tidyverse

Preparing Video For Download...