Die Poisson-Verteilung
Einführung in die Statistik in R

Maggie Matsui
Content Developer, DataCamp
Poisson-Prozesse

Lambda ($\lambda$)
- $\lambda$ = durchschnittliche Anzahl von Ereignissen pro Zeitspanne
- Durchschnittliche Anzahl von Adoptionen pro Woche = 8
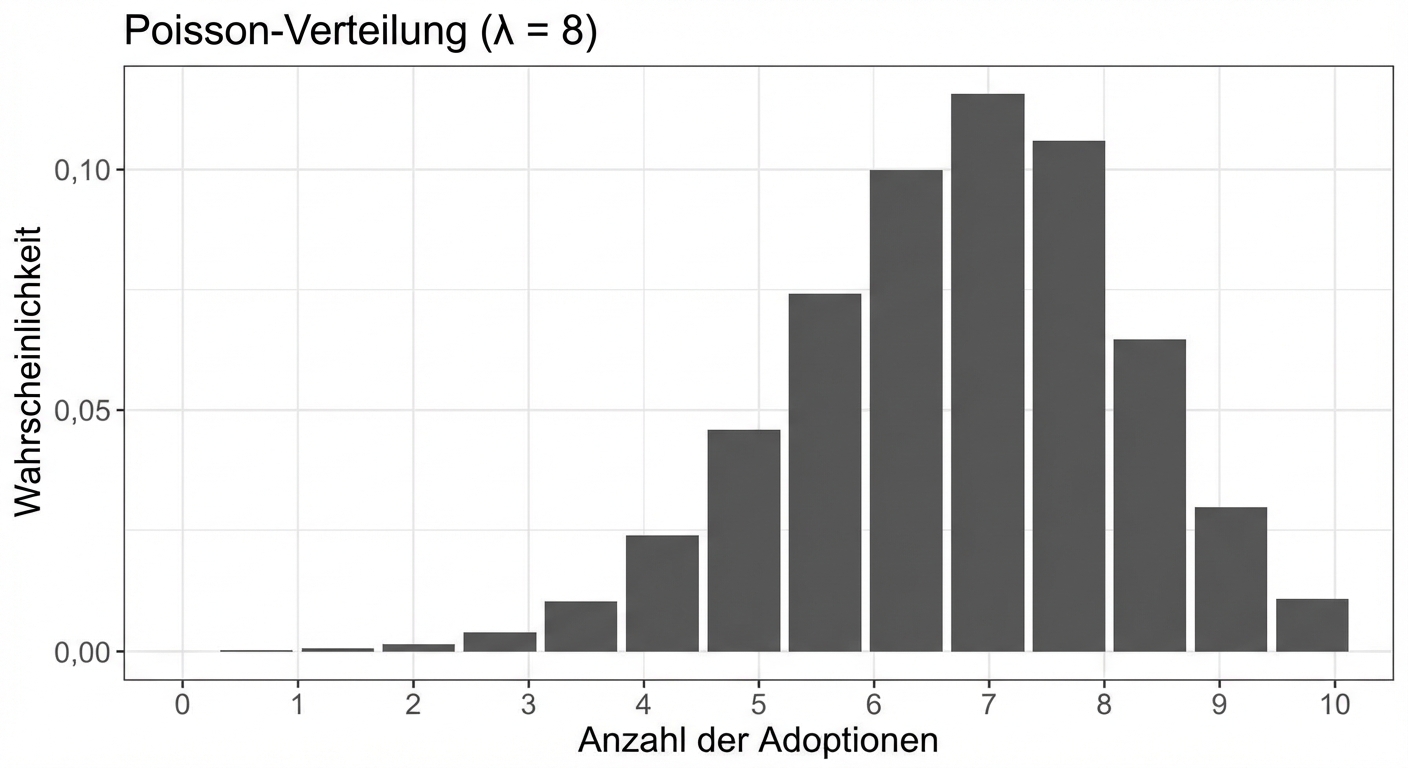
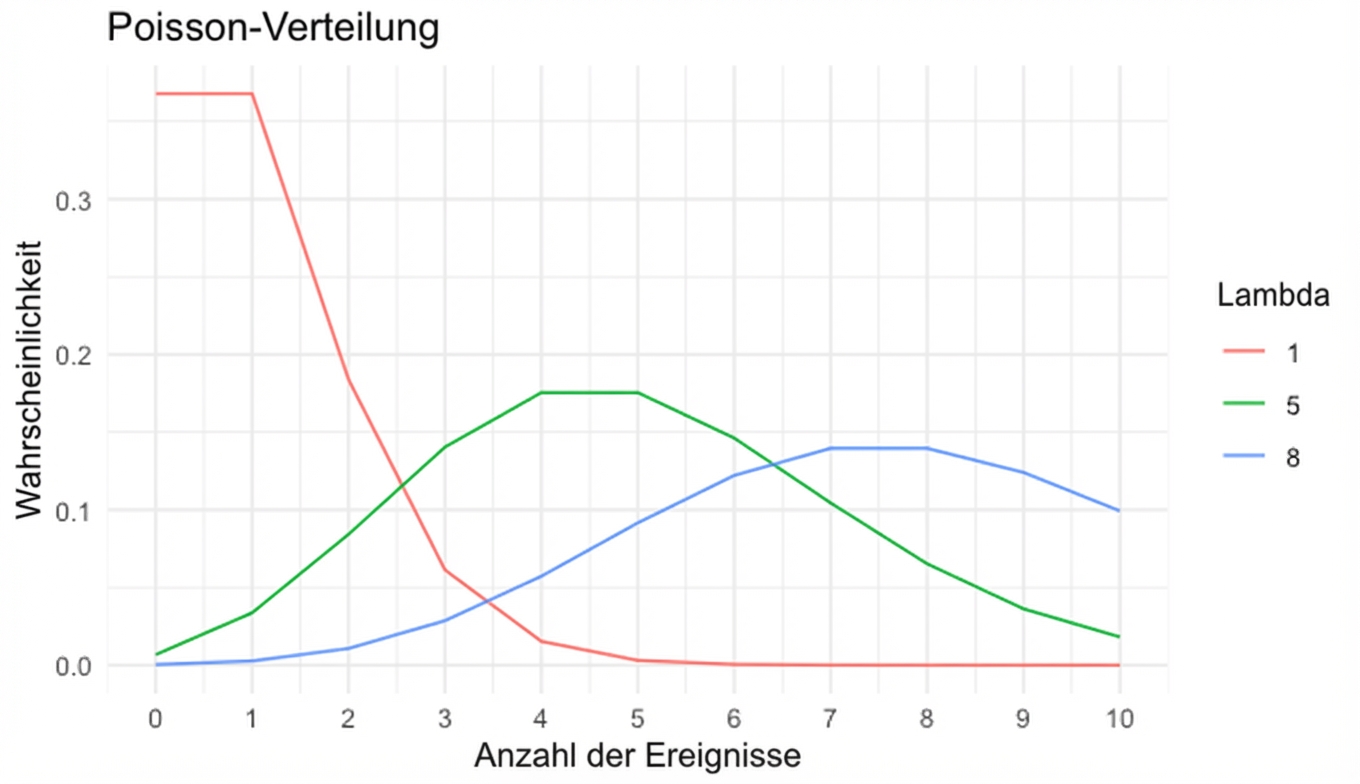
Lambda ist die Spitze der Verteilung
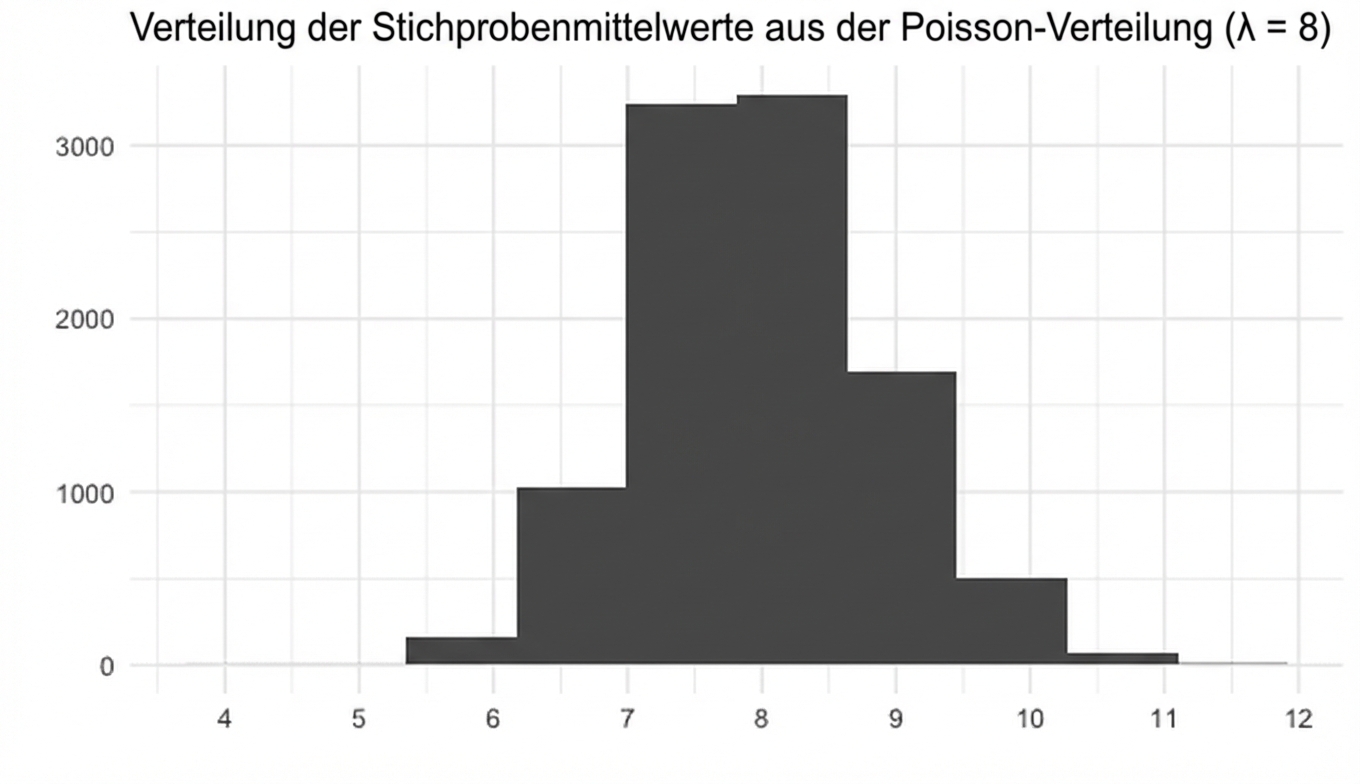
Der zentrale Grenzwertsatz gilt immer noch!