The normal distribution

Introduction to Statistics in R

Maggie Matsui

Content Developer, DataCamp

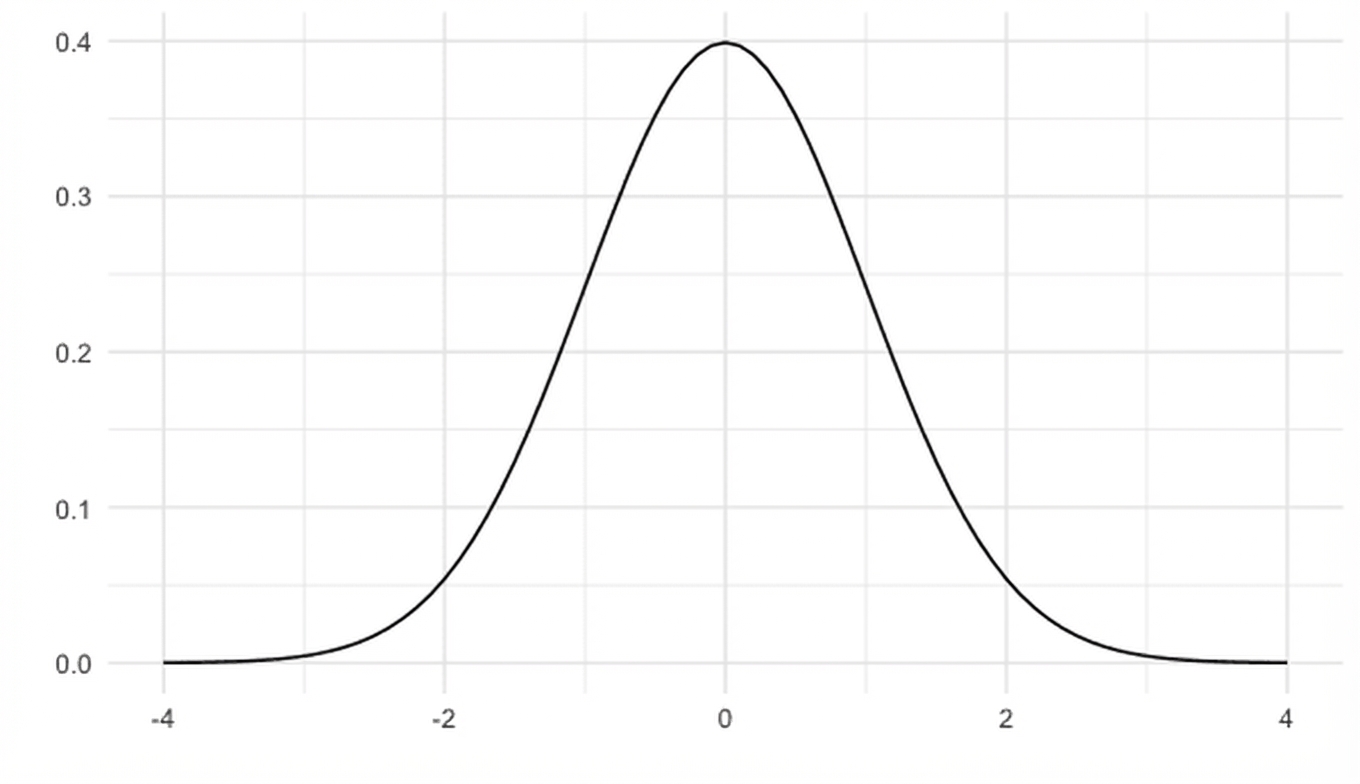
What is the normal distribution?

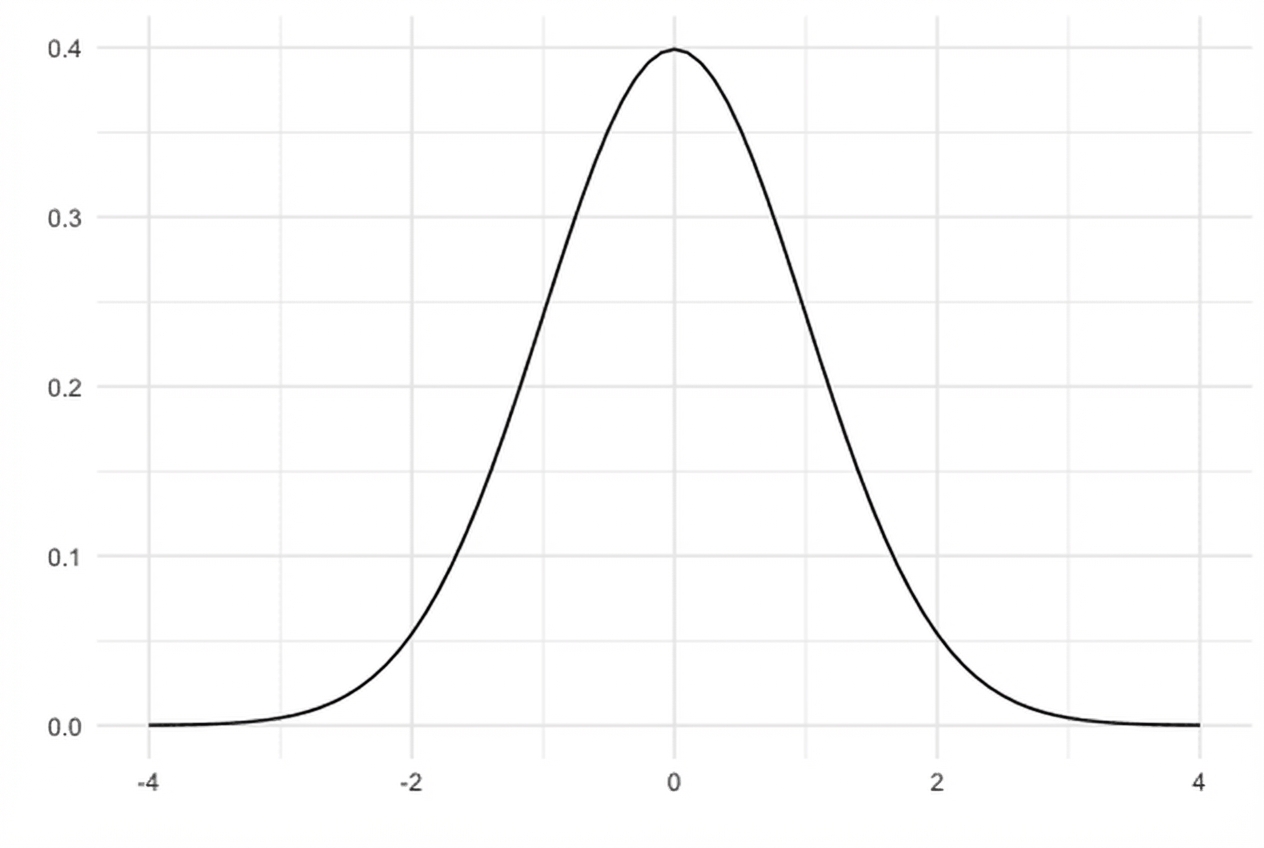
Density function of normal distribution

Introduction to Statistics in R

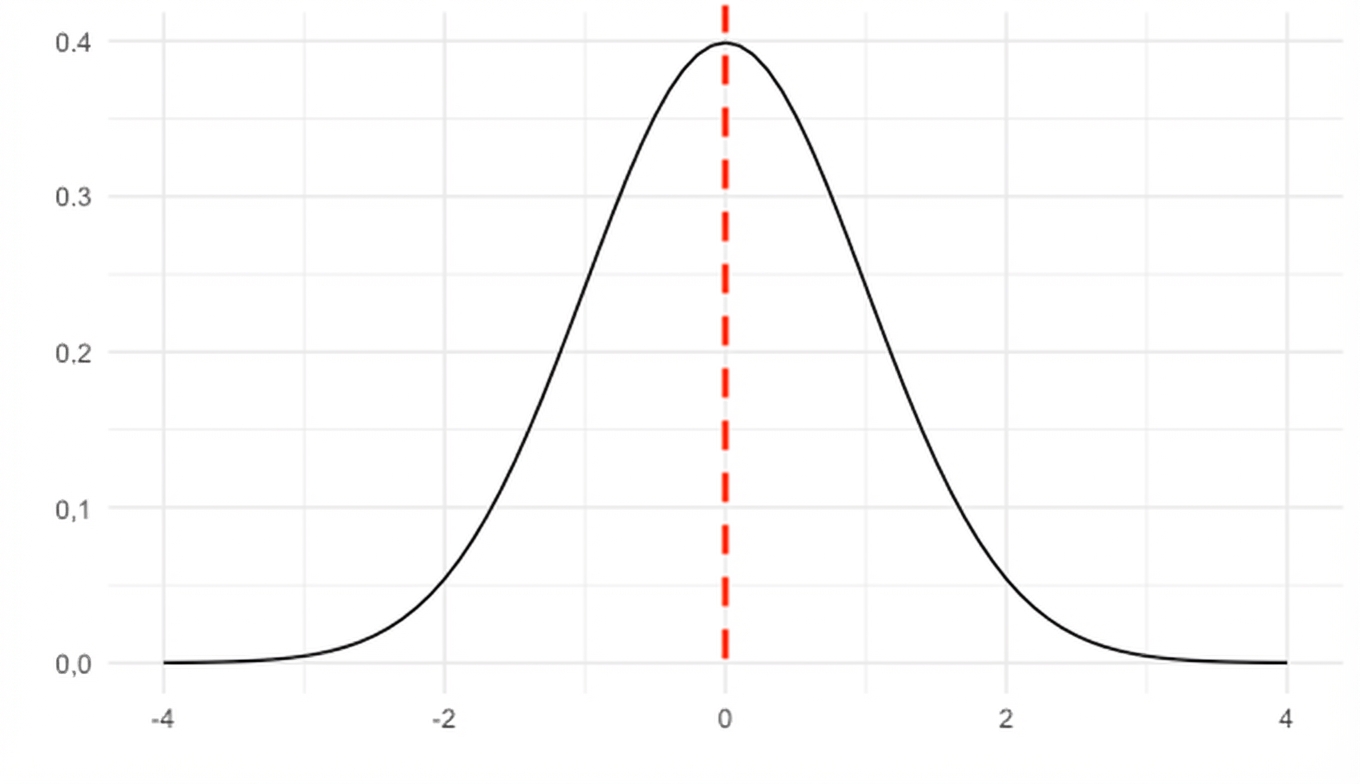
Symmetrical

Dashed vertical line down the middle of normal distribution

Introduction to Statistics in R

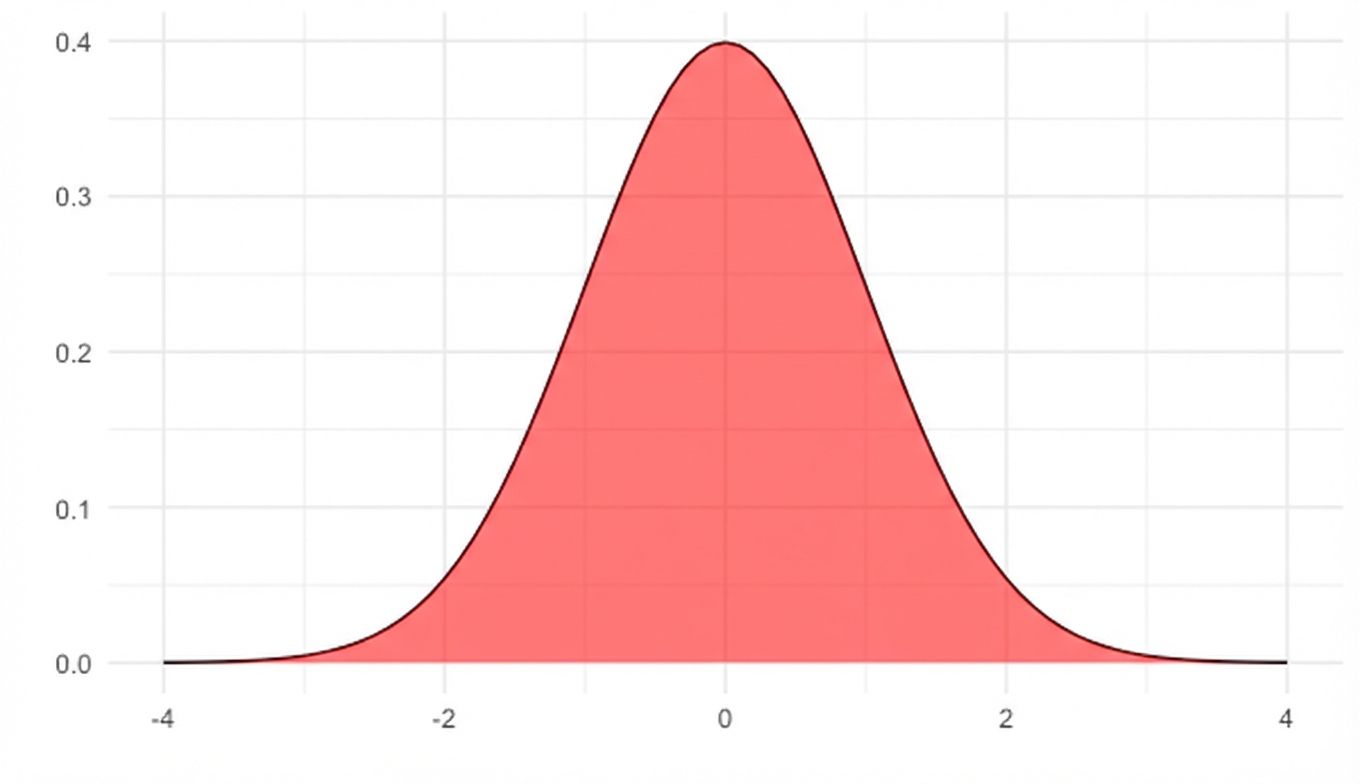
Area = 1

Normal distribution with area underneath curve shaded

Introduction to Statistics in R

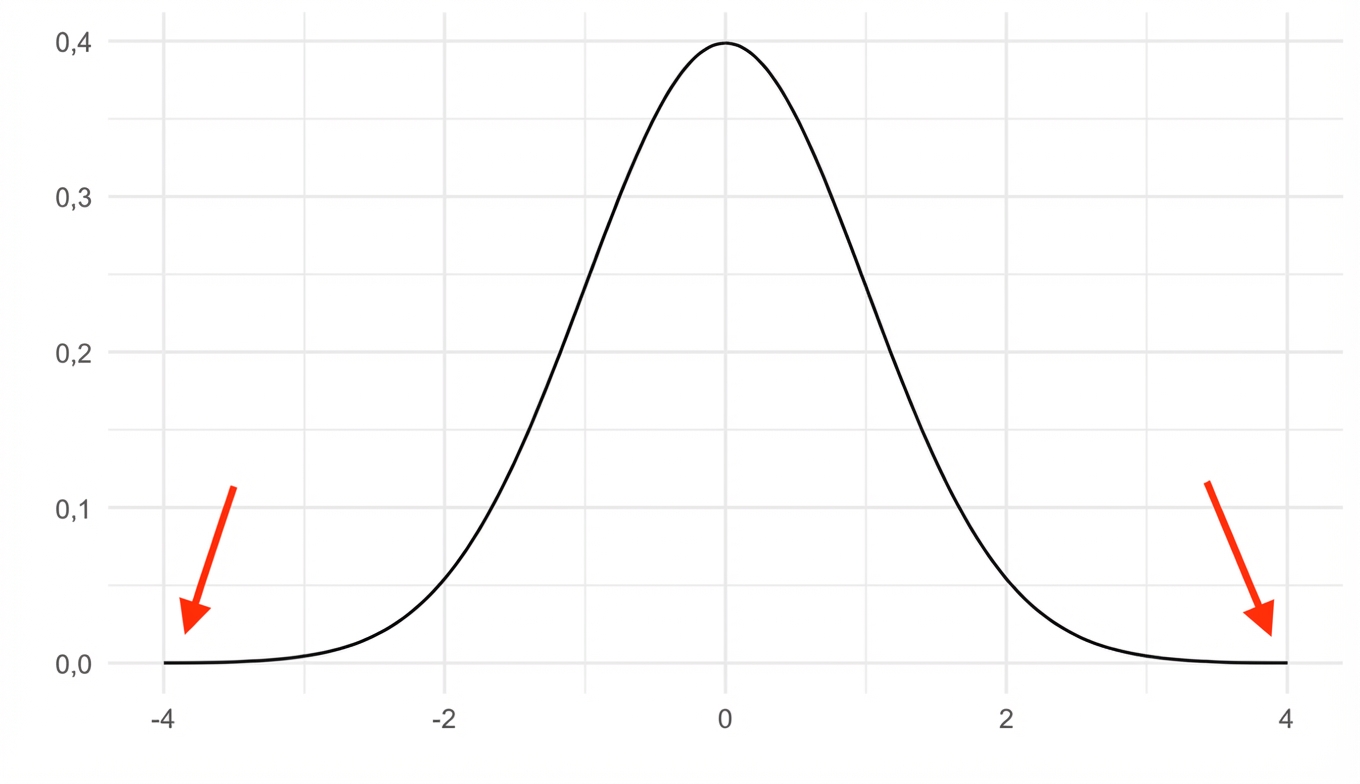
Curve never hits 0

Normal distribution with arrows pointing to tails on either side

Introduction to Statistics in R

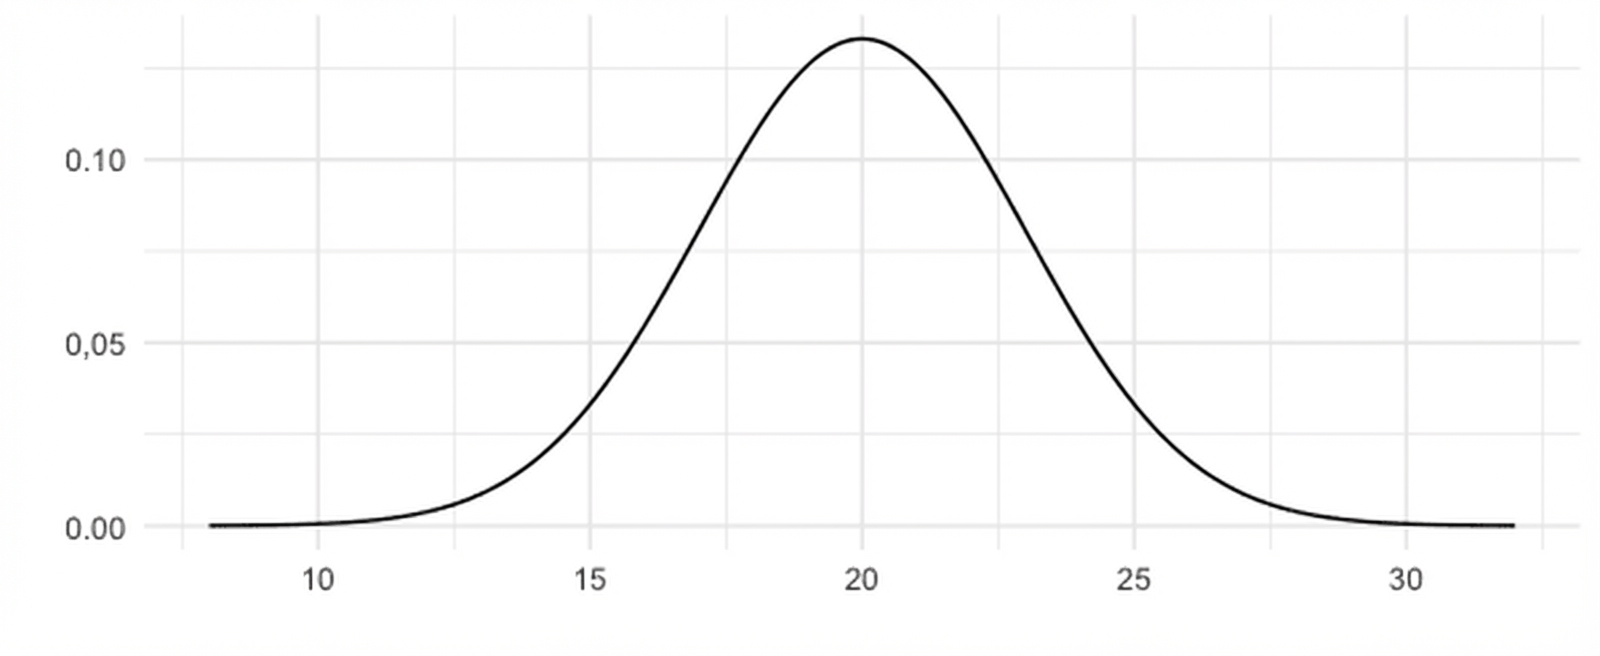
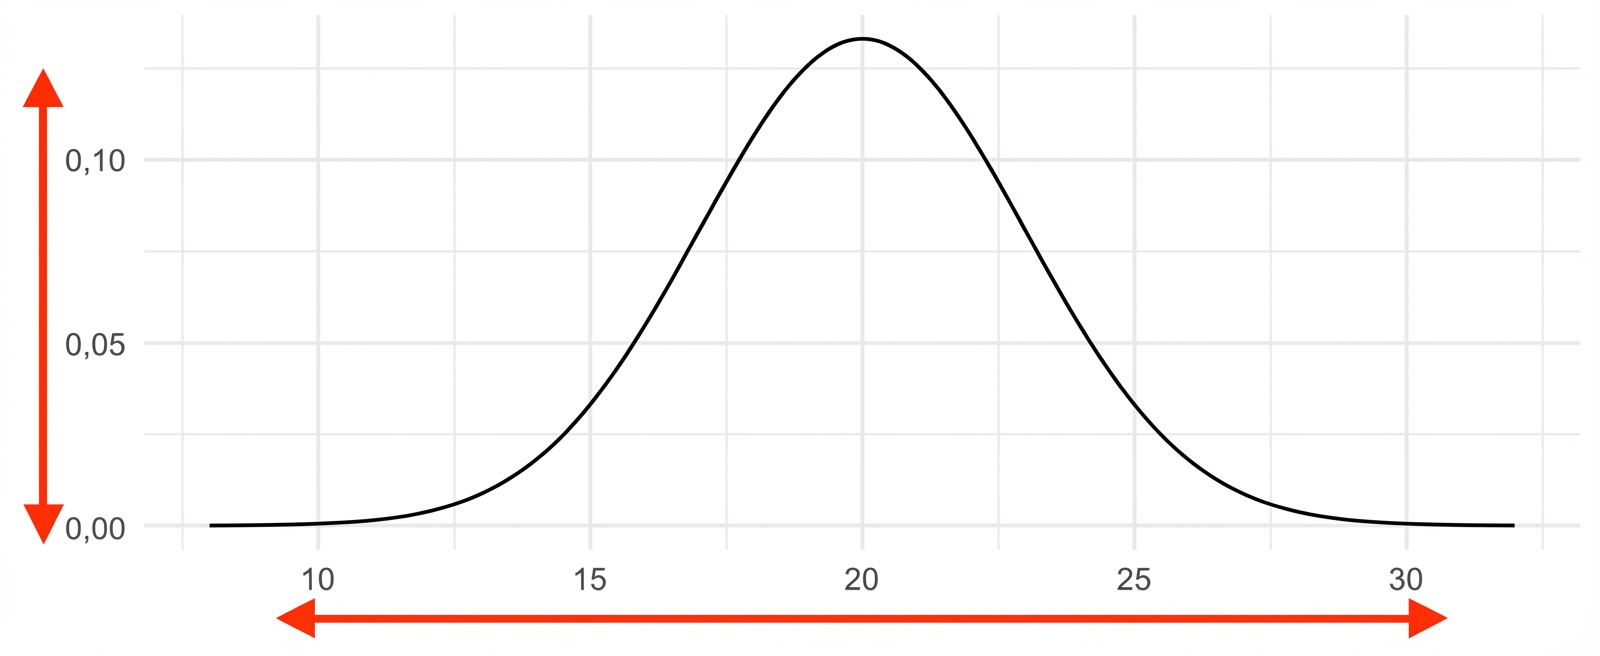
Described by mean and standard deviation


                                                          Mean: 20

                                      Standard deviation: 3

Normal distribution with mean 20 and sd 3

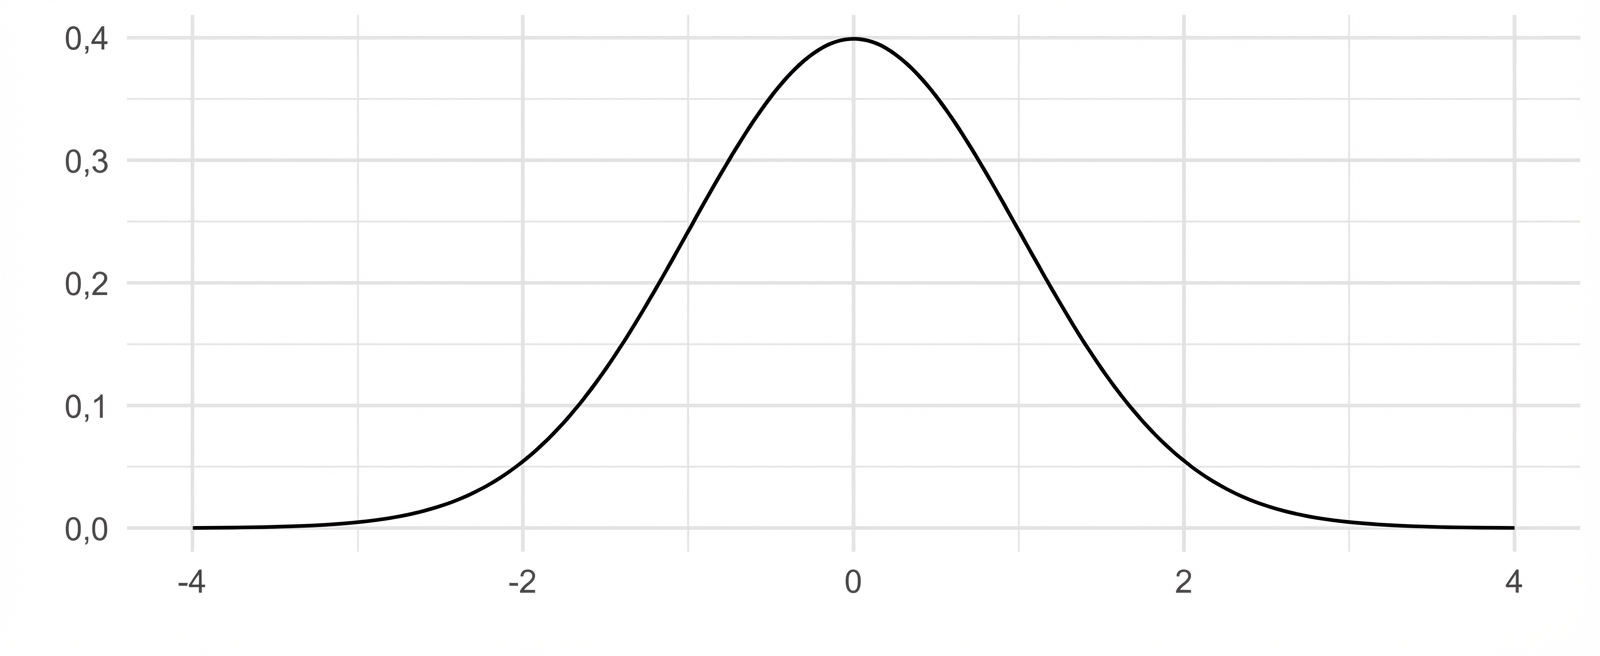
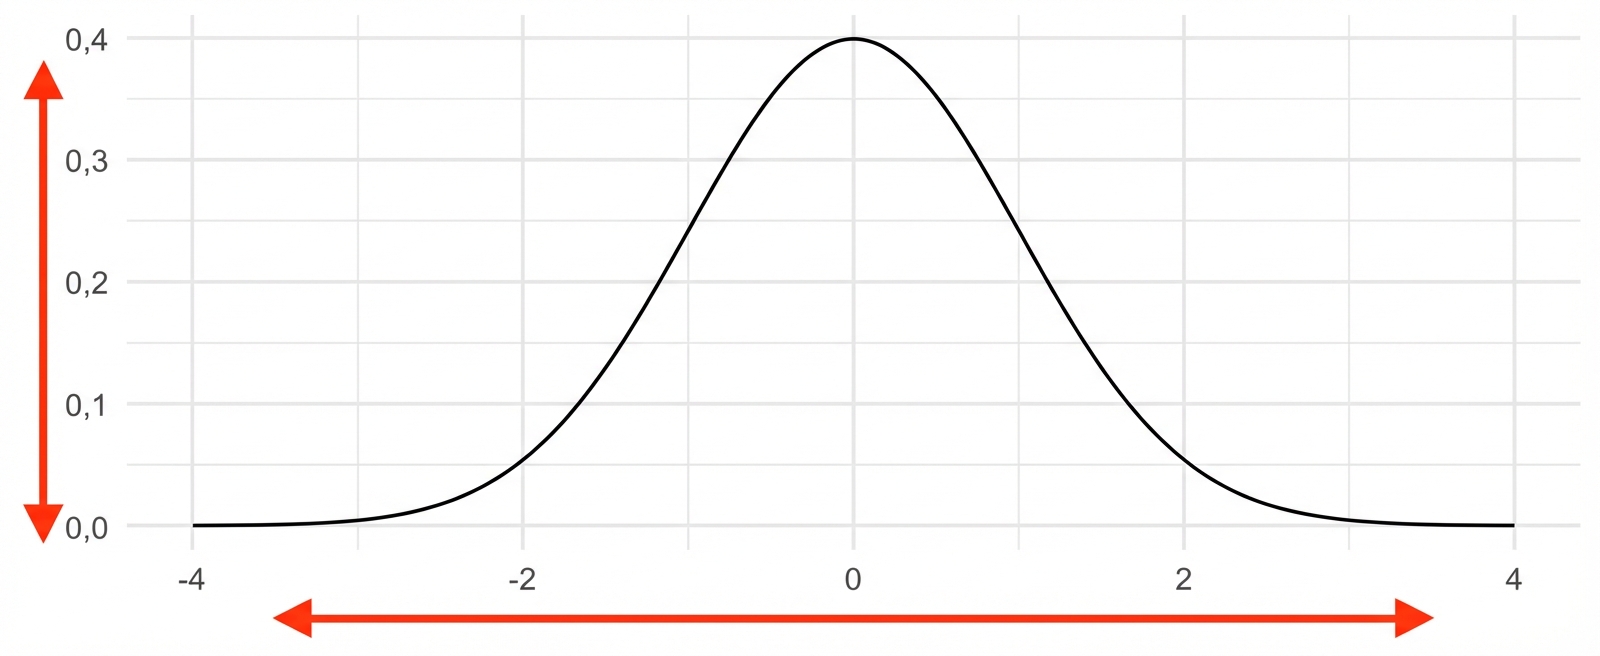
                         Standard normal distribution

                                                           Mean: 0

                                      Standard deviation: 1

Normal distribution with mean 0 and sd 1

Introduction to Statistics in R

Areas under the normal distribution

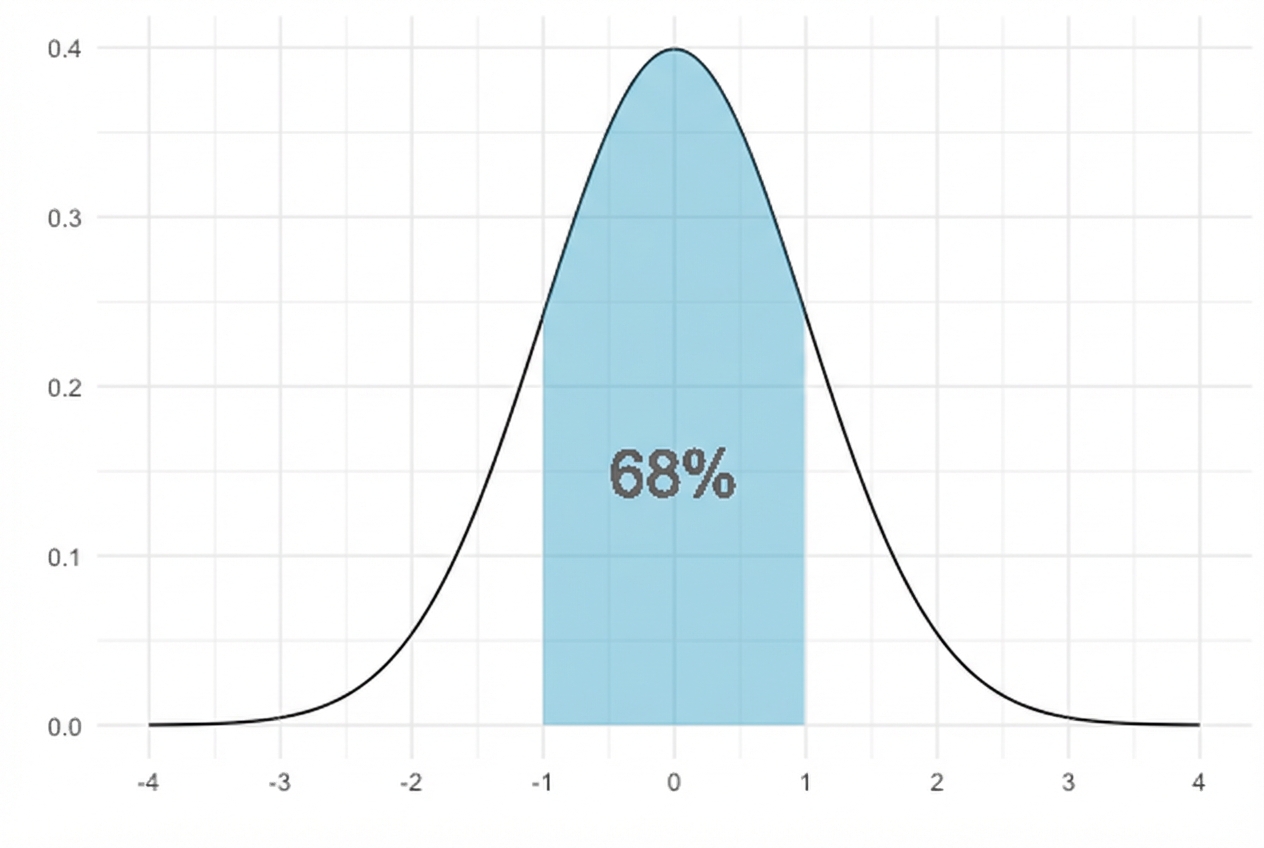
68% falls within 1 standard deviation

Normal distribution with area between -1 and 1 highlighted, labeled with 68%

Introduction to Statistics in R

Areas under the normal distribution

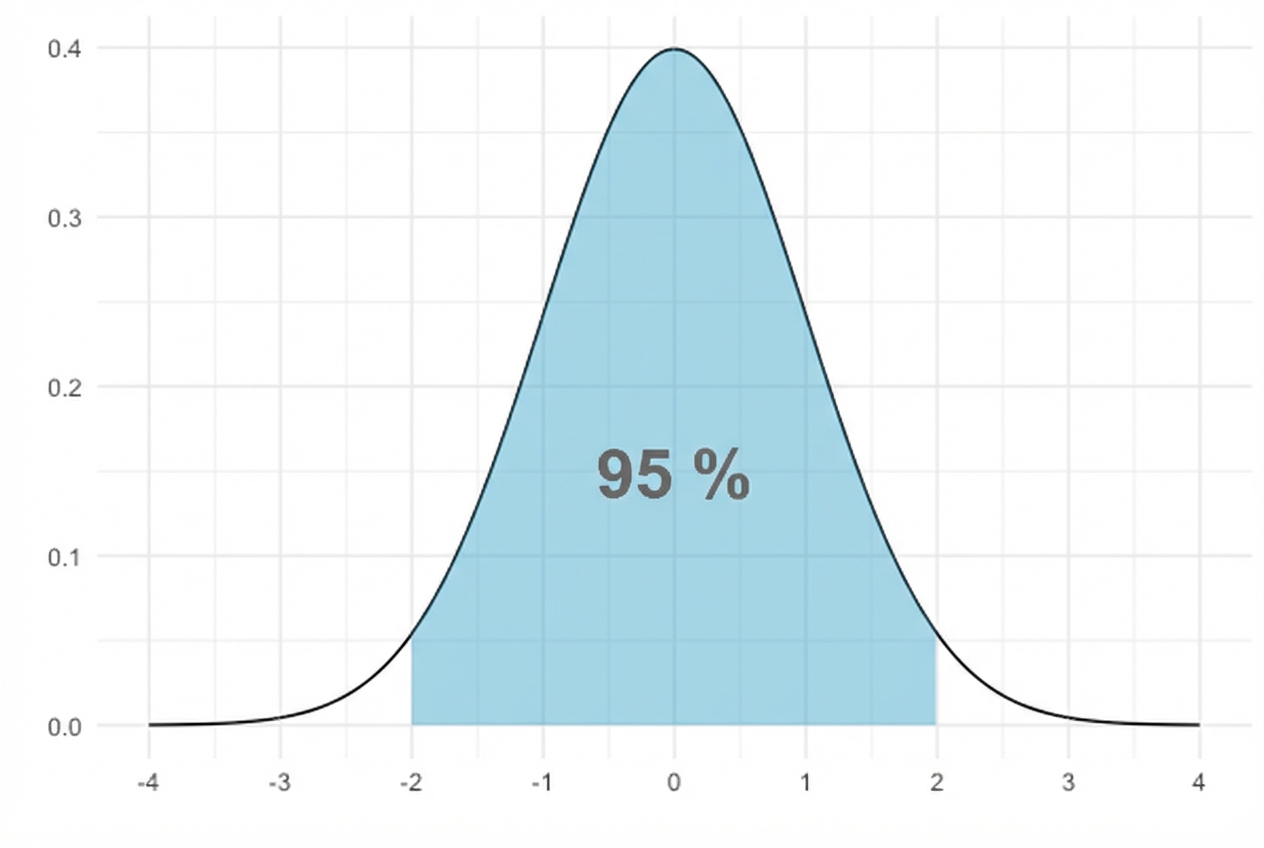
95% falls within 2 standard deviations

Normal distribution with area between -2 and 2 highlighted, labeled with 95%

Introduction to Statistics in R

Areas under the normal distribution

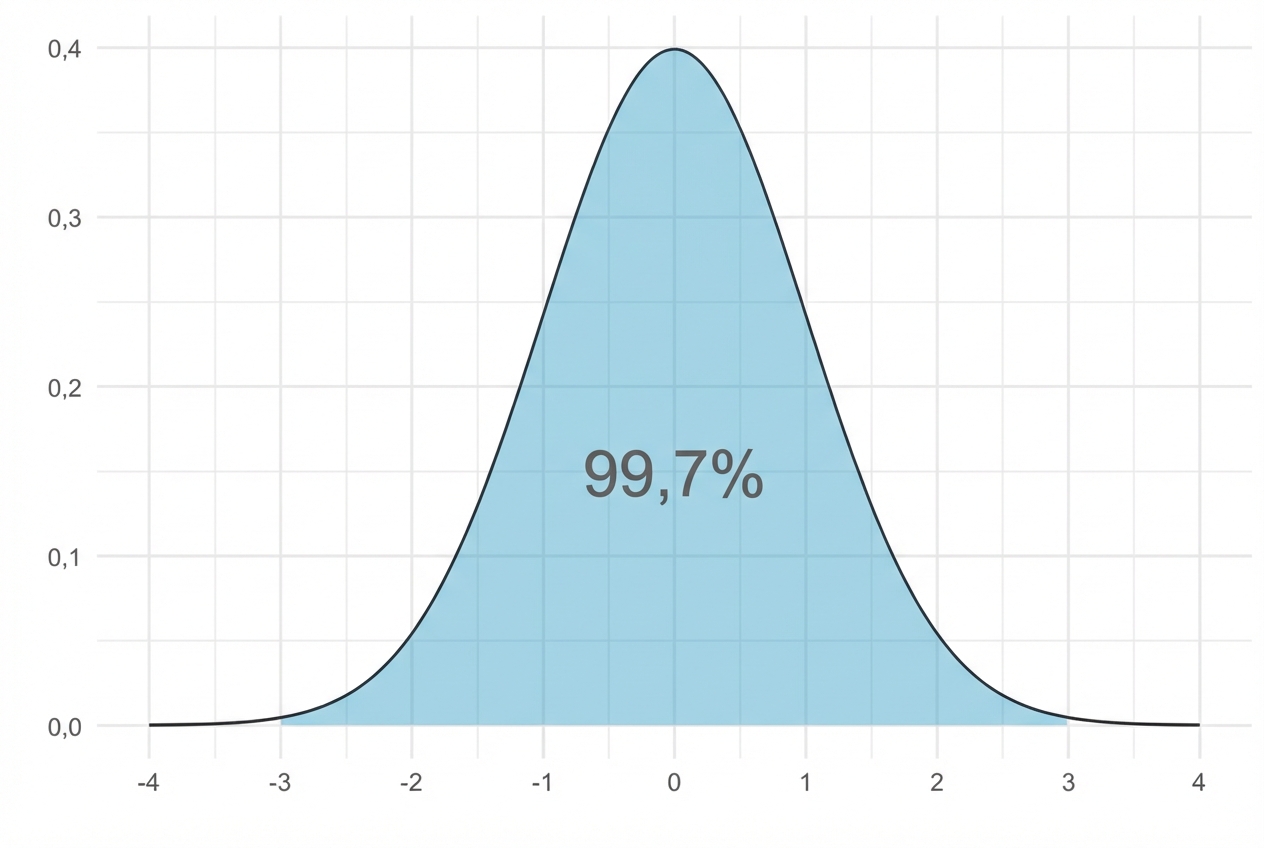
99.7% falls within 3 standard deviations

Normal distribution with area between -3 and 3 highlighted, labeled with 99.7%

Introduction to Statistics in R

Lots of histograms look normal

Normal distribution

Standard normal distribution

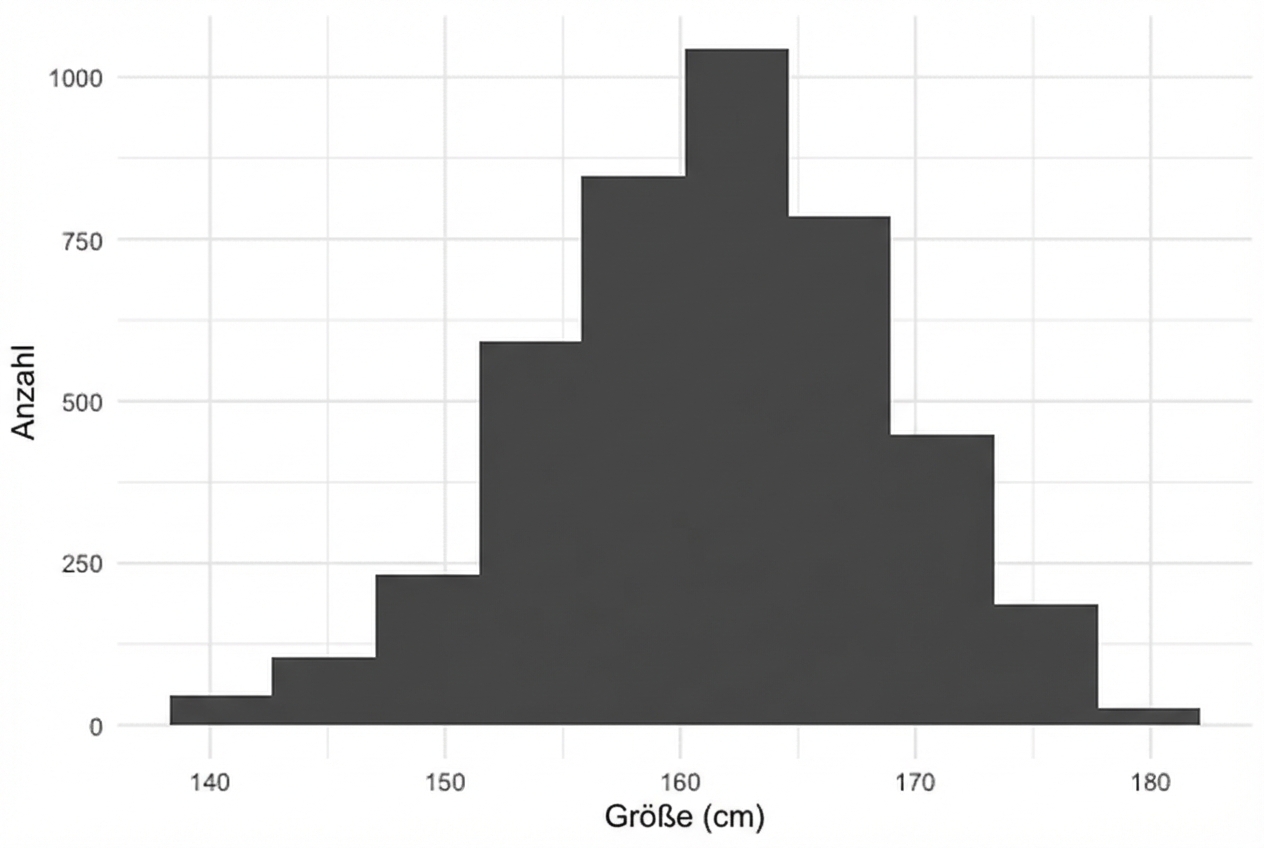
Women's heights from NHANES

Histogram of women's heights

  Mean: 161 cm      Standard deviation: 7 cm

Introduction to Statistics in R

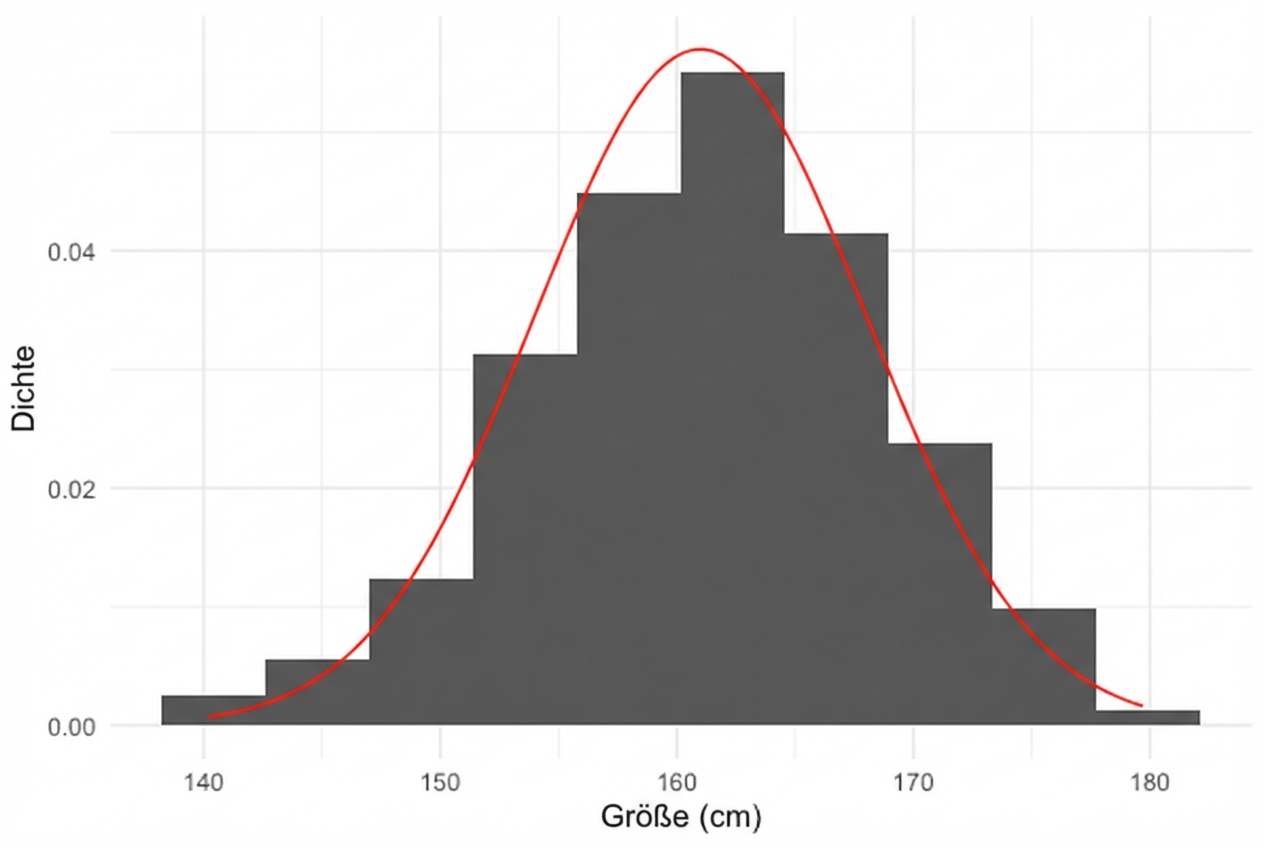
Approximating data with the normal distribution

Normal curve drawn over the histogram of women's heights

Introduction to Statistics in R

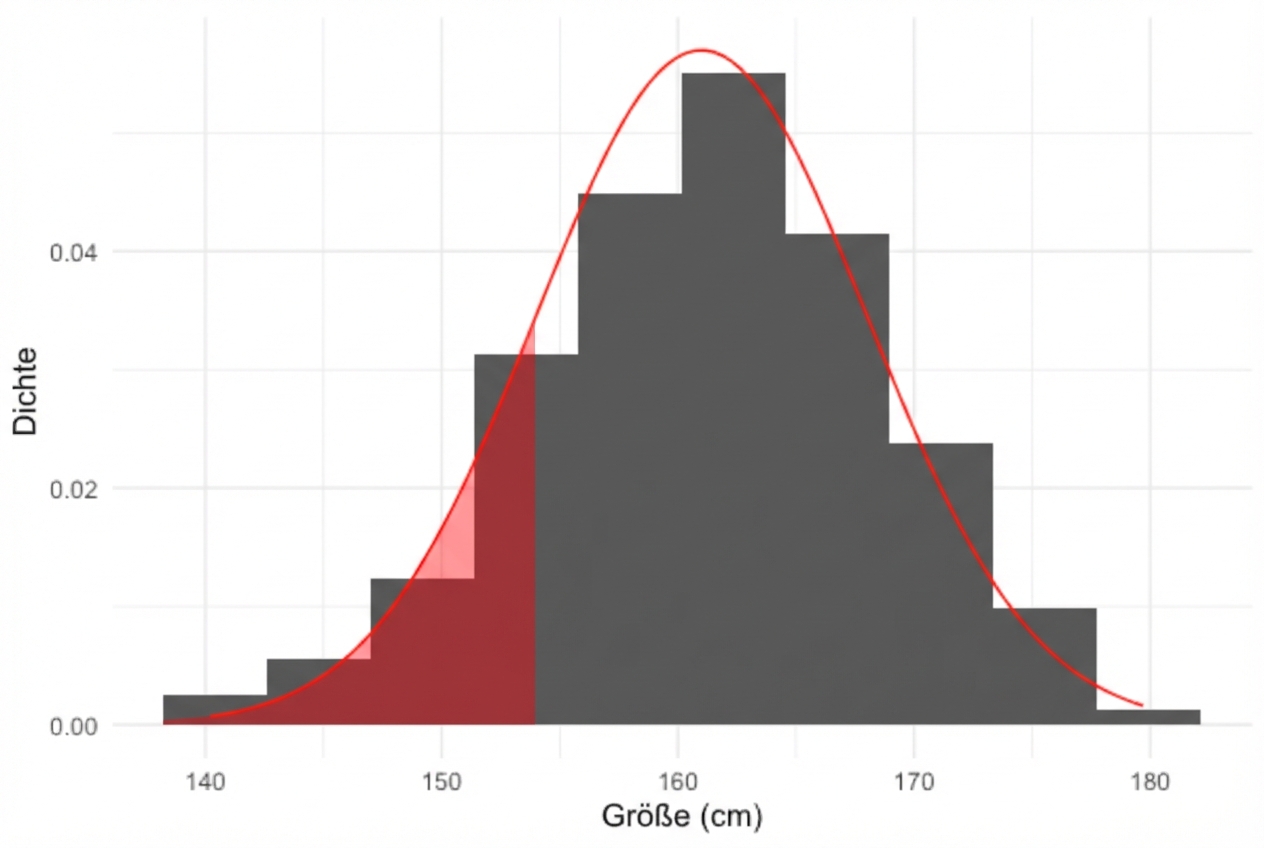
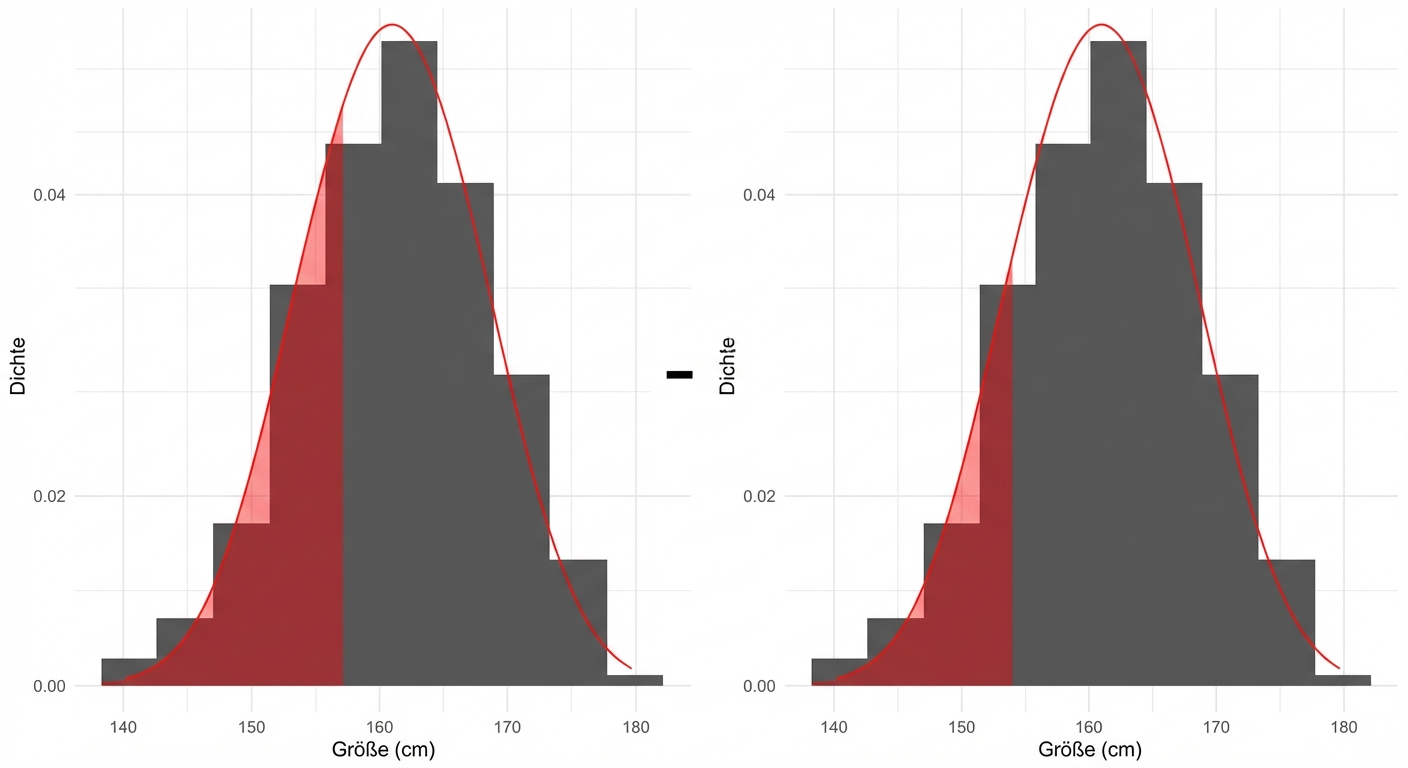
What percent of women are shorter than 154 cm?

Normal curve drawn over the histogram of women's heights with area less than 154 shaded

16% of women in the survey are shorter than 154 cm

pnorm(154, mean = 161, sd = 7)
0.159
Introduction to Statistics in R

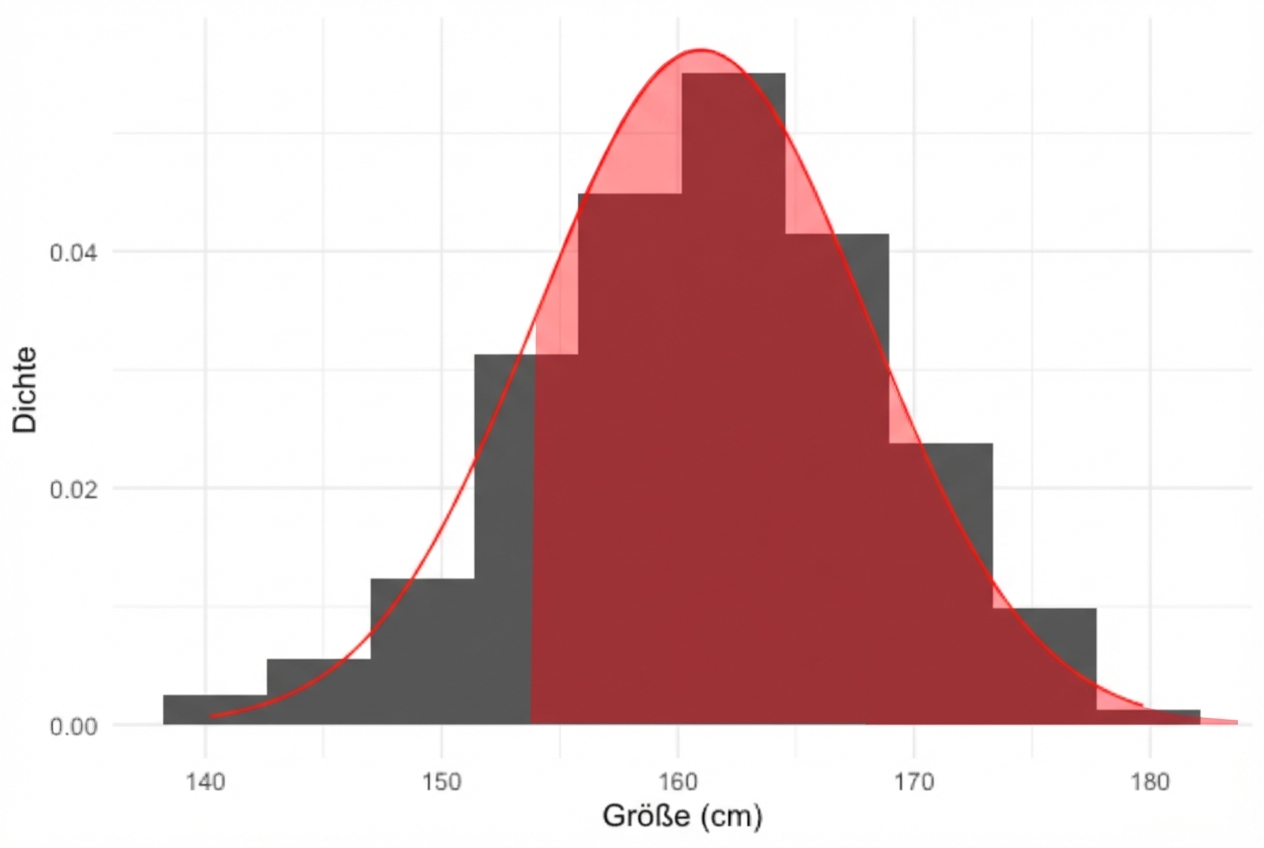
What percent of women are taller than 154 cm?

Normal curve drawn over the histogram of women's heights with area to the right of 154 shaded

pnorm(154, mean = 161, sd = 7, 
      lower.tail = FALSE)
0.8413447
Introduction to Statistics in R

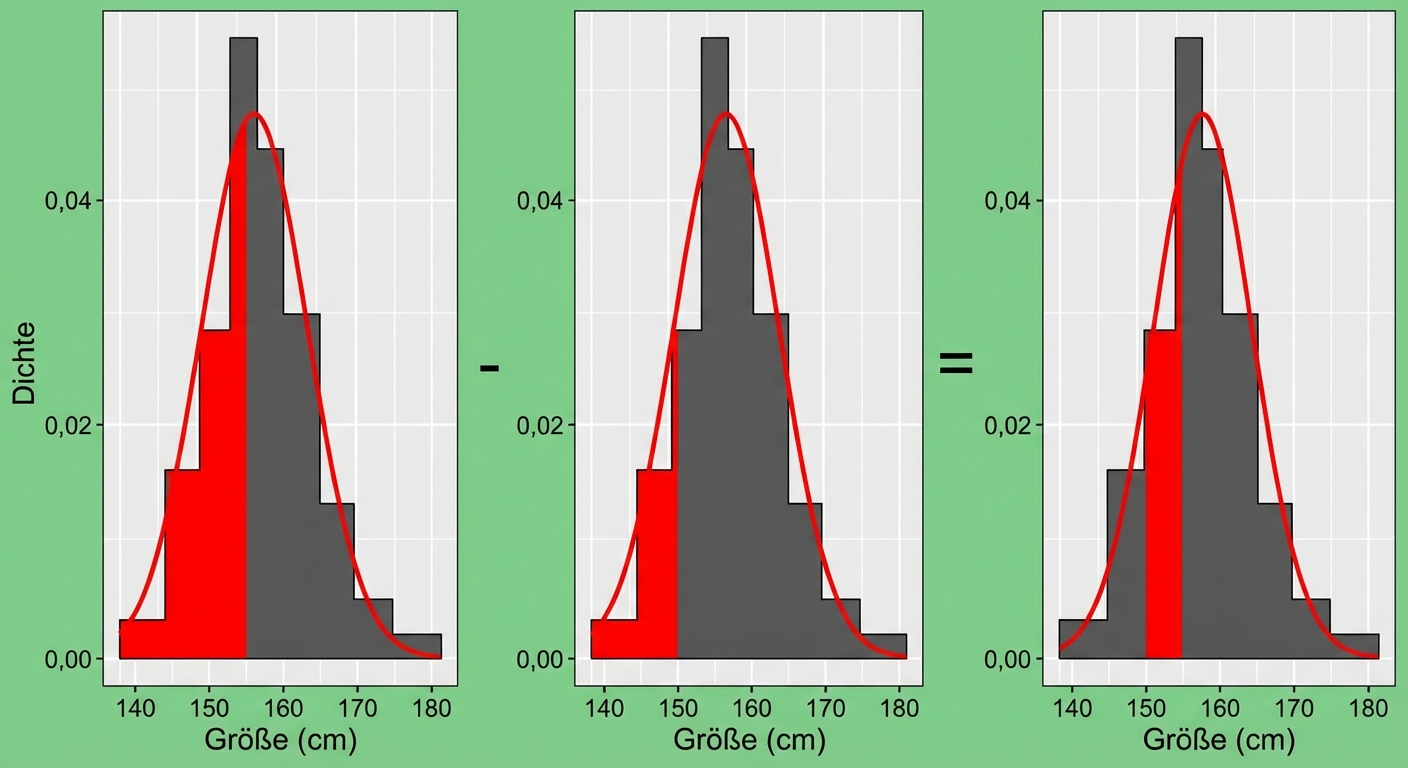
What percent of women are 154-157 cm?

Area less than 157 minus area less than 154

pnorm(157, mean = 161, sd = 7) - pnorm(154, mean = 161, sd = 7)
Introduction to Statistics in R

What percent of women are 154-157 cm?

Area less than 157 minus area less than 154 equals area between 154 and 157

pnorm(157, mean = 161, sd = 7) - pnorm(154, mean = 161, sd = 7)
0.1252
Introduction to Statistics in R

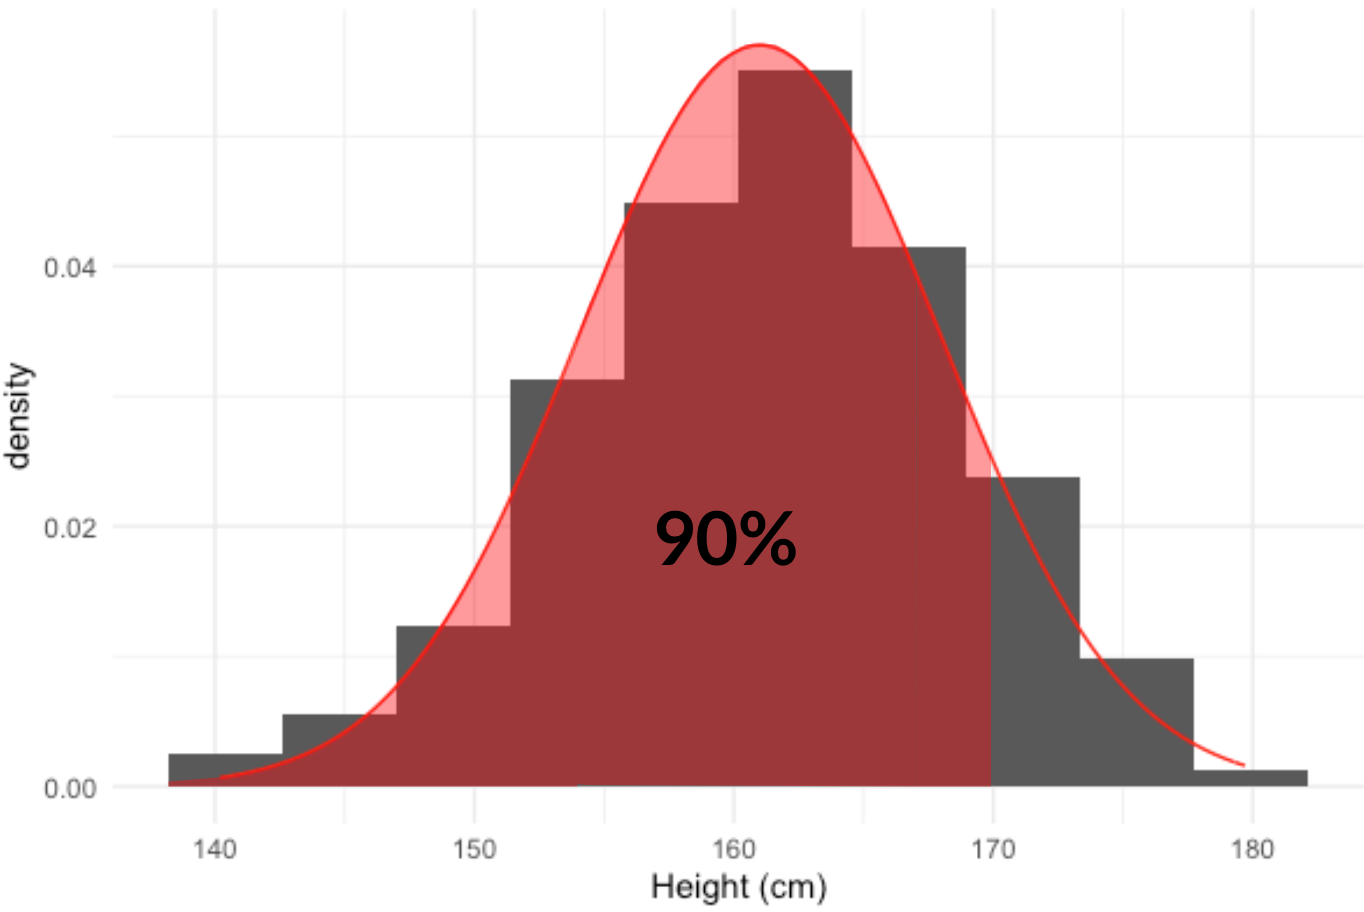
What height are 90% of women shorter than?

Area less than 170 shaded, labeled 90%

qnorm(0.9, mean = 161, sd = 7)
169.9709
Introduction to Statistics in R

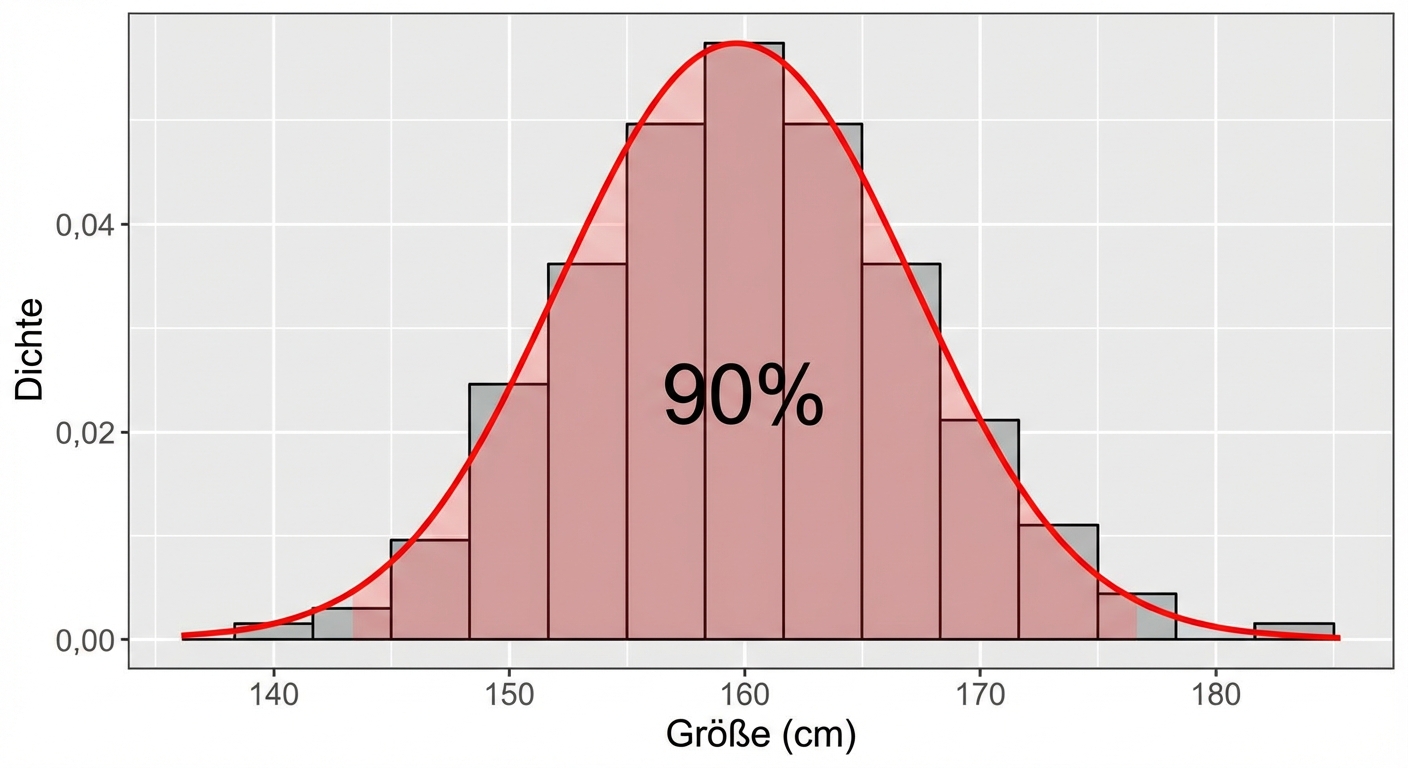
What height are 90% of women taller than?

Area greater than about 162 shaded, labeled 90%

qnorm(0.9,
      mean = 161,
      sd = 7,
      lower.tail = FALSE)
152.03
Introduction to Statistics in R

Generating random numbers

# Generate 10 random heights
rnorm(10, mean = 161, sd = 7)
159.35 157.34 149.85 156.75 163.53 156.33 157.22 171.44 158.10 170.12
Introduction to Statistics in R

Let's practice!

Introduction to Statistics in R

Preparing Video For Download...