Evaluating a model graphically
Supervised Learning in R: Regression

Nina Zumel and John Mount
Win-Vector LLC
Plotting Ground Truth vs. Predictions
A well fitting model
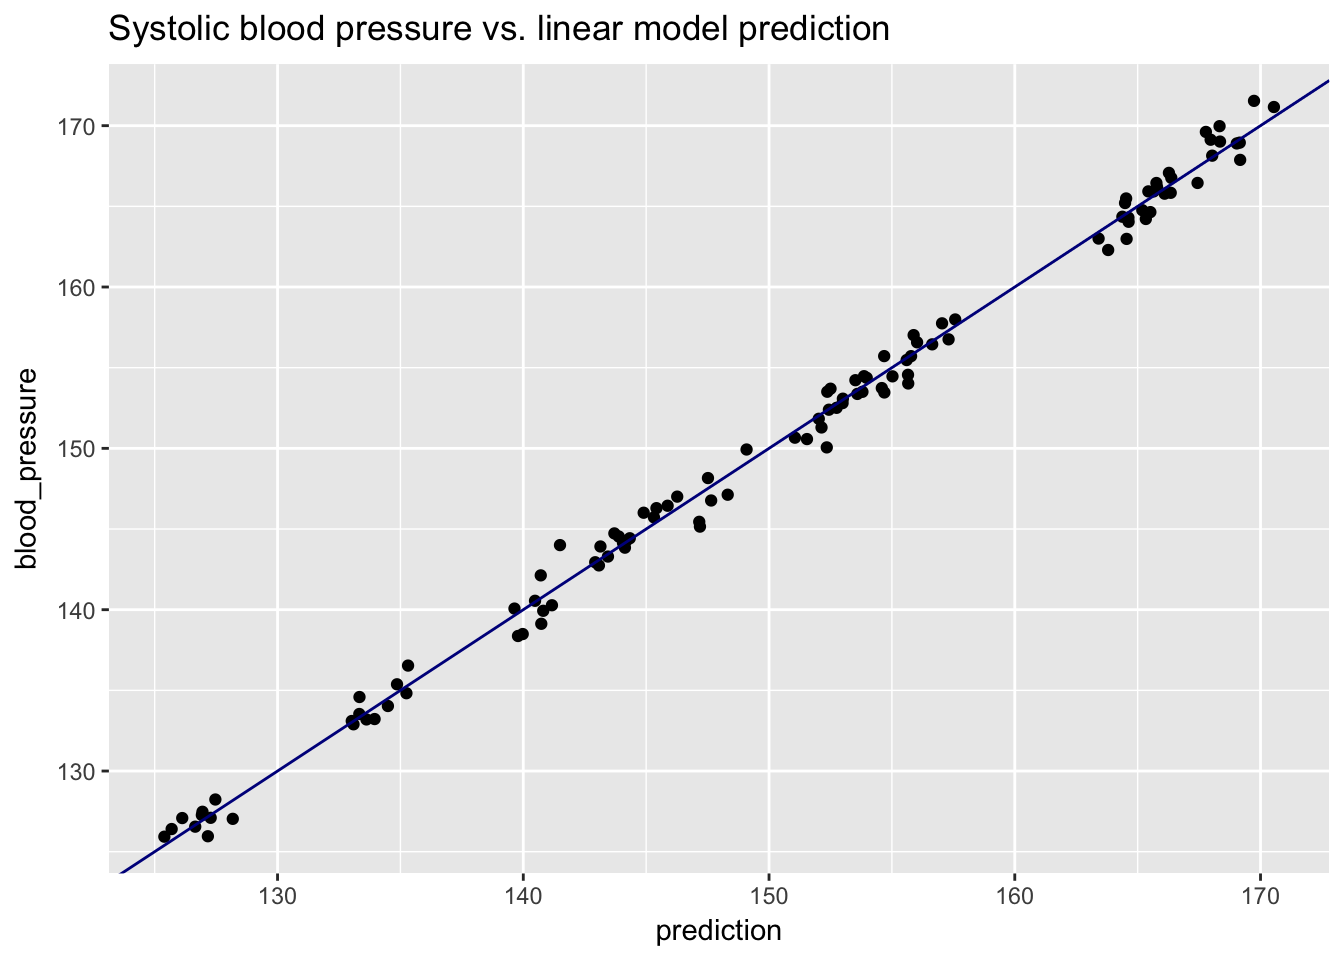
- x = y line runs through center of points
- "line of perfect prediction"
A poorly fitting model
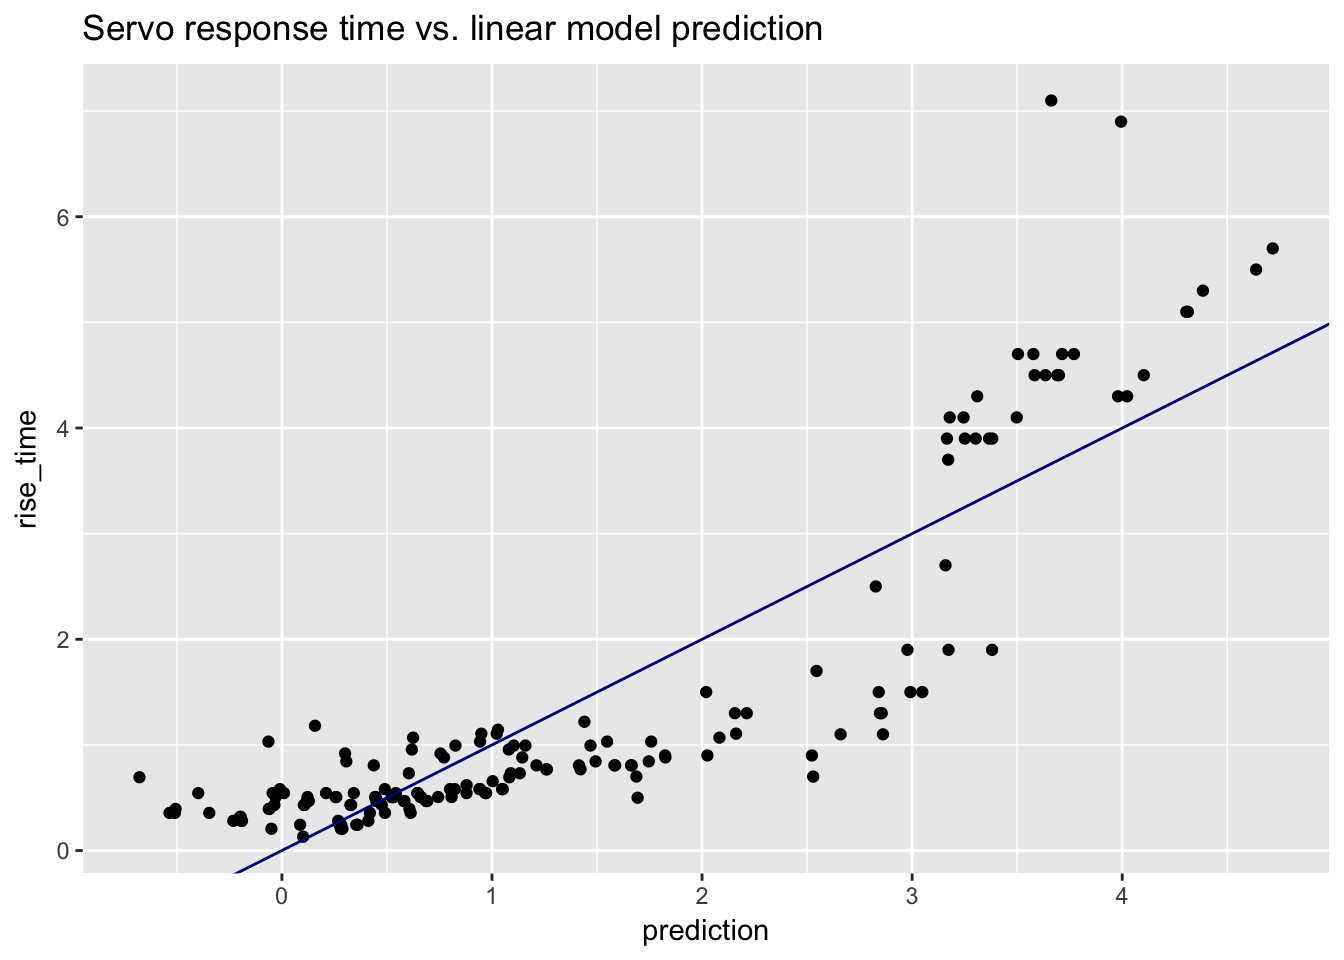
- Points are all on one side of x = y line
- Systematic errors
The Residual Plot
A well fitting model
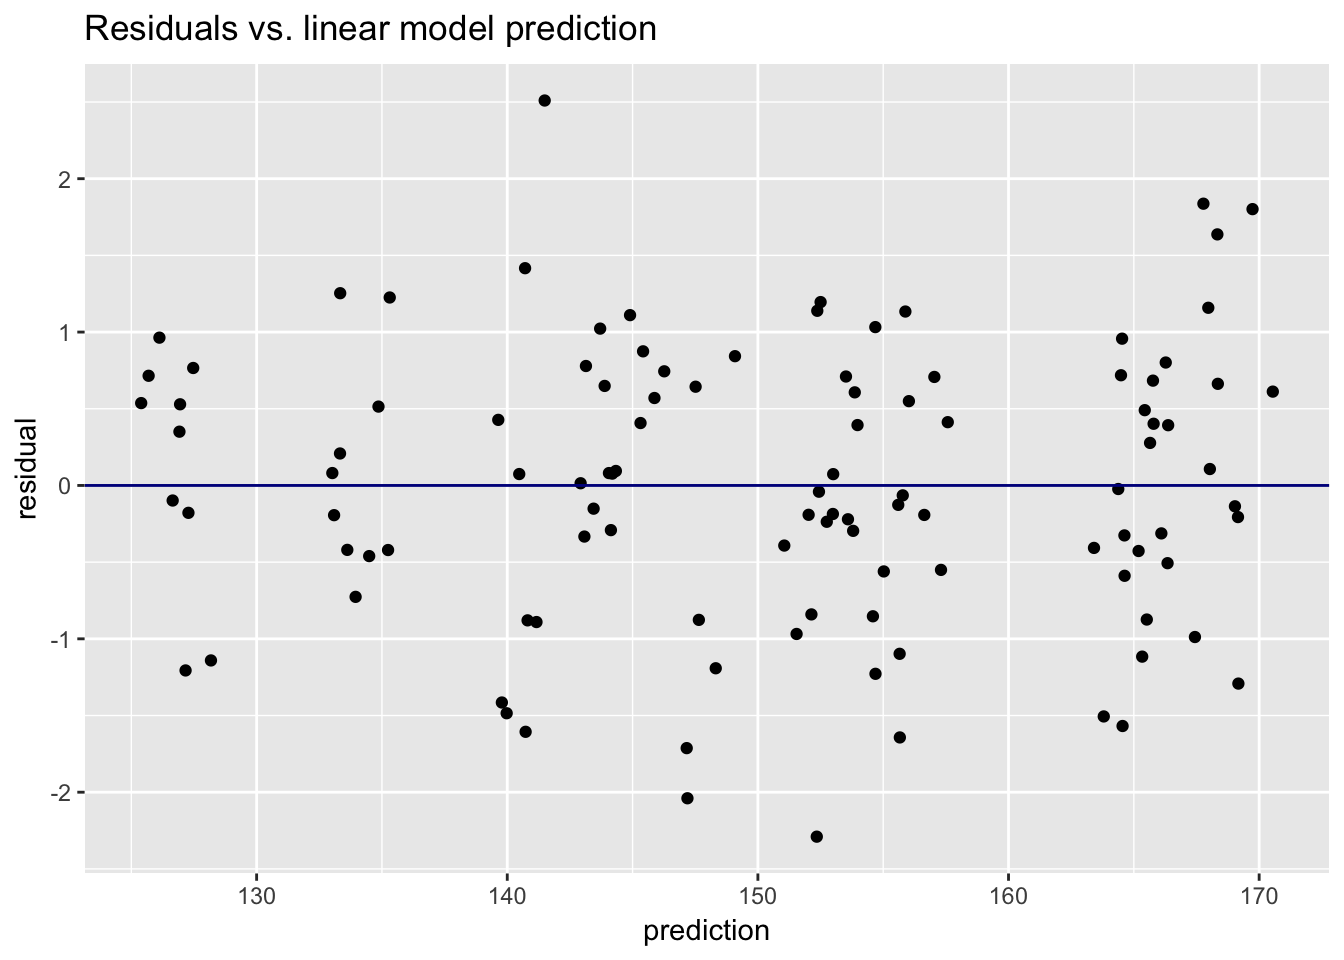
- Residual: actual outcome - prediction
- Good fit: no systematic errors
A poorly fitting model
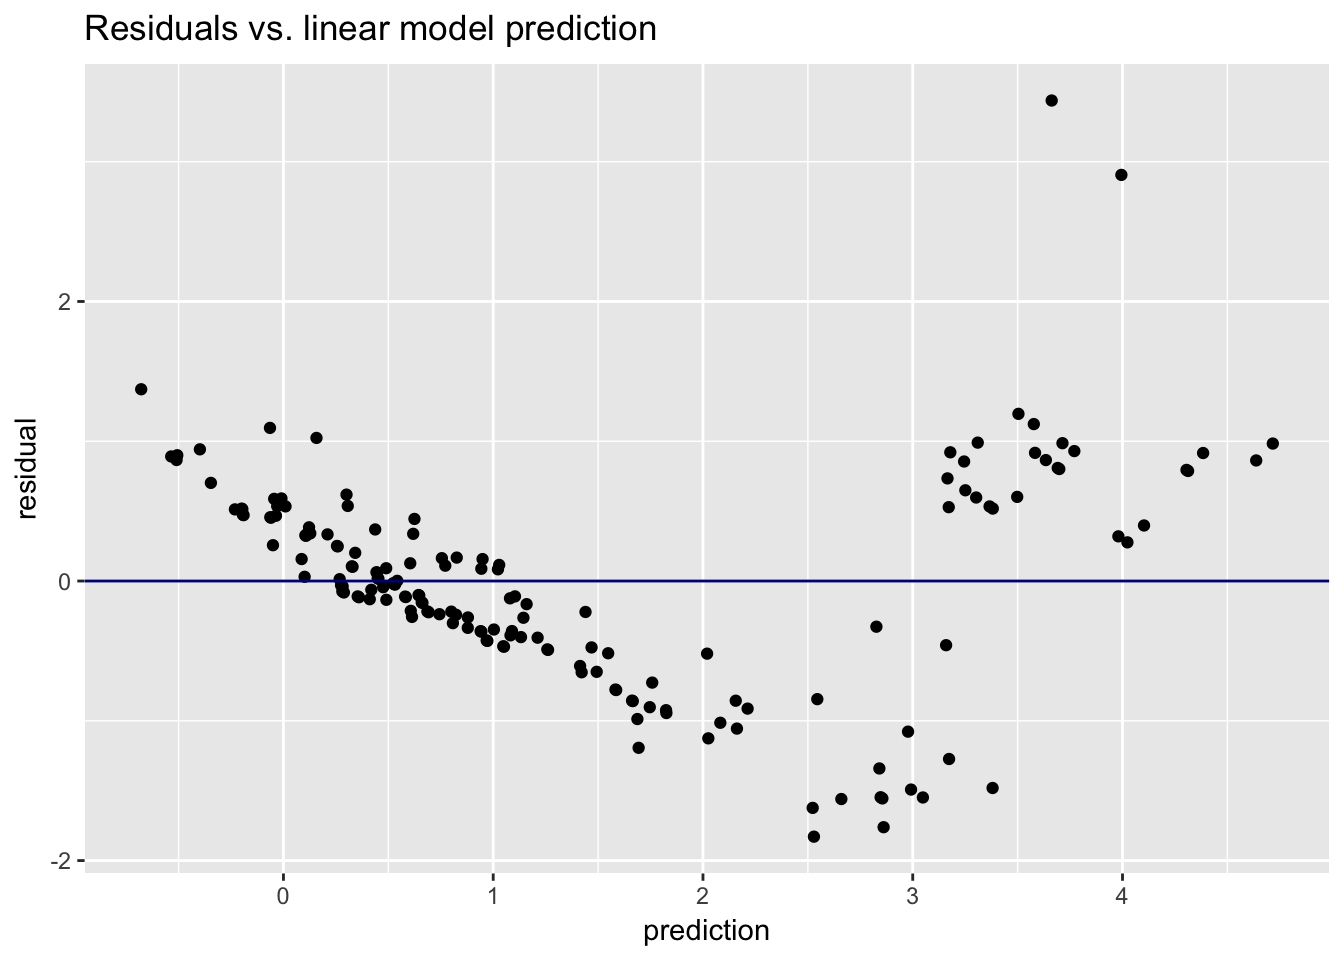
- Systematic errors
The Gain Curve
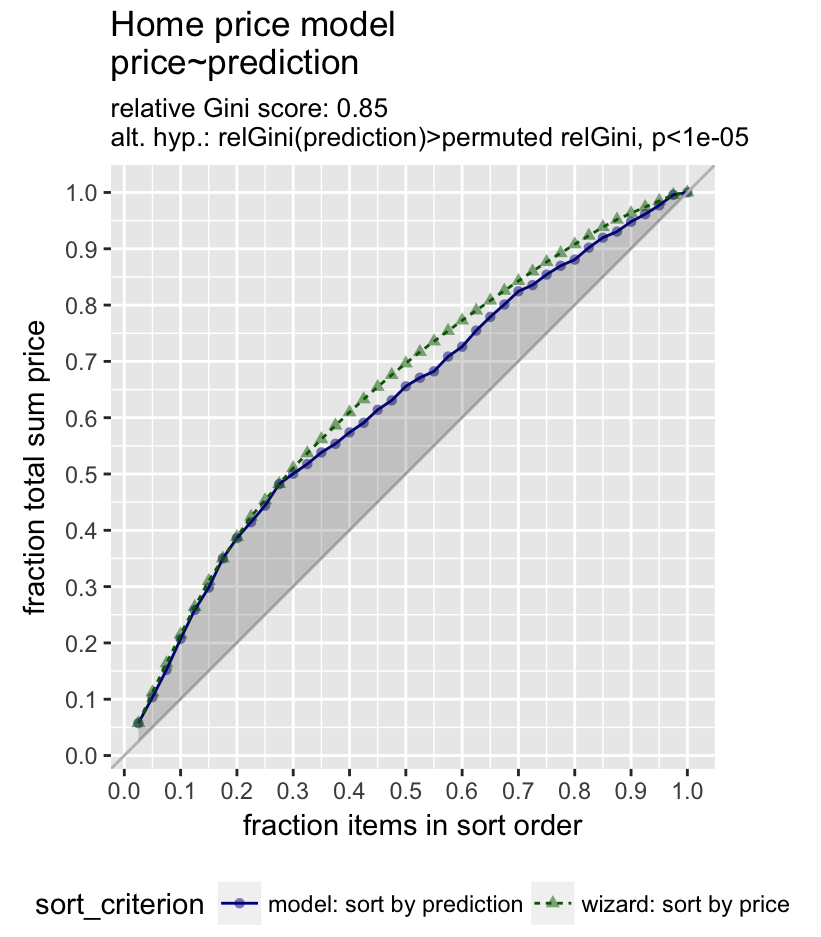
Reading the Gain Curve
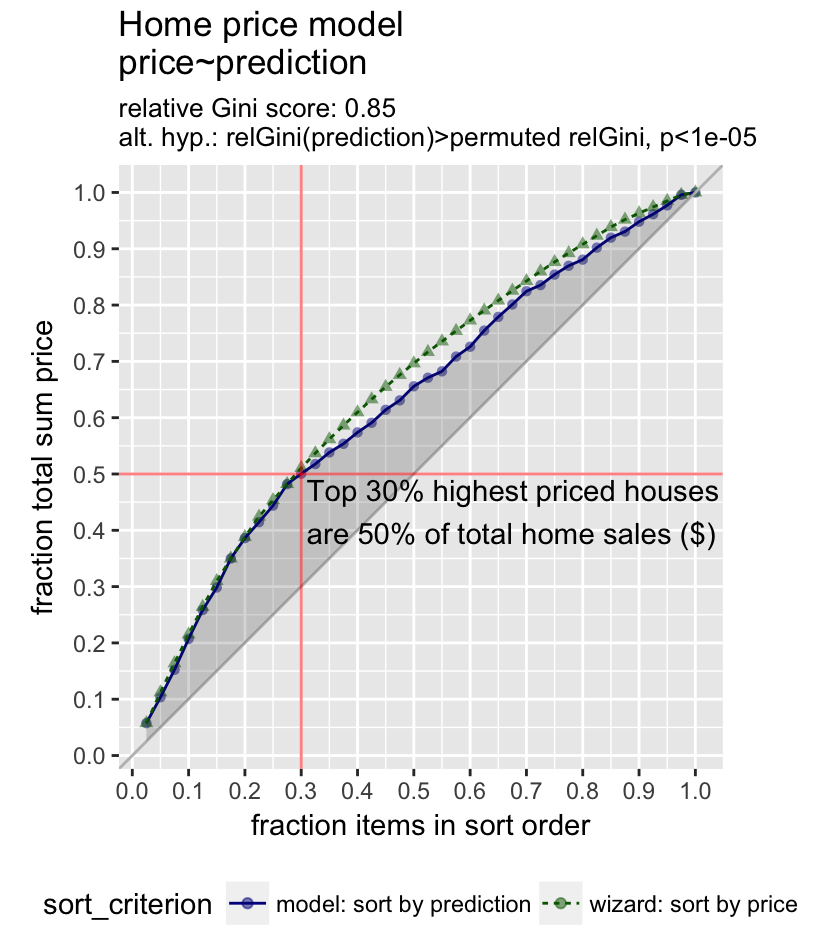
GainCurvePlot(houseprices, "prediction", "price", "Home price model")

