Einführung in die Datenanalyse
Datenanalyse in Excel

Nick Edwards
Analyst at Mynd
Kursinhalte
- Das ist ein Anfängerkurs mit ein paar Themen für Fortgeschrittene.
- Erweiterte PivotTable -Funktionen
- Komplexe logische Funktionen
- Szenarioanalyse und Prognose
- Was du brauchen solltest
- Einführung in Excel
- Datenaufbereitung in Excel
Das ist doch verrückt!
- Als Berater für ein fiktives SaaS-Start-up arbeiten: Bananas
- Software als Dienstleistung (SaaS)
- Analysiere ihre Verkaufsdaten, um Trends zu erkennen und Prognosen zu erstellen.
- Entdecke
Bananas Sales.xlsx
- Juli 2019 – Juni 2021
- Organisiert von
Customer ID und Sales Month
Wo sind die Daten, Kumpel?
- Explorative Datenanalyse (EDA) ist der Prozess, bei dem man versucht, den Datensatz zu verstehen.
- Lerne die Struktur der Daten kennen
- Entdecke Muster oder Fehler
- Beziehungen und Erkenntnisse finden
- Der erste wichtige Schritt für eine gute Analyse
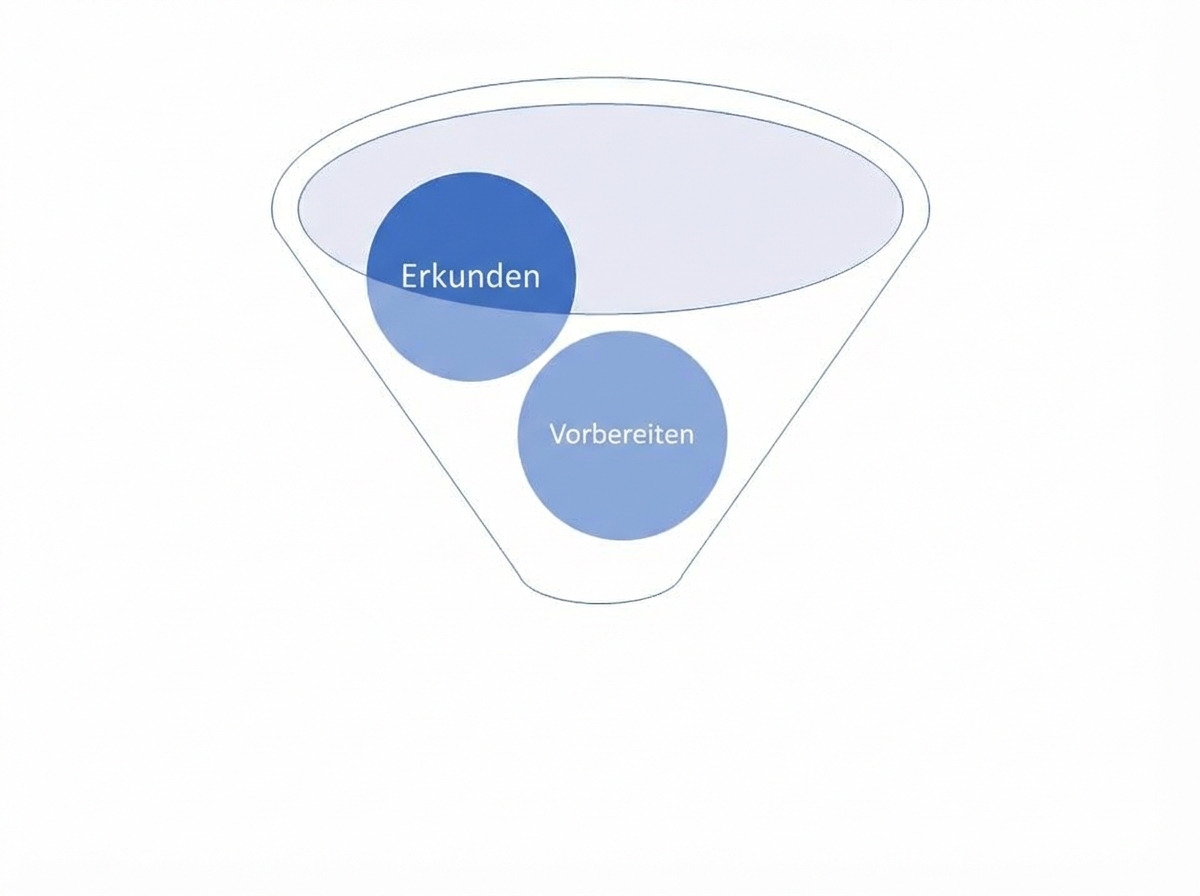
Explorative Datenanalyse durchführen
Explorative Datenanalyse durchführen
- Datenaufbereitung
- Datenexploration
- Lerne die einzelnen Variablen kennen
- Zusammenfassende Statistiken berechnen
- Finde Zusammenhänge und Trends
- Visualisiere die Daten
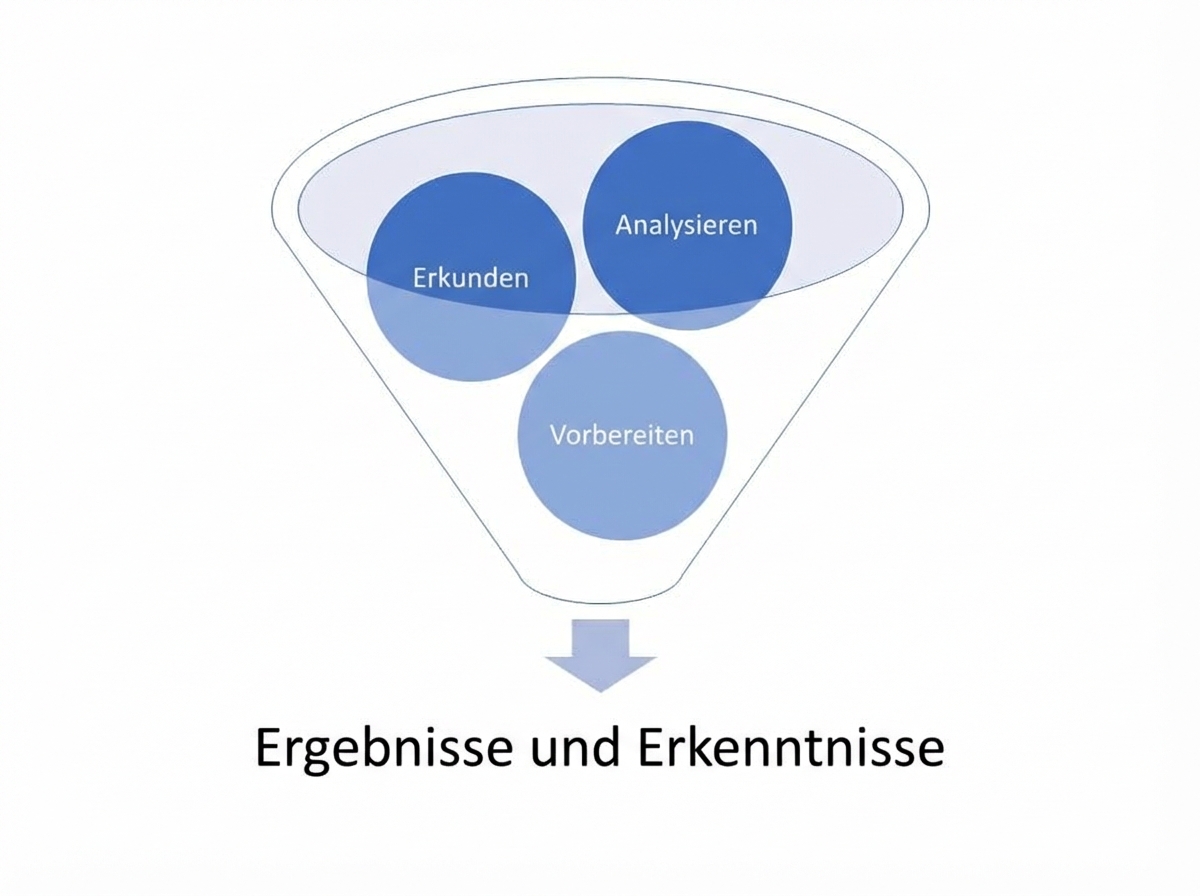
Explorative Datenanalyse durchführen
- Datenaufbereitung
- Datenexploration
- Mehr über jede Variable lernen
- Zusammenfassende Statistiken berechnen
- Korrelationen und Trends finden
- Daten visualisieren
- Hypothesenbildung und weitere Analyse
- z. B. Die Verkäufe sollten mit der Zeit steigen.
Zusammenfassende Statistiken
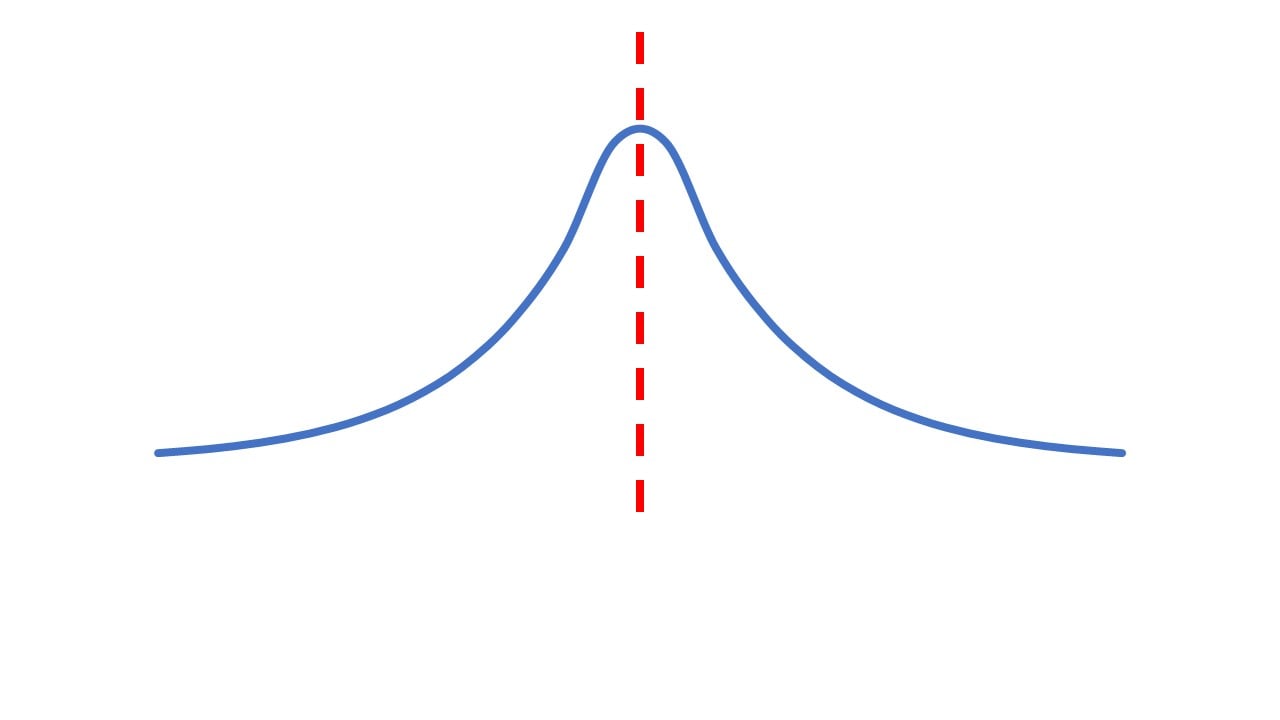
- Maße der zentralen Tendenz ermitteln den Mittelpunkt des Datensatzes.
- Mittelwert: der Durchschnittswert
- Median: der Mittelwert
- Modus: der häufigste Wert
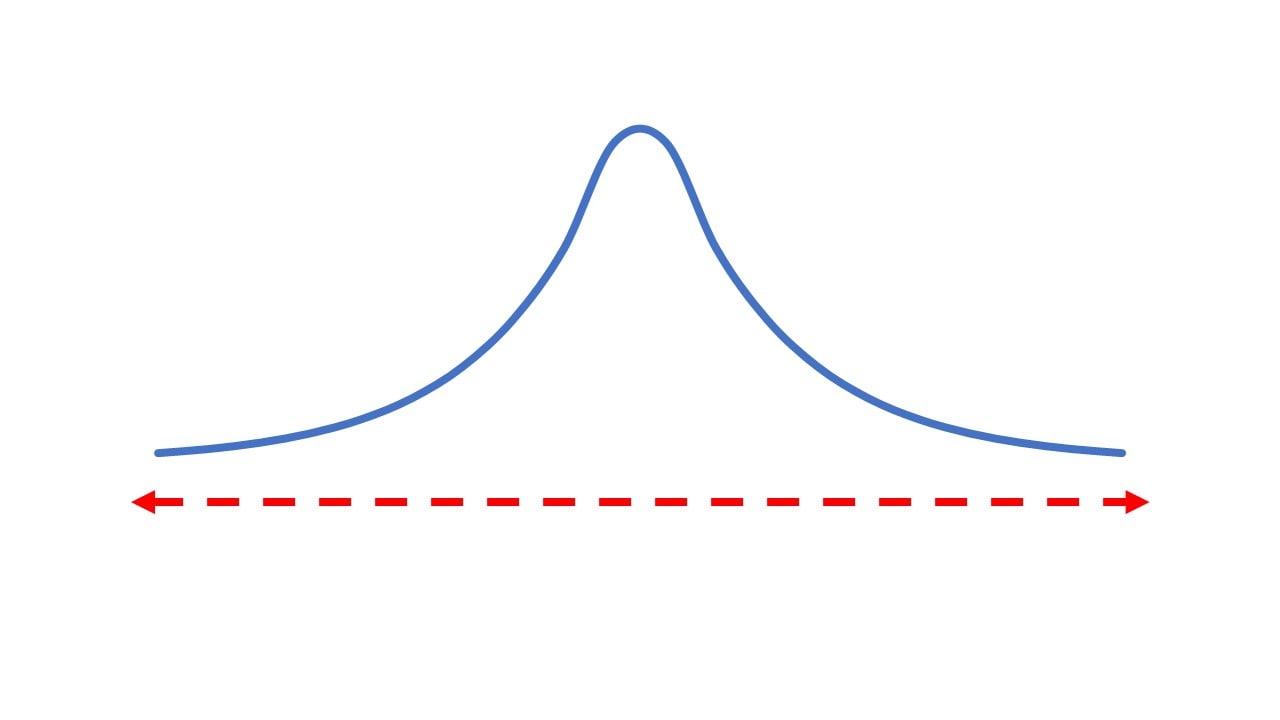
- Bereich: Unterschied zwischen dem Maximal- und Minimalwert
Lass uns üben!
Datenanalyse in Excel
 Preparing Video For Download...