Sensitivity analysis
Financial Analysis in Power BI

Nick Edwards
Capital Markets Analyst
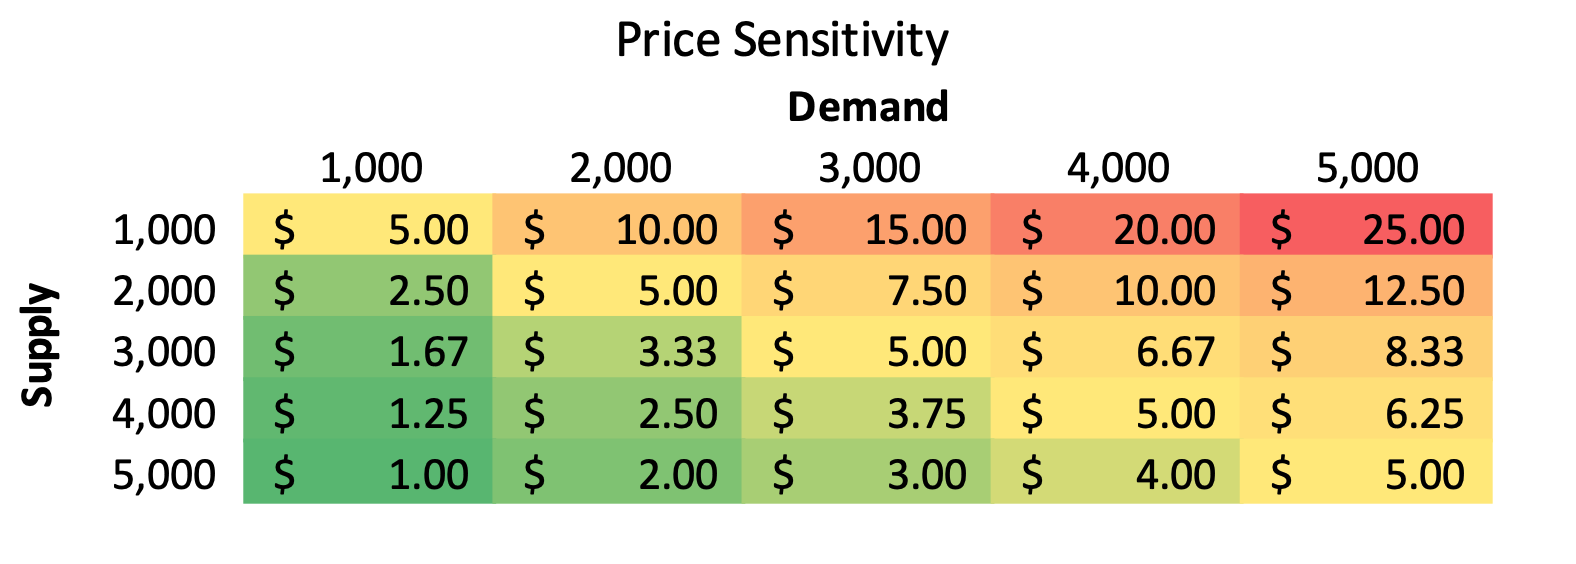
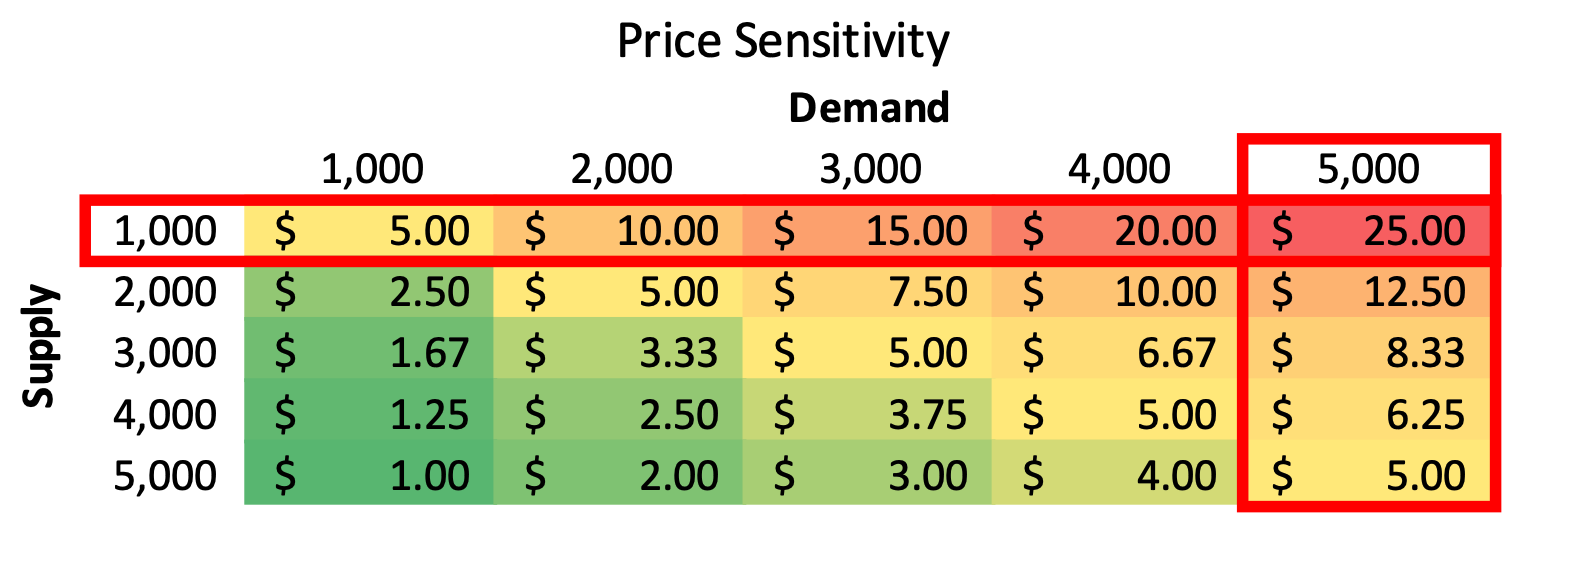
Sensitivity table
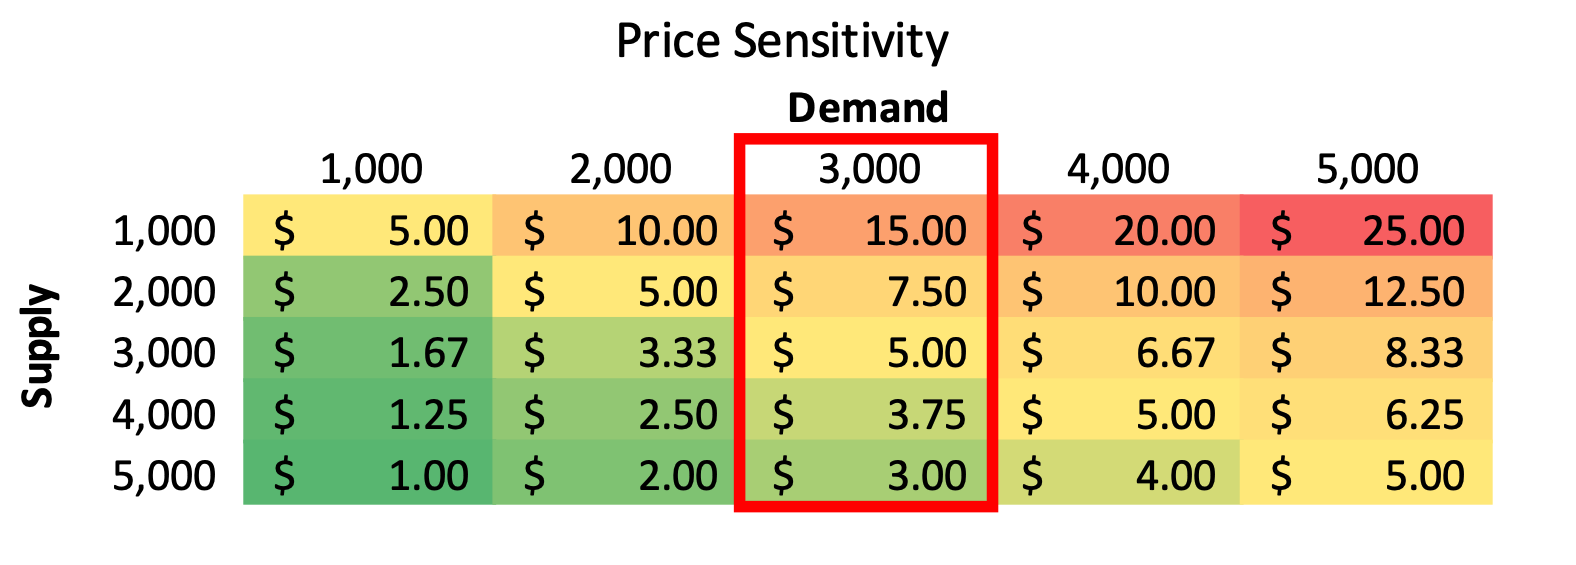
Sensitivity table
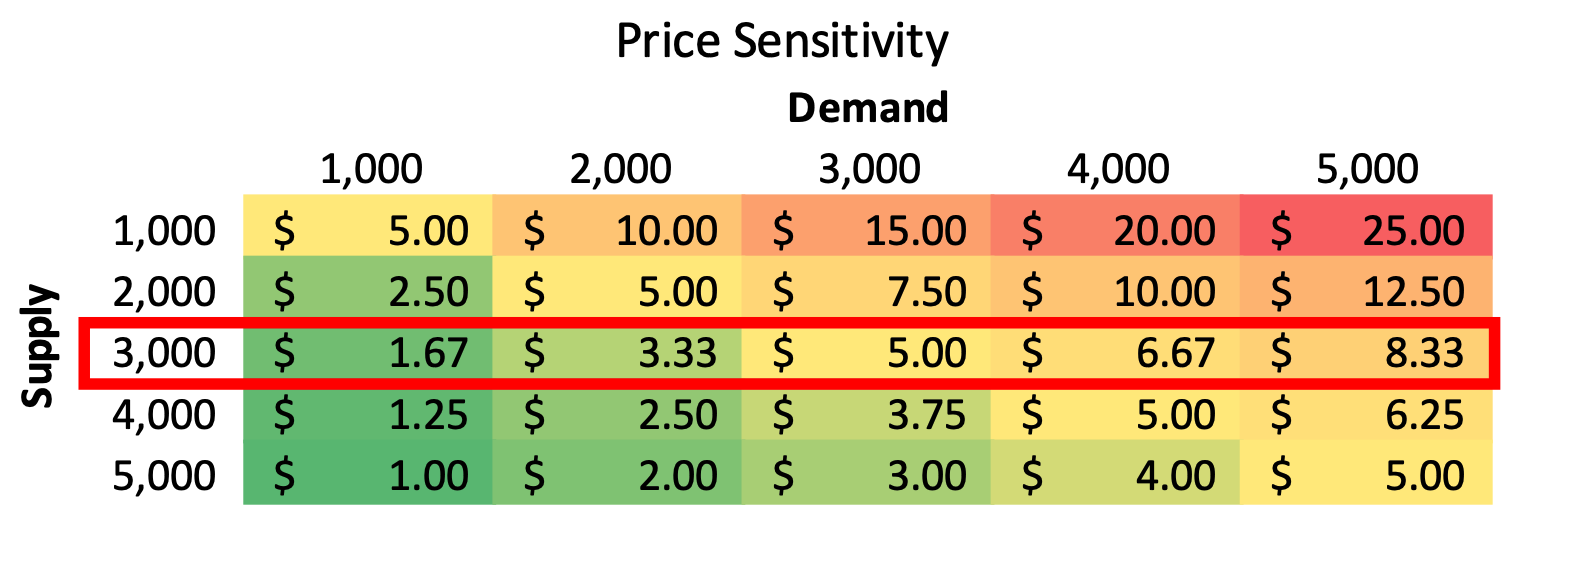
Sensitivity table
Sensitivity table
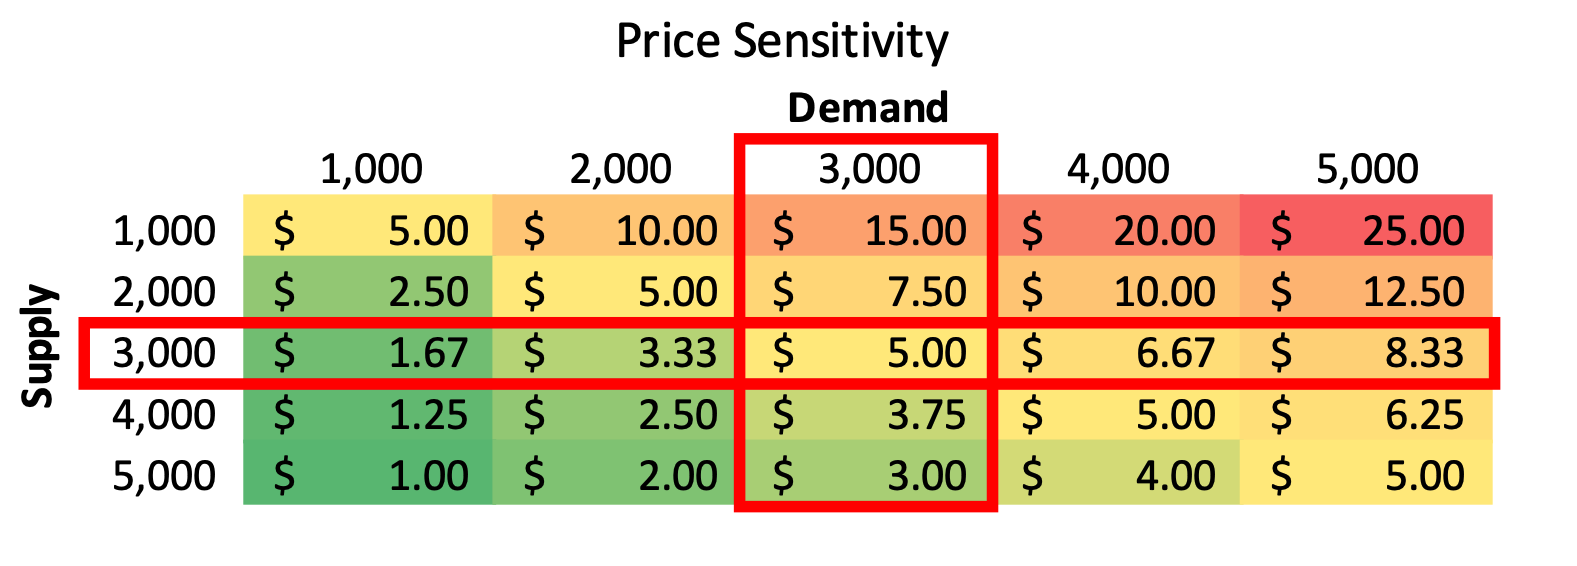
Sensitivity table
Financial Analysis in Power BI
Nick Edwards
Capital Markets Analyst

