Internal rate of return and payback period
Financial Analysis in Power BI

Nick Edwards
Capital Markets Analyst
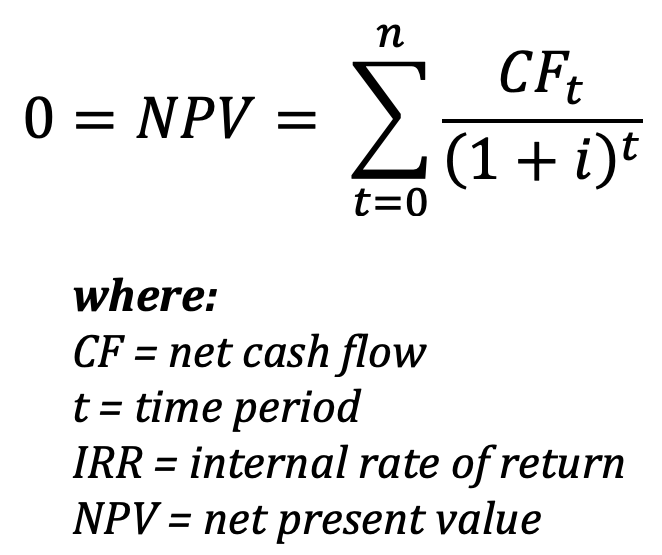
Internal rate of return (IRR)
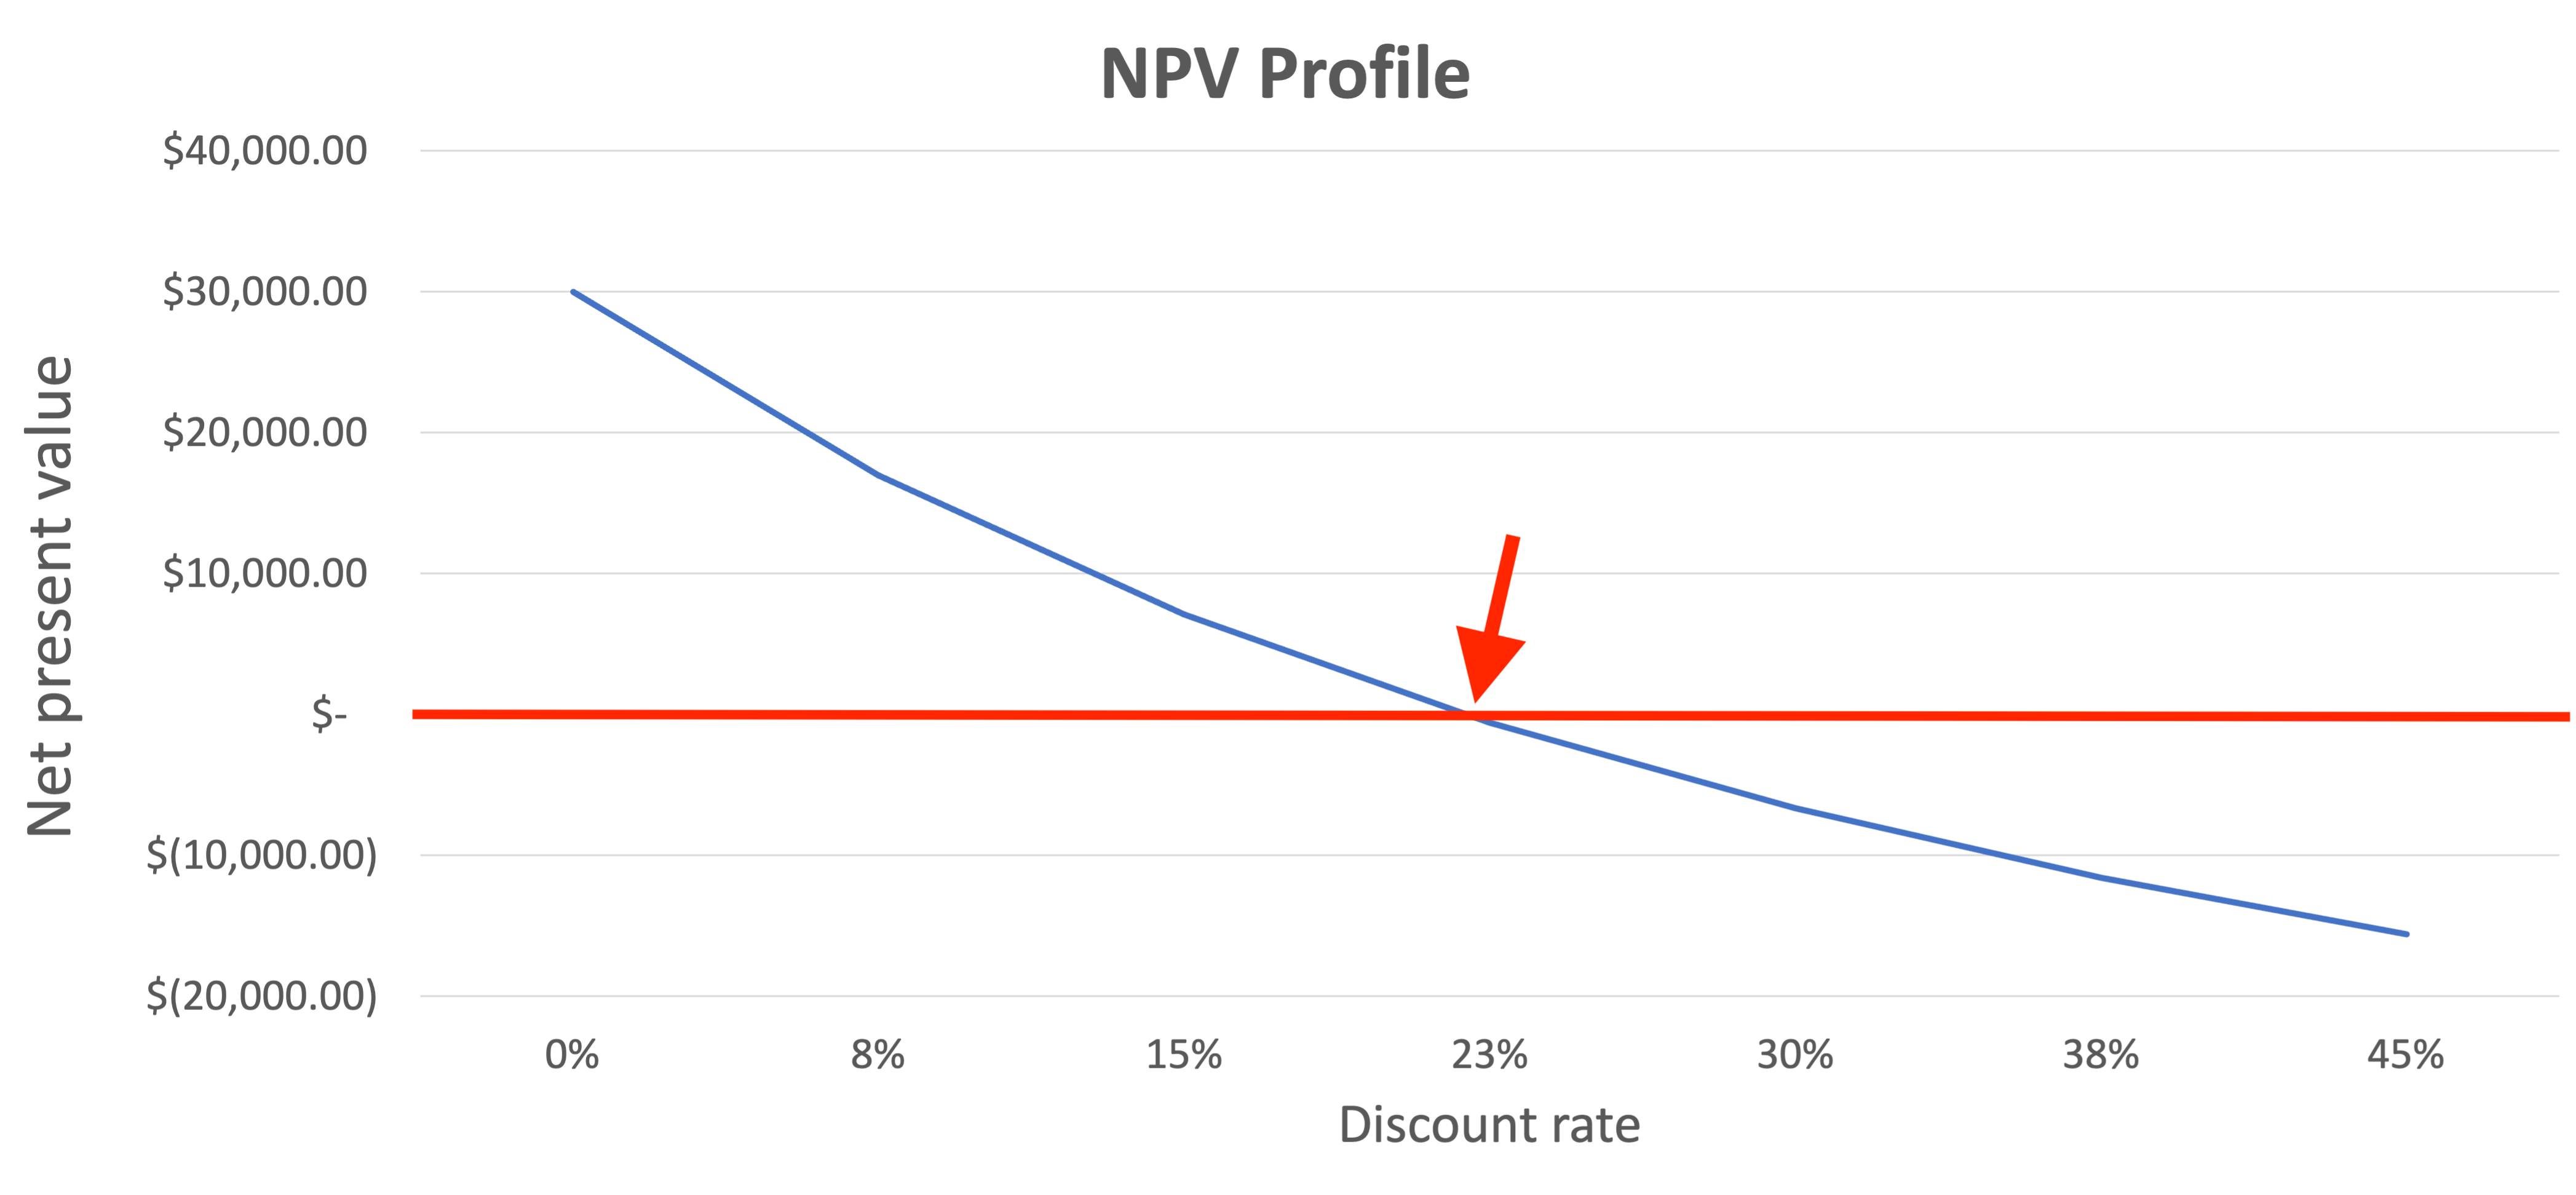
Internal rate of return (IRR)
1 https://www.investopedia.com/terms/i/irr
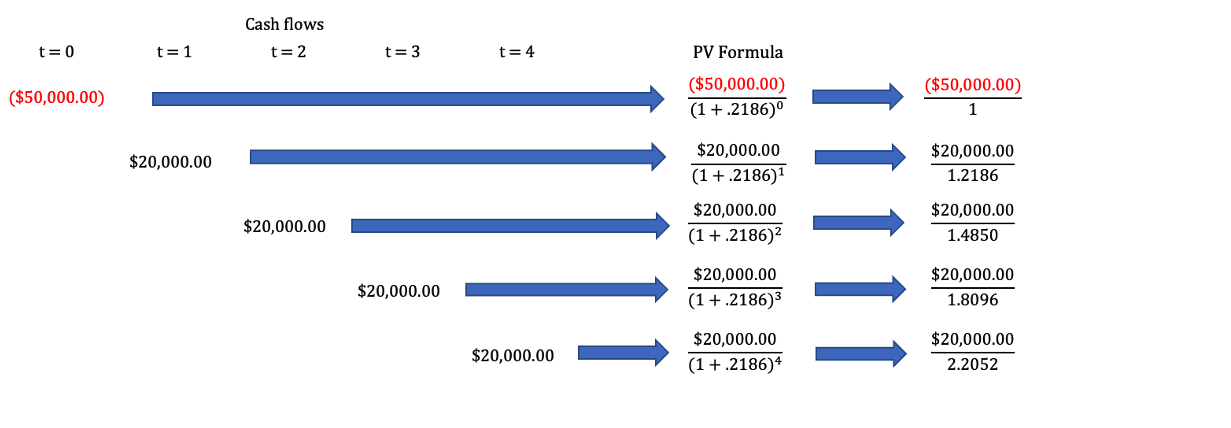
Testing the IRR
Let's say XIRR gives us 21.86% for this cash flow...

Testing the IRR
Let's say XIRR gives us 21.86% for this cash flow...
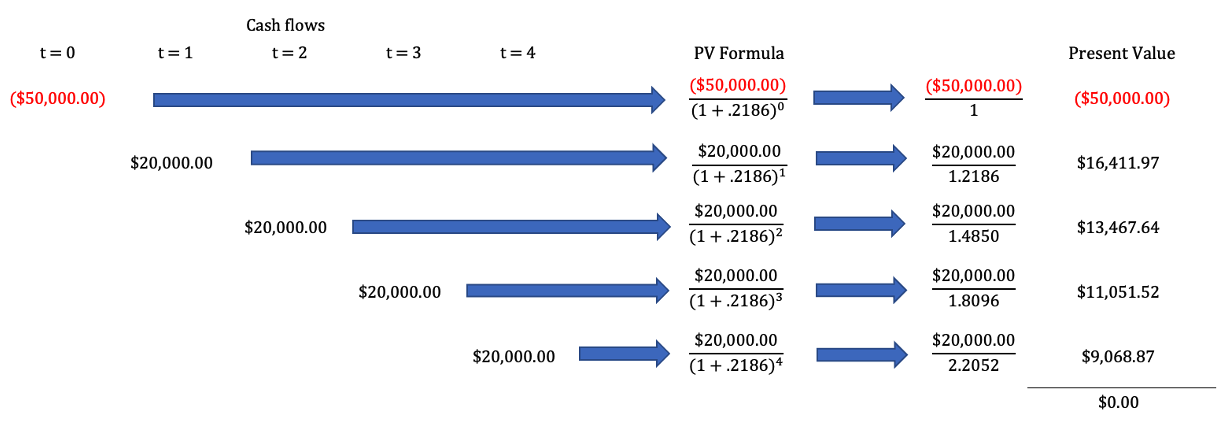
Testing the IRR
Let's say XIRR gives us 21.86% for this cash flow...
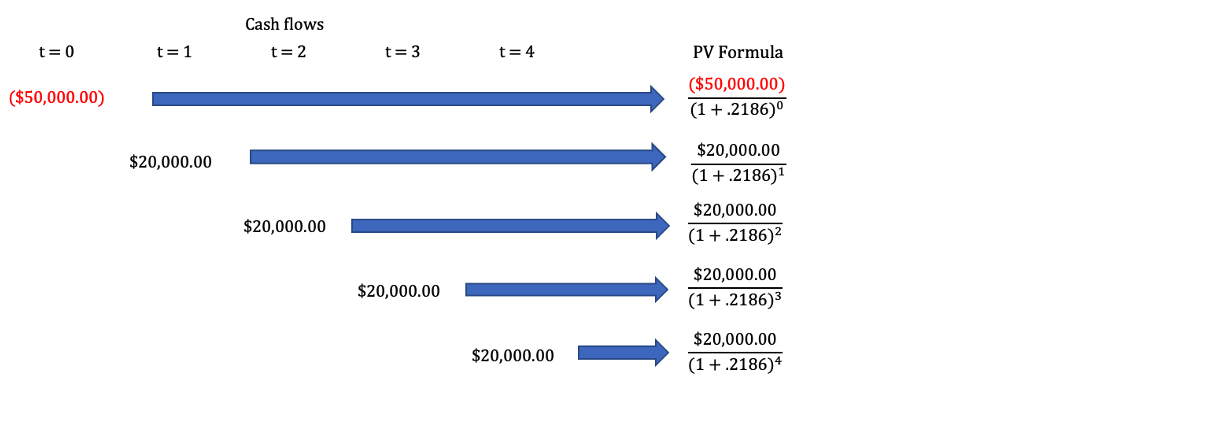
Testing the IRR
Let's say XIRR gives us 21.86% for this cash flow...