Capital Budgeting
Financial Analysis in Power BI

Nick Edwards
Capital Markets Analyst
What is capital budgeting?

Net present value (NPV)
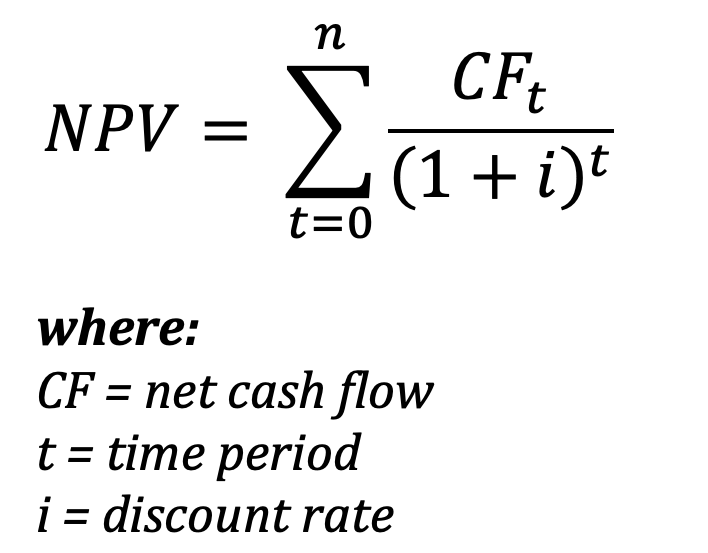
1 https://www.investopedia.com/terms/n/npv.asp
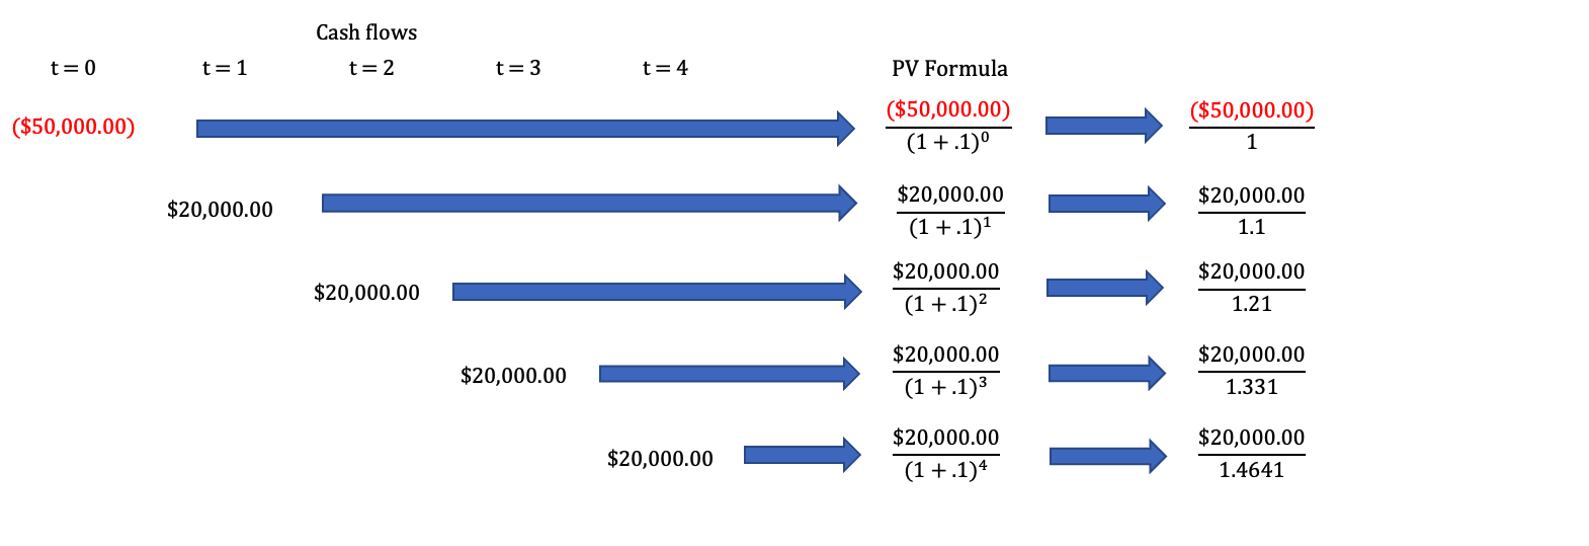
Net present value (NPV)

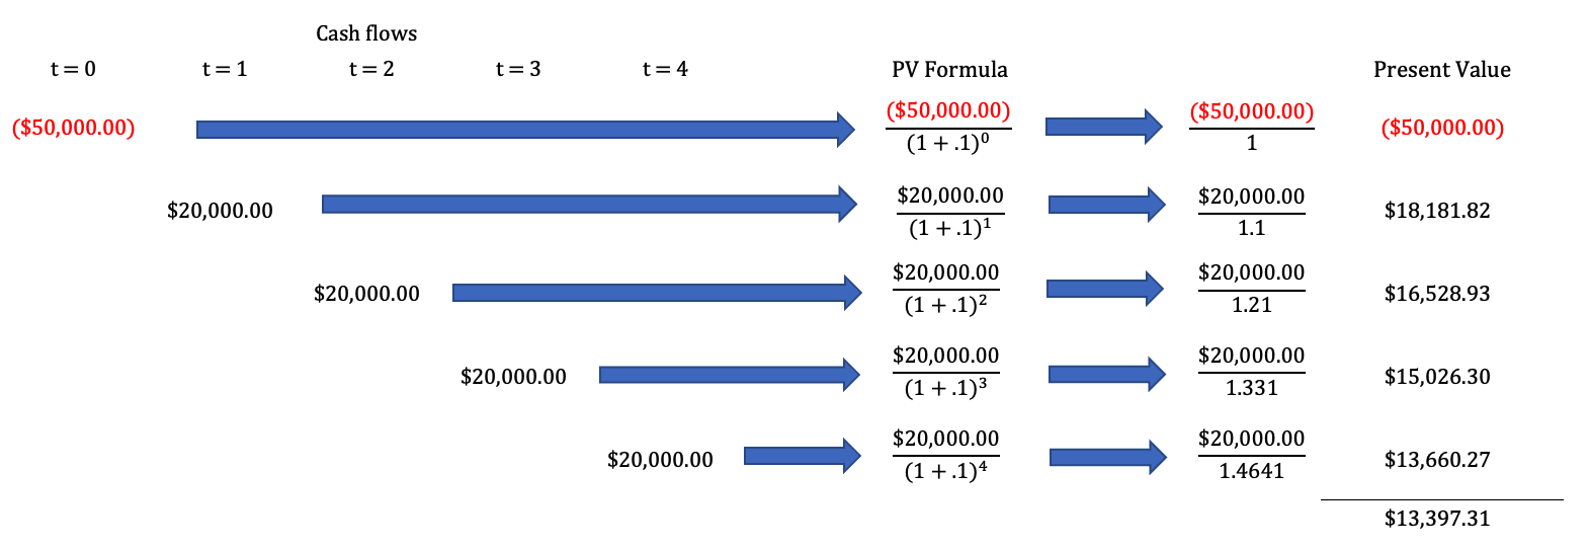
Net present value (NPV)
Net present value (NPV)
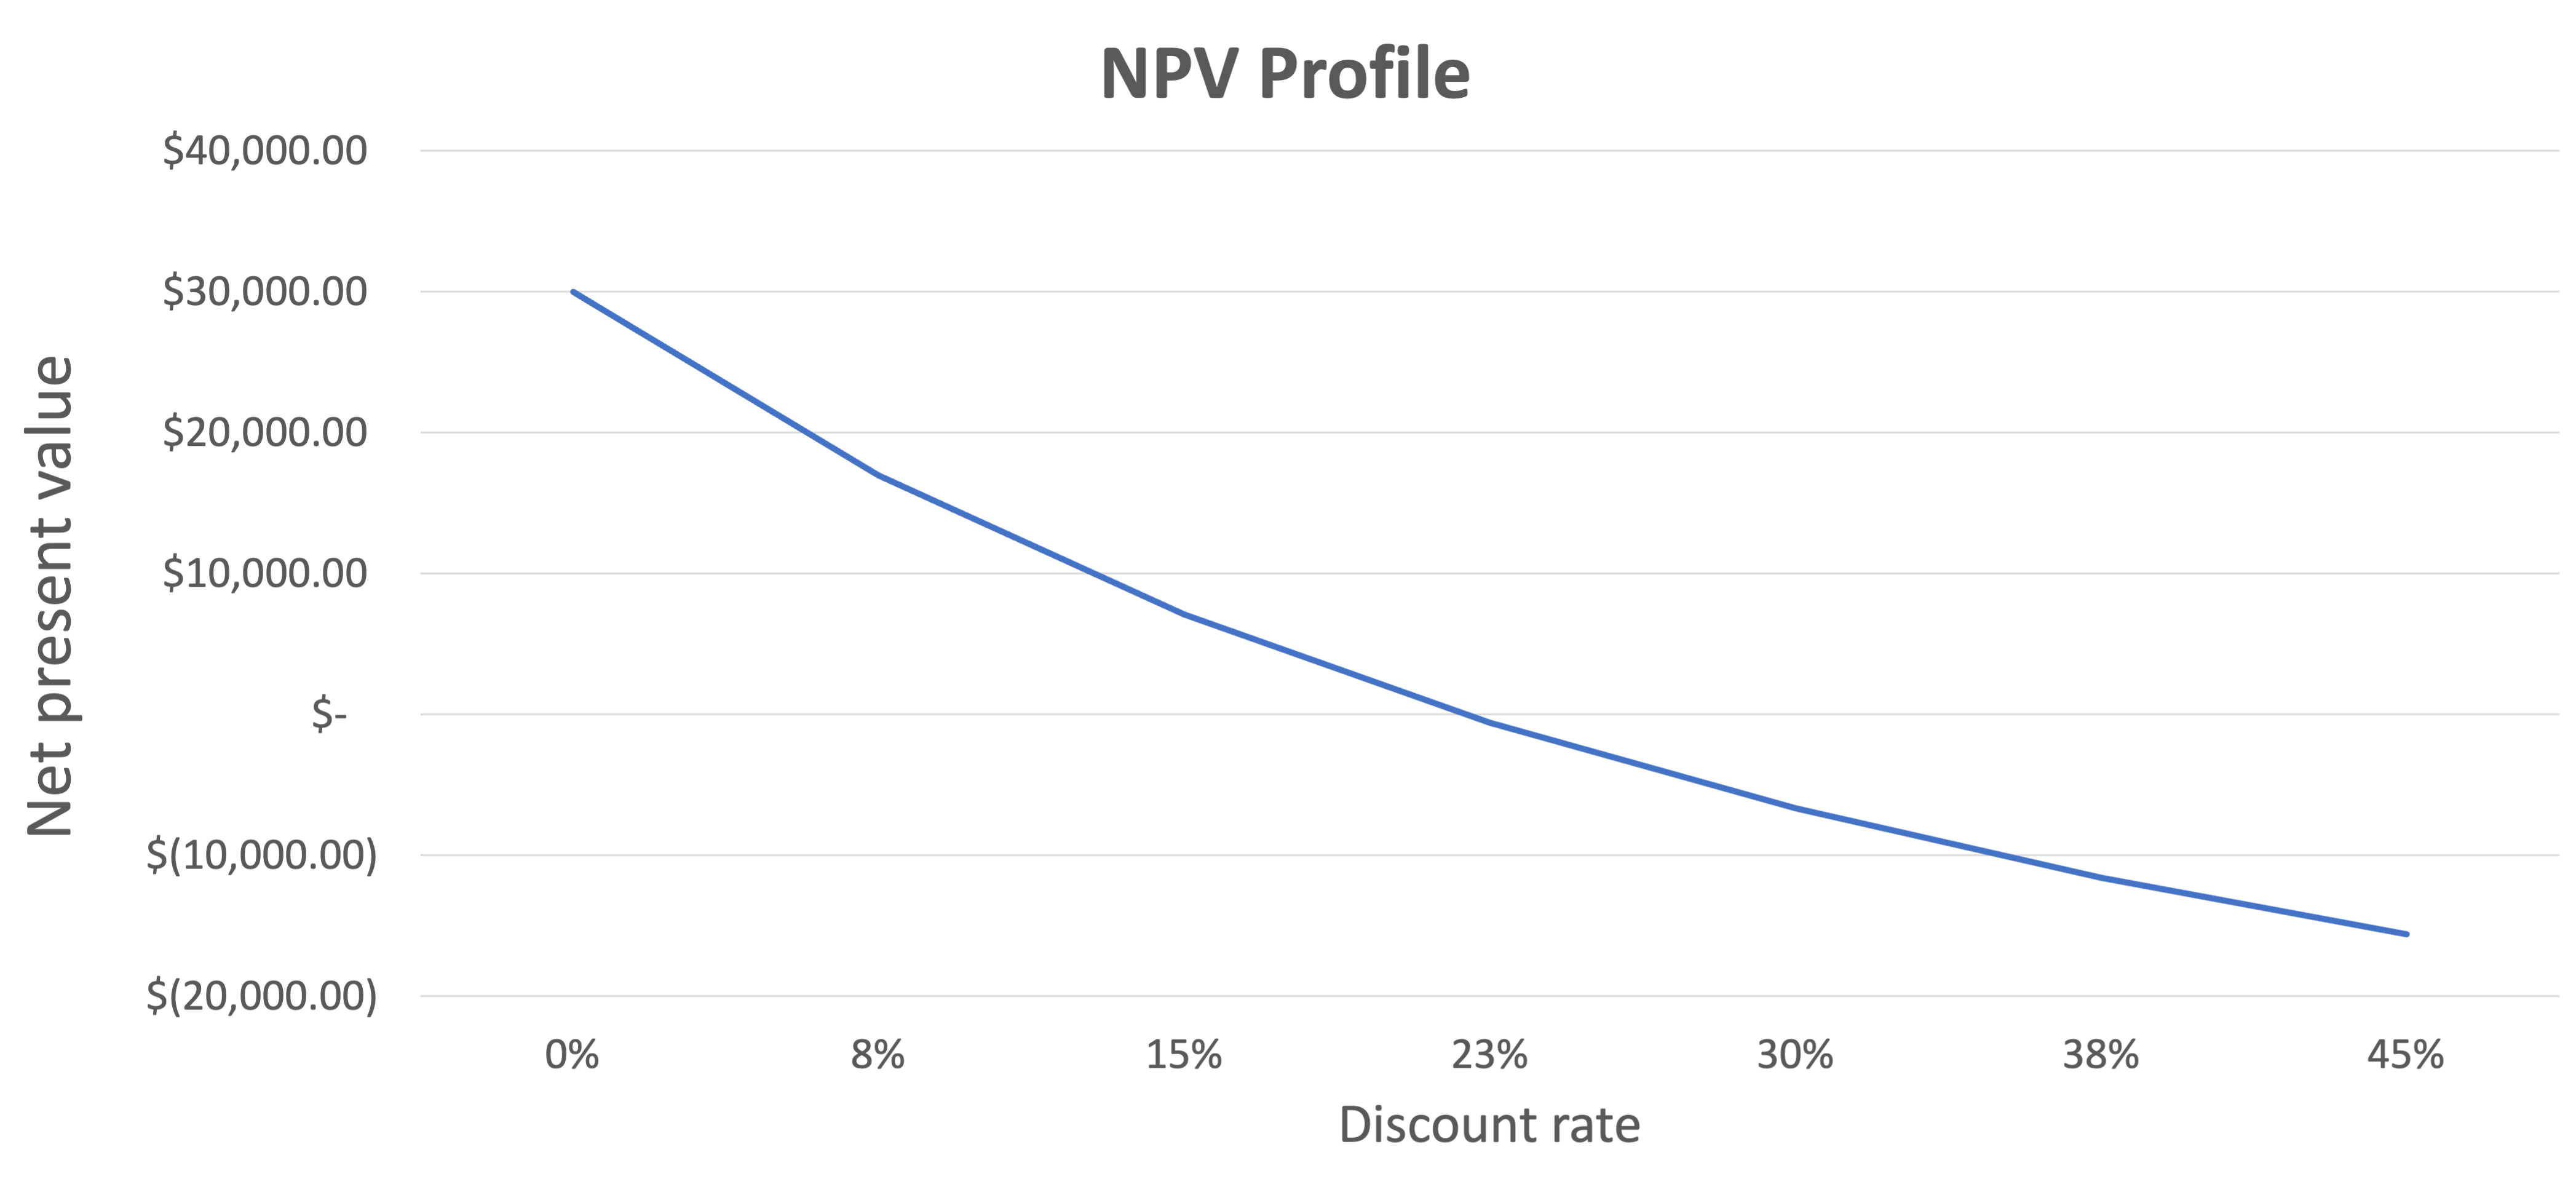
Discount rates and NPV
Profitability index (PI)
- Profitability index is a ratio of NPV that gives dollar earned per dollar spent
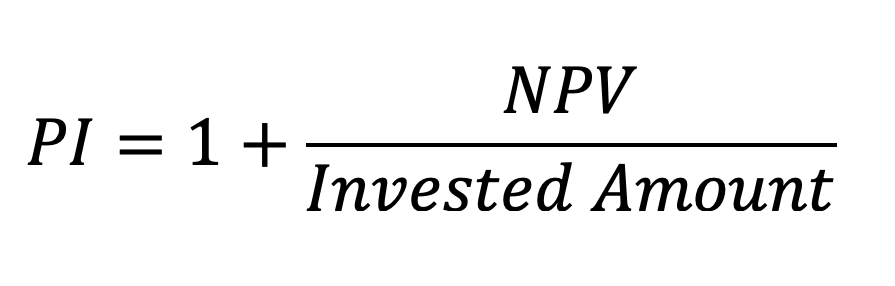
- Useful in prioritizing projects when capital is limited
- Anything less than one should not be undertaken (NPV would be negative)
1 https://www.investopedia.com/terms/p/profitability.asp
Choosing the right project