Financial Dashboards

Financial Analysis in Power BI

Nick Edwards

Capital Markets Analyst

Expectations

  • This is an intermediate course
    • Familiar with DAX, Data Modeling and Visualizations in Power BI
  • Prerequisites

    1. Intermediate DAX in Power BI
    2. Data Modeling in Power BI
  • No finance experience needed!

Financial Analysis in Power BI

Spaero Technology

Two people reviewing the blueprint for an airplane part.

1 Photo by @thisisengineering on Unsplash
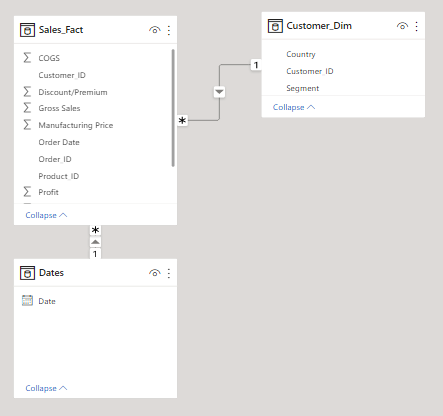
Financial Analysis in Power BI

The data

  • Sales data from 2015 - 2021
  • Follows a "Star Schema"
    • Sales_Fact
    • Customer_Dim
    • Dates

The data shown from the modeling view. It shows the Sales_Fact, Customer_Dim, and Dates tables joined together in a star schema.

Financial Analysis in Power BI

Key performance indicators (KPIs)

Financial analysis examines the financial performance of an asset or company to drive decision making and set goals.

Key Performance Indicators (KPIs)

  • KPIs depend on the audience and business goals
    • Collaboration is key!

A business professional writes down meeting notes.

1 Photo by Luke Southern on Unsplash
Financial Analysis in Power BI

Objectives and key results (OKRs)

  1. The objective is the main business goal and focus.
  2. Key results specify the results of the objective and set benchmarks.
  3. Initiatives are the individual tasks to achieve the key results.

A diagram of objectives and key results. Objective is at the top, with three key results branching from the Objective, and three initiatives branching from each key result.

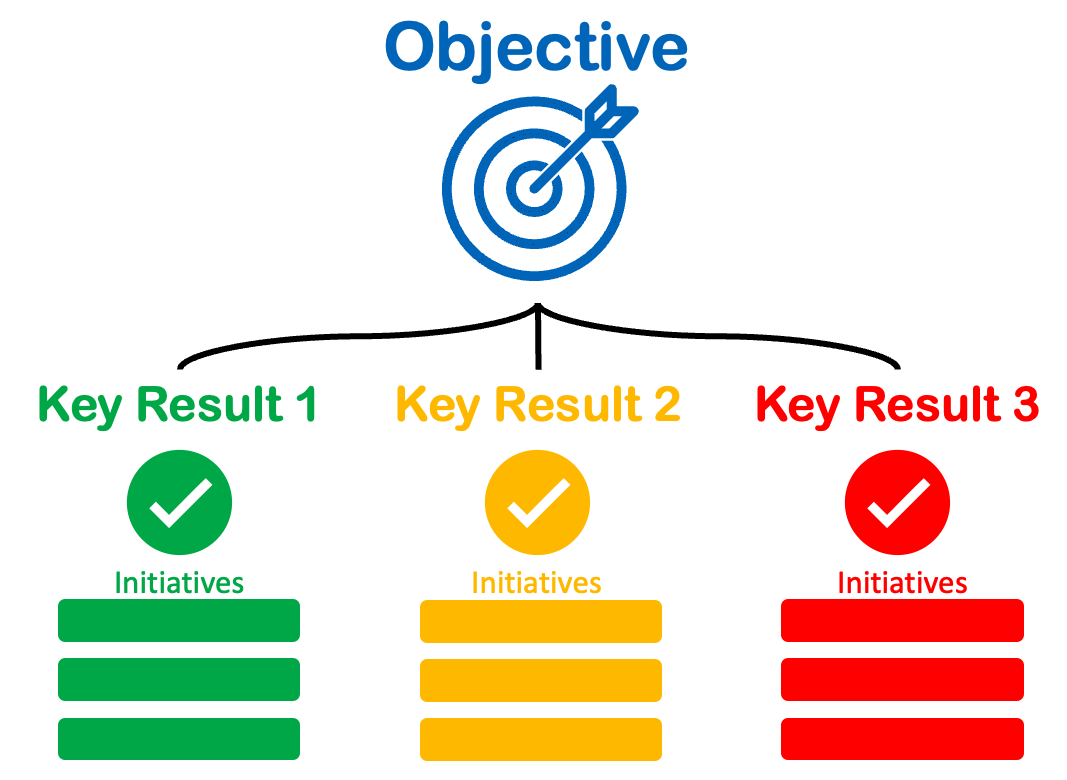
1 https://businessanalystmentor.com/okr/
Financial Analysis in Power BI

Objectives and key results (OKRs)

  1. The objective is the main business goal and focus.
  2. Key results specify the results of the objective and set benchmarks.
  3. Initiatives are the individual tasks to achieve the key results.

A diagram of objectives and key results. The objective is to make our customers happier by Q4. Key result 1 is to improve our NPS score by 10 points; key result 2 is to receive an average of 4.5 call center rate; and key result 3 is to create 3 proposals from trending reviews. Each key result has specific three initiatives.

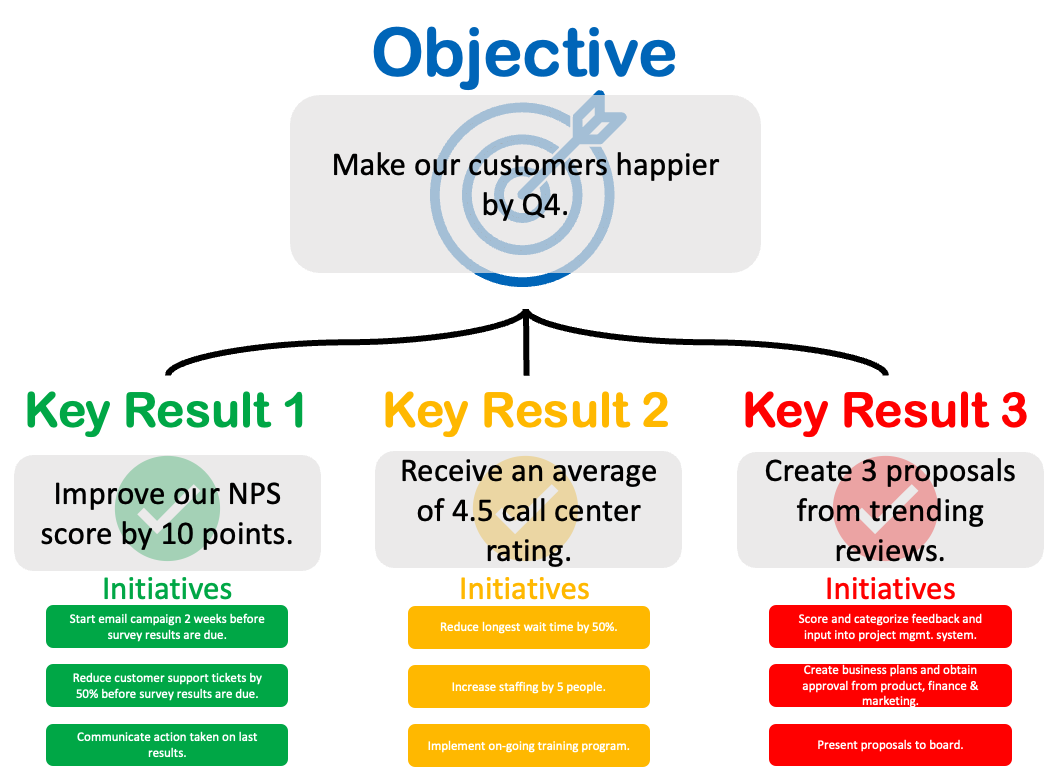
1 https://www.perdoo.com/how-to-write-great-okrs/
Financial Analysis in Power BI

Profitability

Black and white portrait of Milton Friedman.

"The social responsibility of business is to increase its profits." - Milton Friedman

1 Photo by The Friedman Foundation for Educational Choice
Financial Analysis in Power BI

Profitability

Net Income

Net income equals revenue minus expenses.

  • Revenue is income earned
  • Expenses are money paid

Levels of profitability

  • Net income > 0 = profit
  • Net income < 0 = loss
  • Net income = 0 = break-even
Financial Analysis in Power BI

Profitability

Net Income

Net income equals revenue minus expenses.

  • Revenue is income earned
  • Expenses are money paid

Levels of profitability

  • Net income > 0 = profit
  • Net income < 0 = loss
  • Net income = 0 = break-even

Profit Margin

Profit margin equals net income divided by revenue.

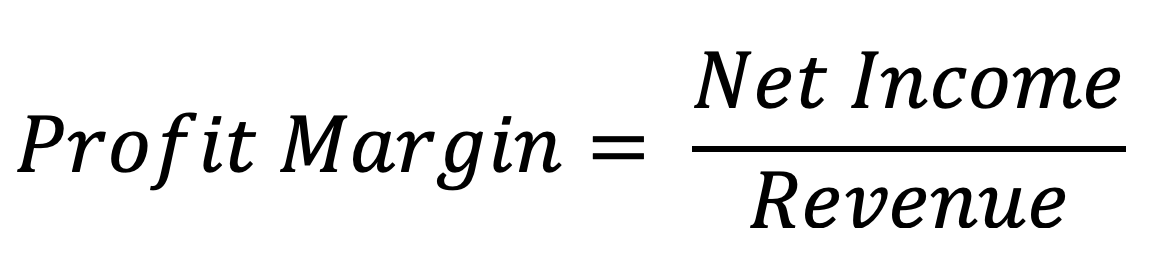
  • Commonly used in business
  • Ratios are useful in comparisons because they ignore size
Financial Analysis in Power BI

Other common KPIs

  • There are endless amounts of KPIs!
    • Total Revenue
    • Revenue per Customer
    • Revenue Growth
    • Client Retention
    • Customer Satisfaction
Financial Analysis in Power BI

Let's practice!

Financial Analysis in Power BI

Preparing Video For Download...