Introducción a los gráficos categóricos con Seaborn
Trabajar con datos categóricos en Python

Kasey Jones
Research Data Scientist
Box plot
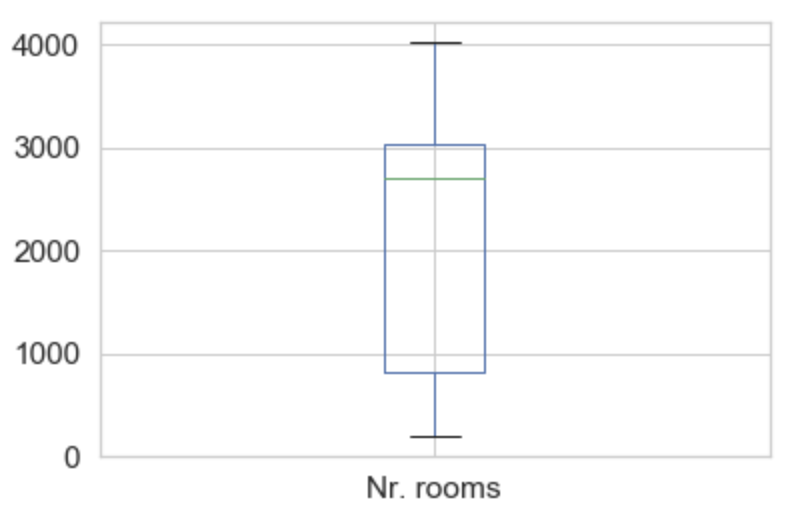
Ejemplo de box plot
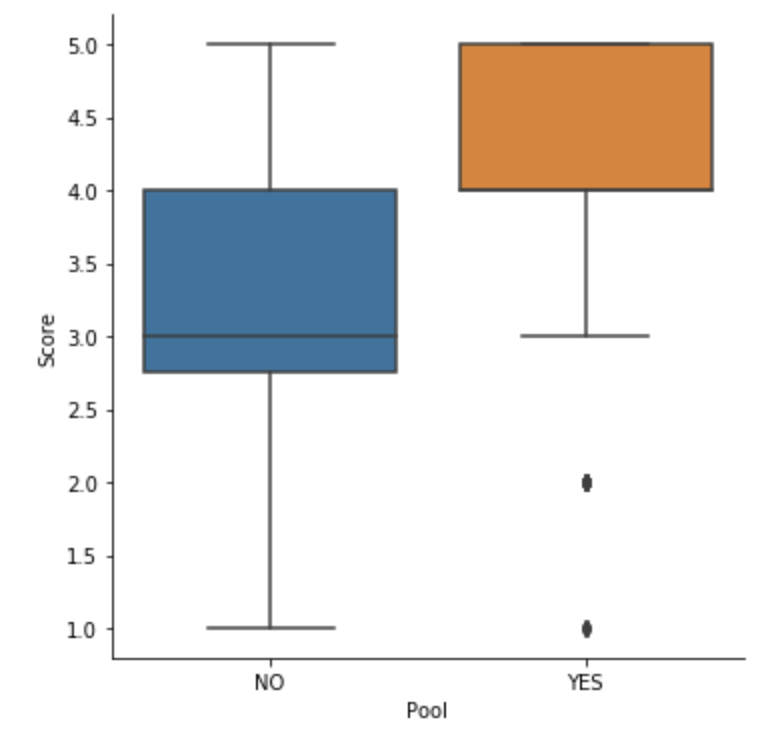
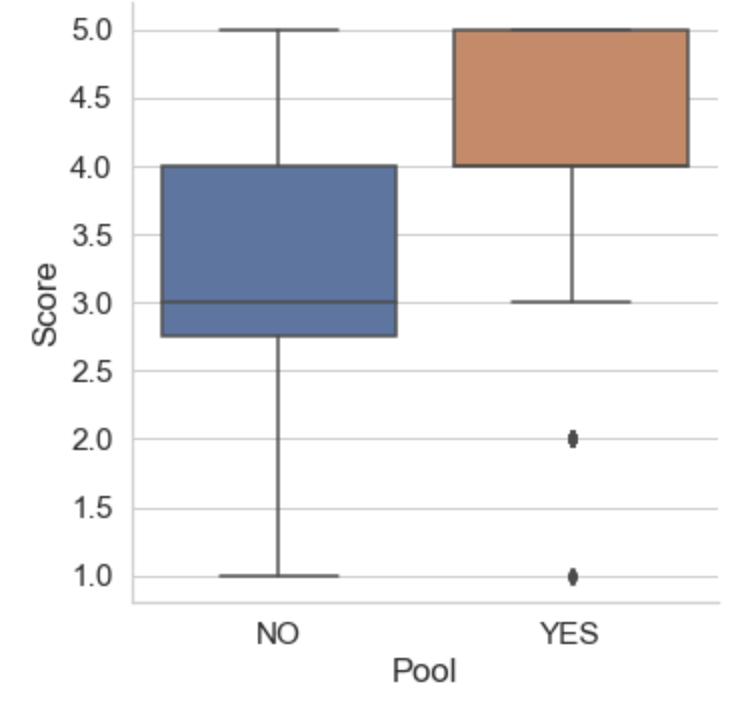
Dos opciones rápidas
Trabajar con datos categóricos en Python
Kasey Jones
Research Data Scientist

