Opções extras do catplot()
Trabalhando com dados categóricos em Python

Kasey Jones
Research Data Scientist
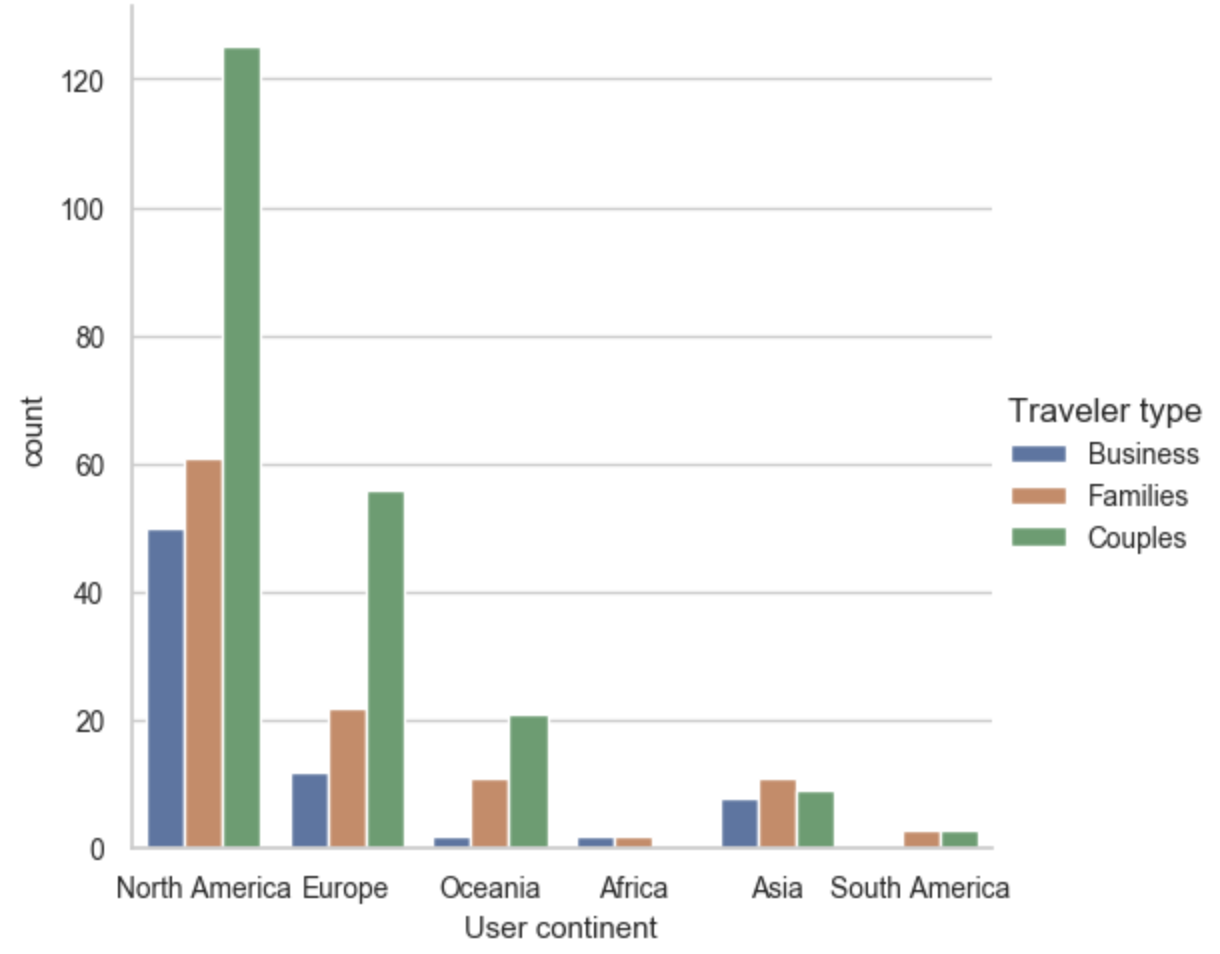
Dificuldades com gráficos categóricos
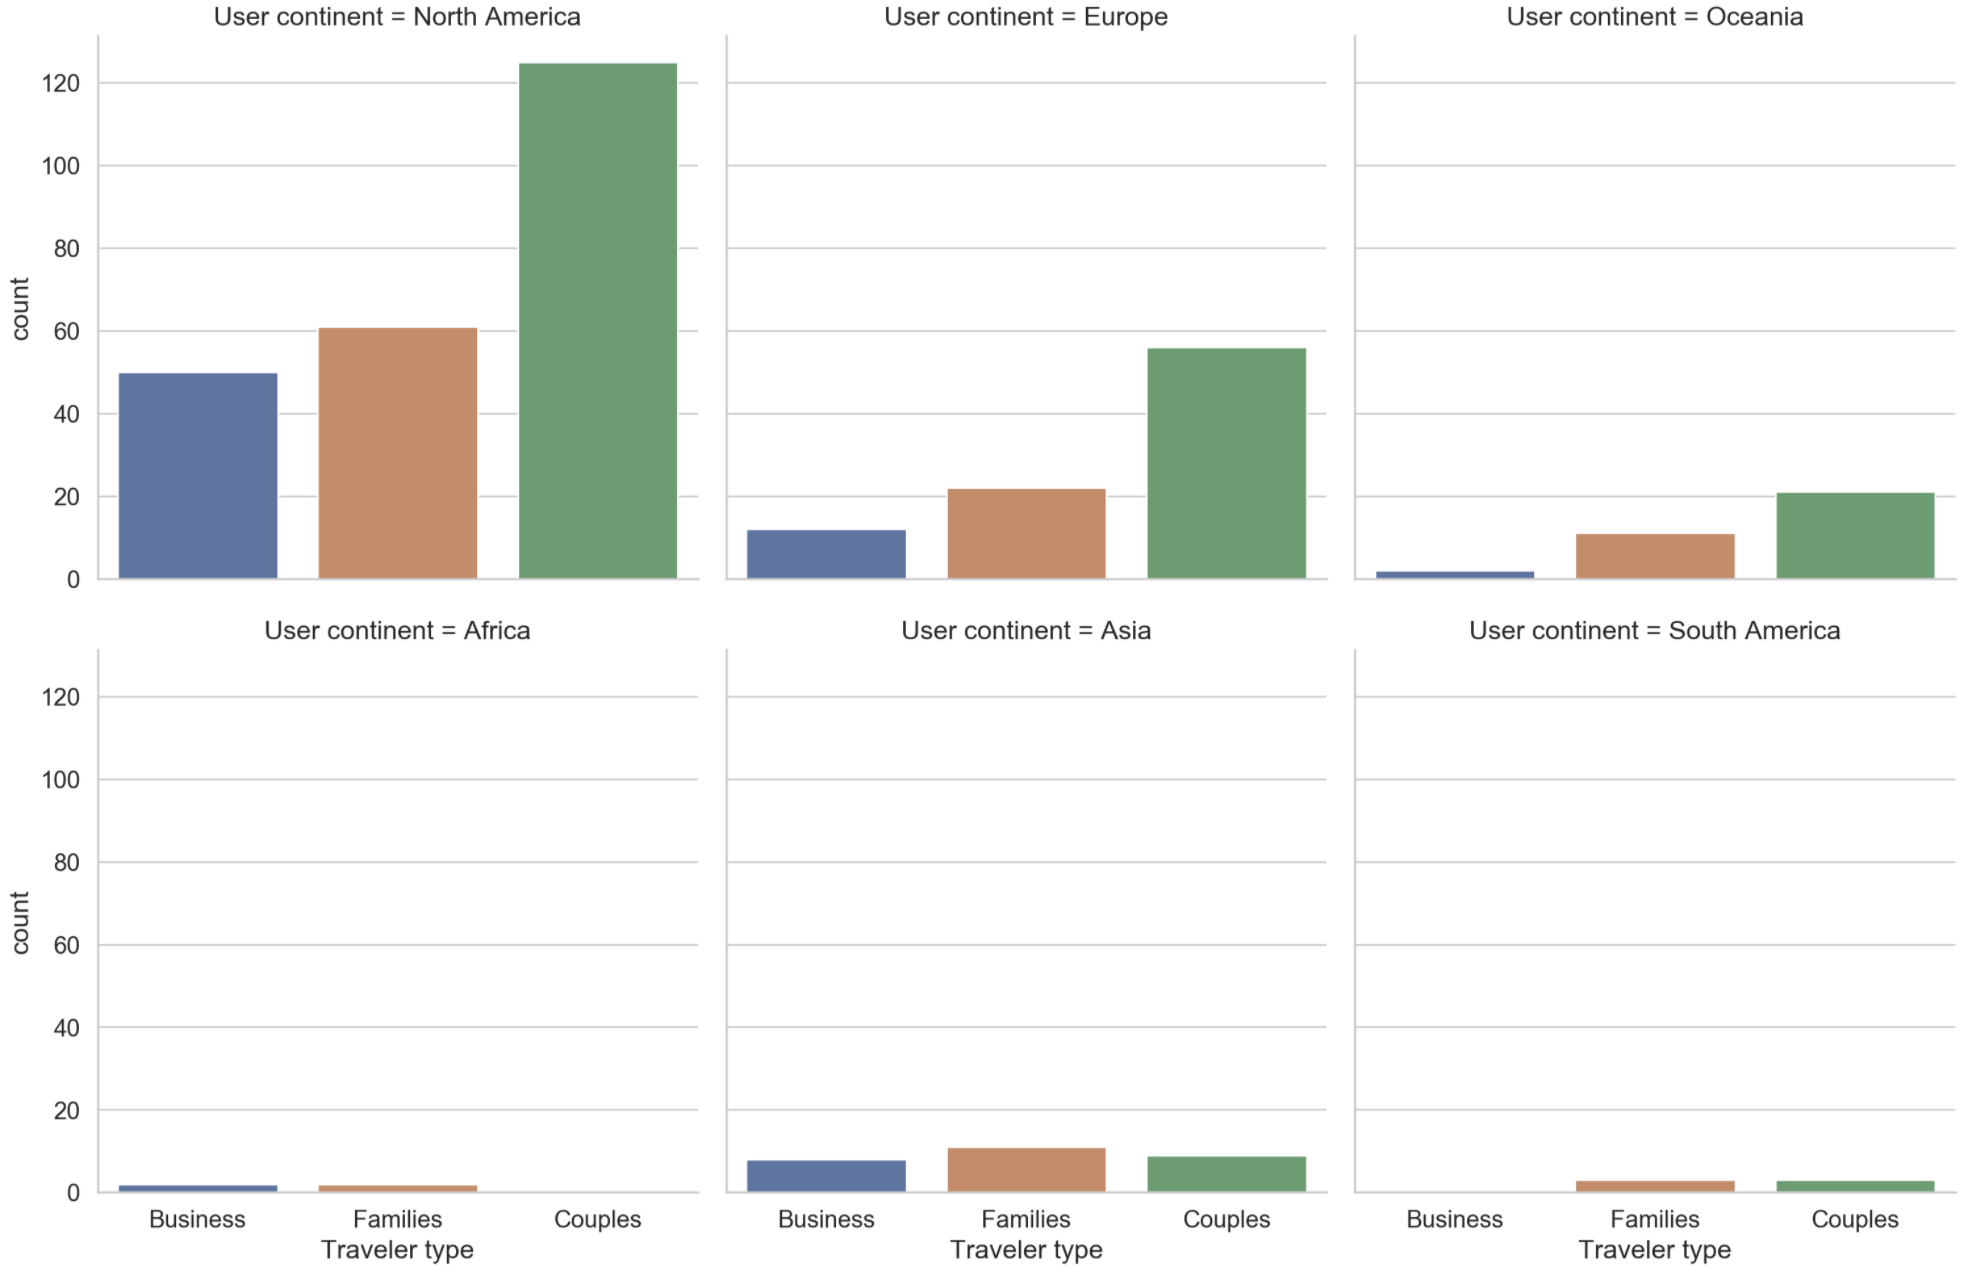
Usando o facetgrid do catplot()
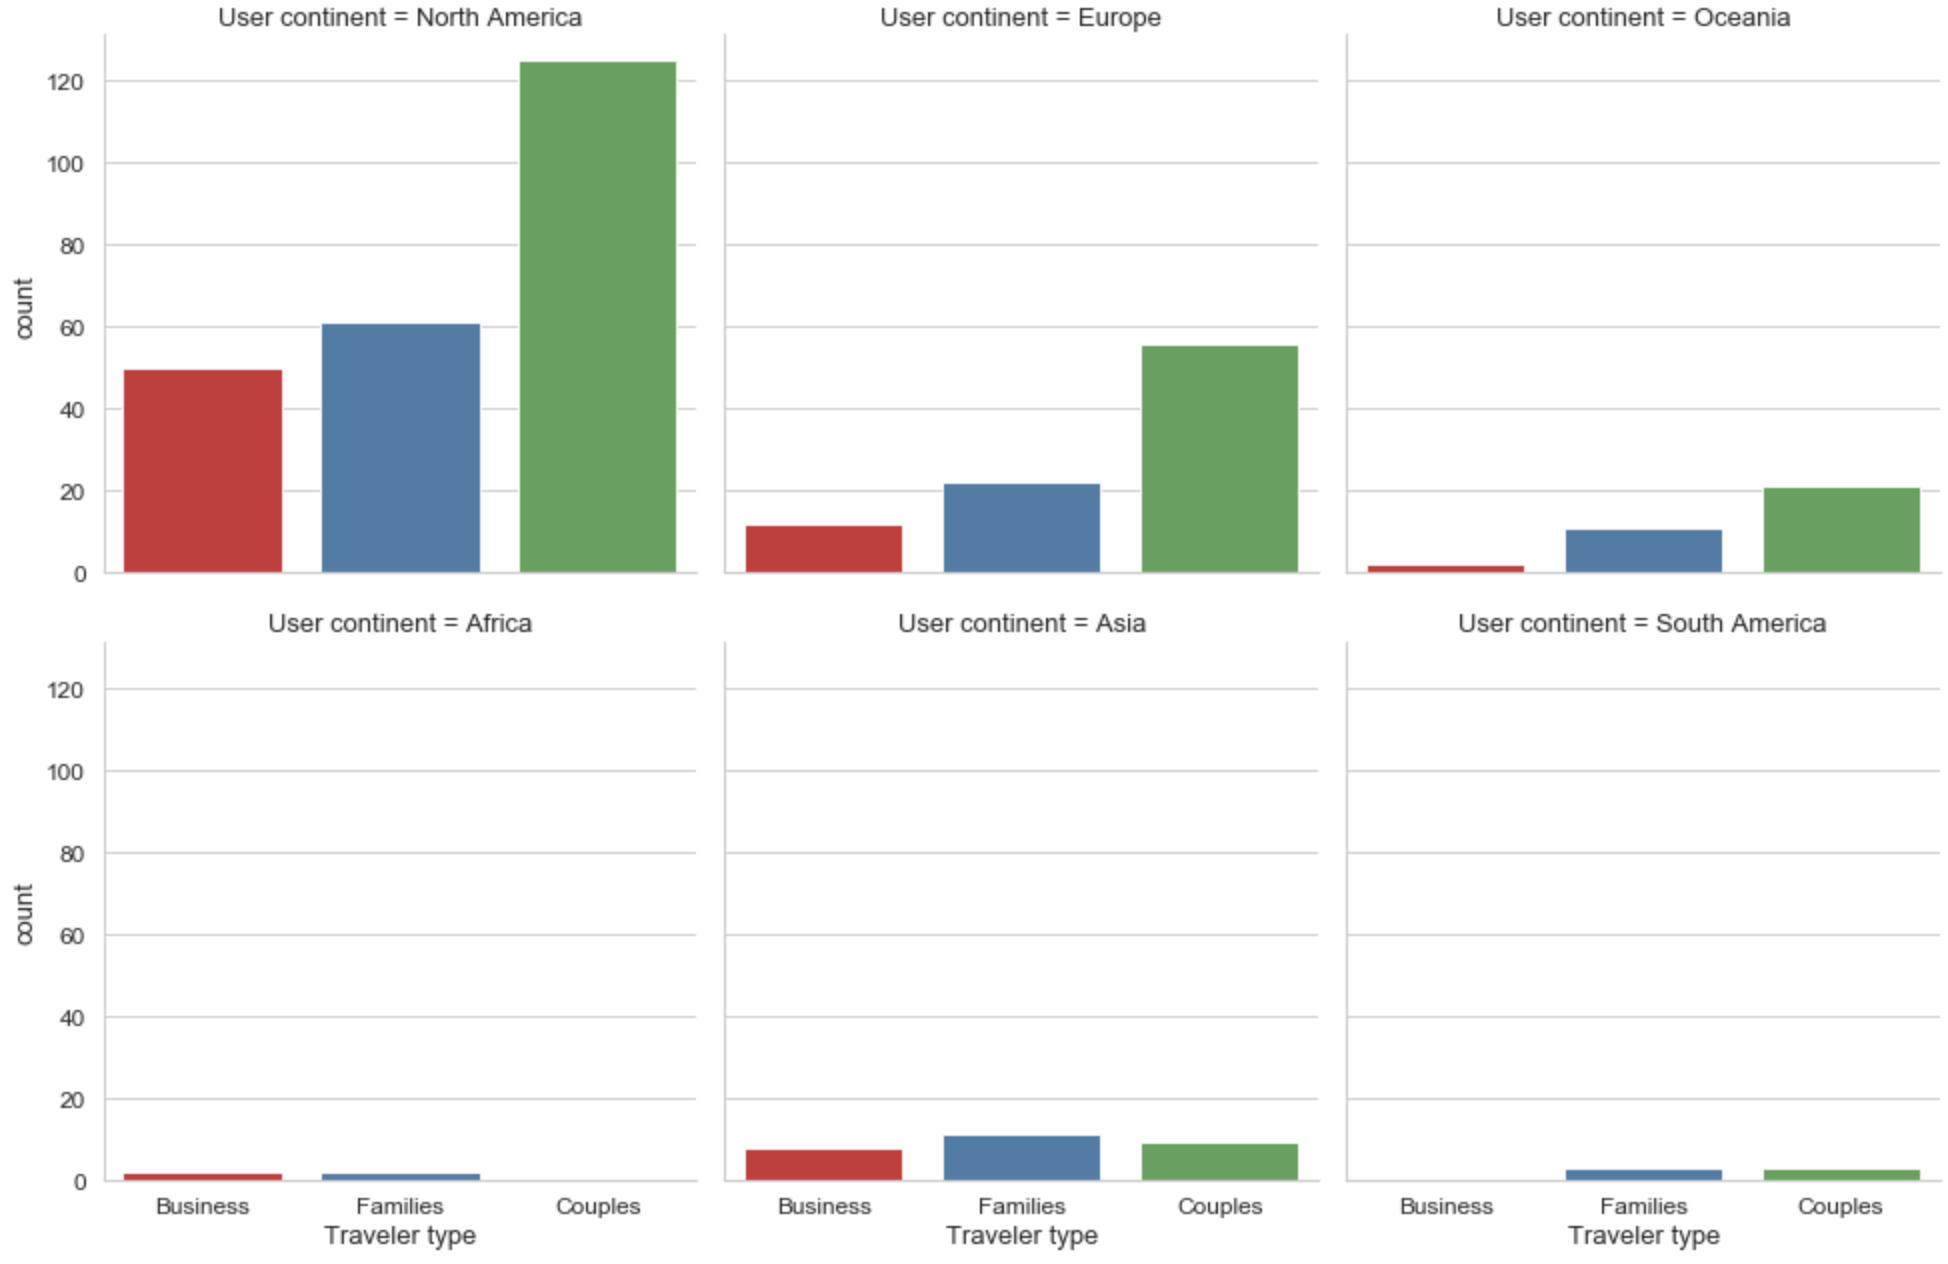
Mais um olhar
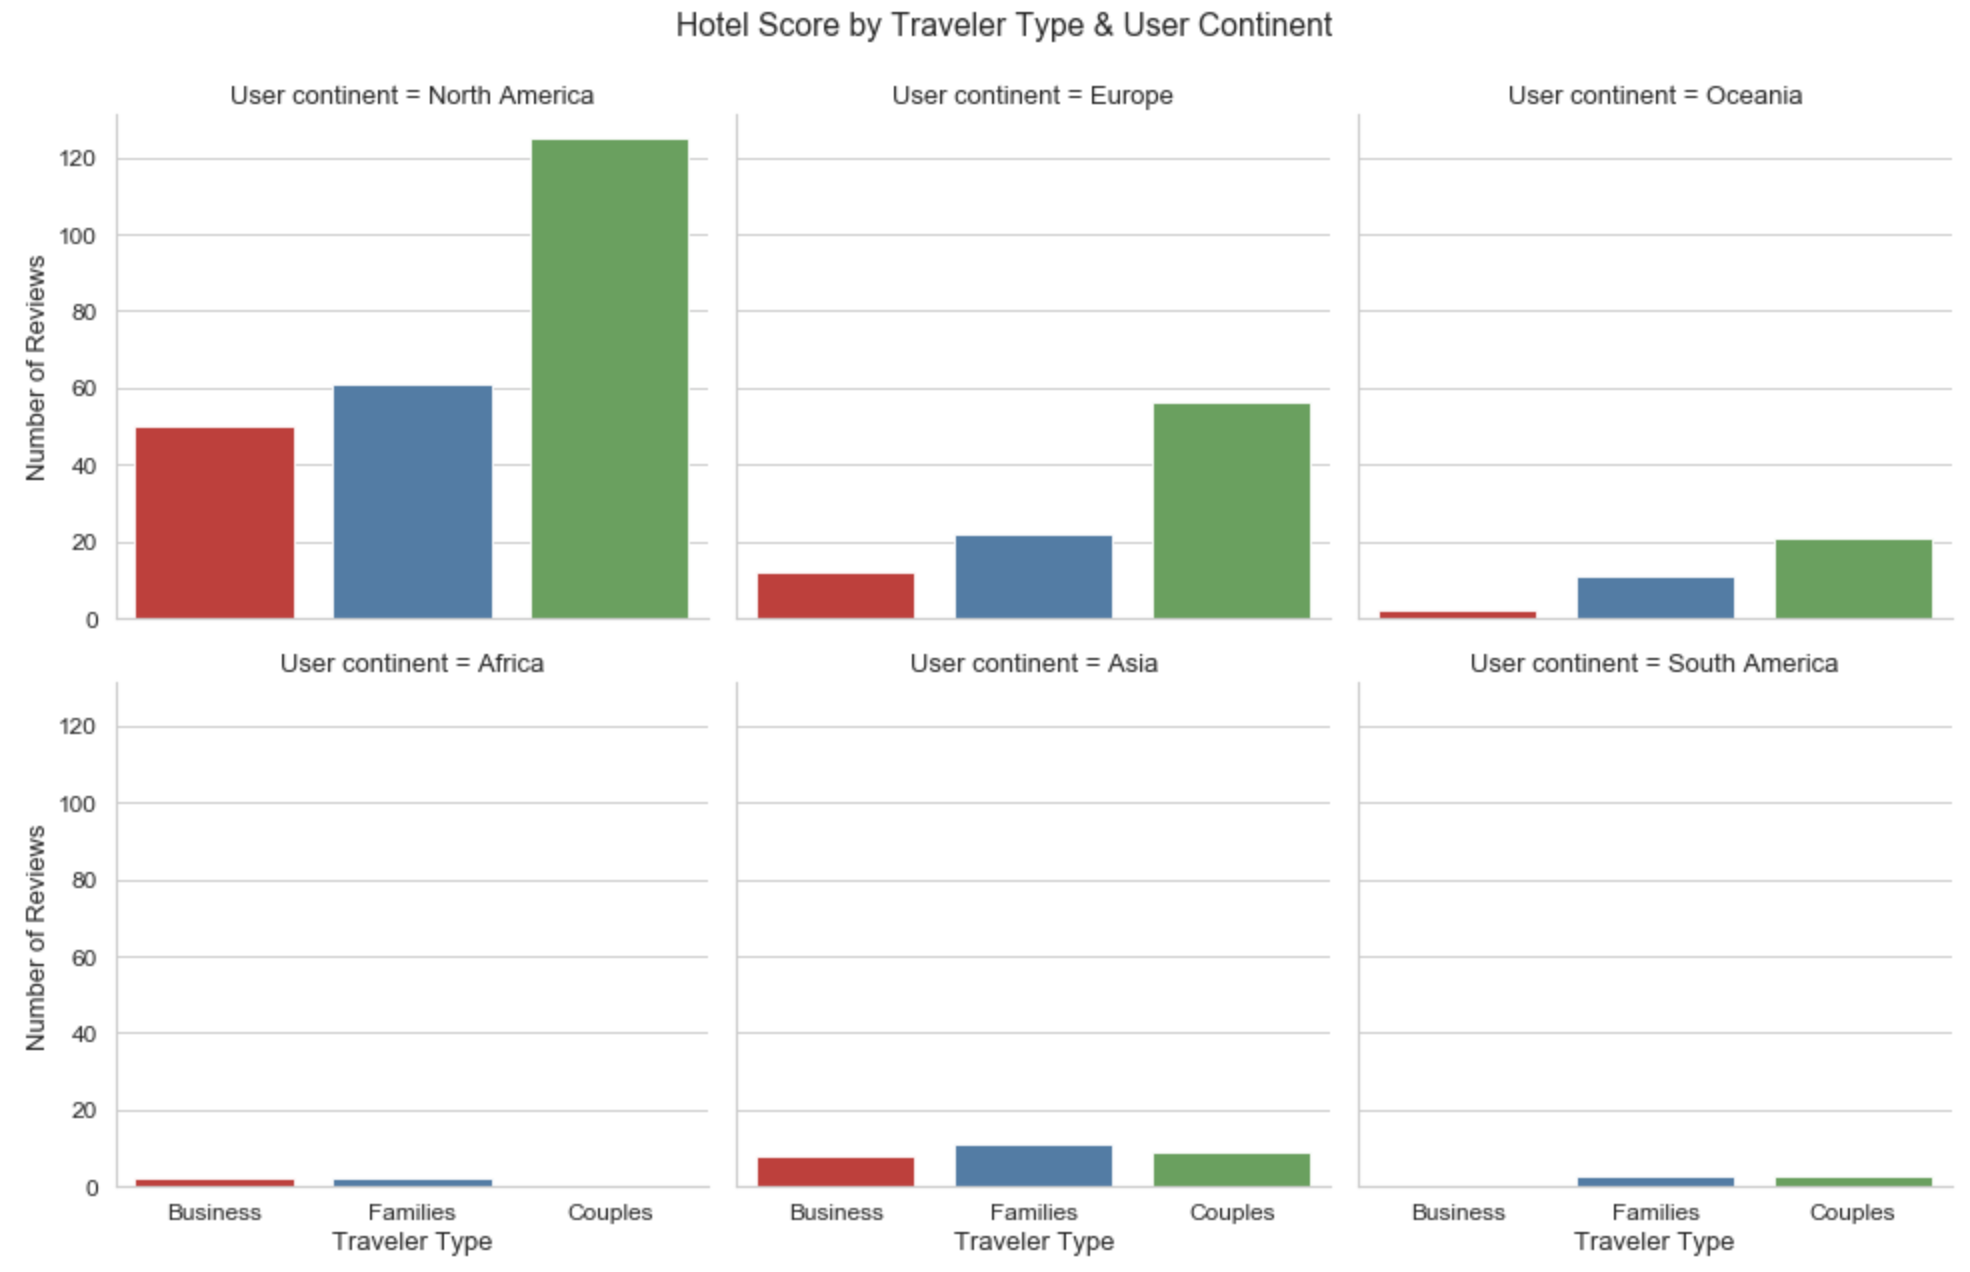
Produto final
Trabalhando com dados categóricos em Python
Kasey Jones
Research Data Scientist

