Introdução aos principais influenciadores
Análise de Tendências no Power BI

Maarten Van den Broeck
Content Developer at DataCamp
O que são “principais influenciadores”?
O que são “principais influenciadores”?
Visualização de influenciadores
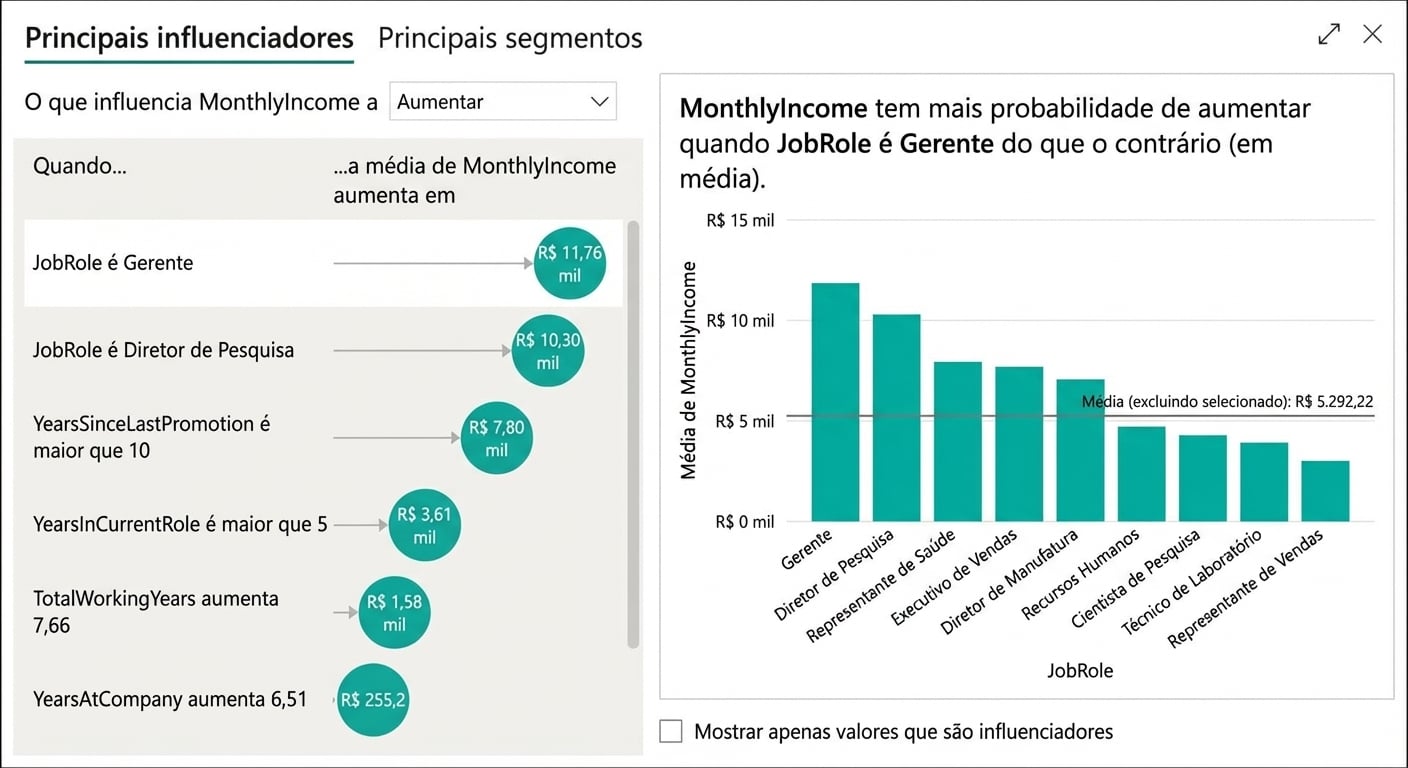
Visualização de influenciadores

