Starting to explore time series data
Trend Analysis in Power BI

Jacob H. Marquez
Data Scientist at Microsoft
What is a "time series"?
$$
Definition:
A series of data points graphed in chronological order.
Most commonly, it is a sequence taken at successive equally spaced points in time.
Use cases for time series analysis
$$
Use Cases:
- Patterns (e.g. cyclical) in a variable
- Season-specific trends
- Systemic challenges
- Relationships with a target outcome
- Informing a forecasting model
$$
Examples:
- Weather
- Heart rate monitoring
- Quarterly sales
- Interest rates
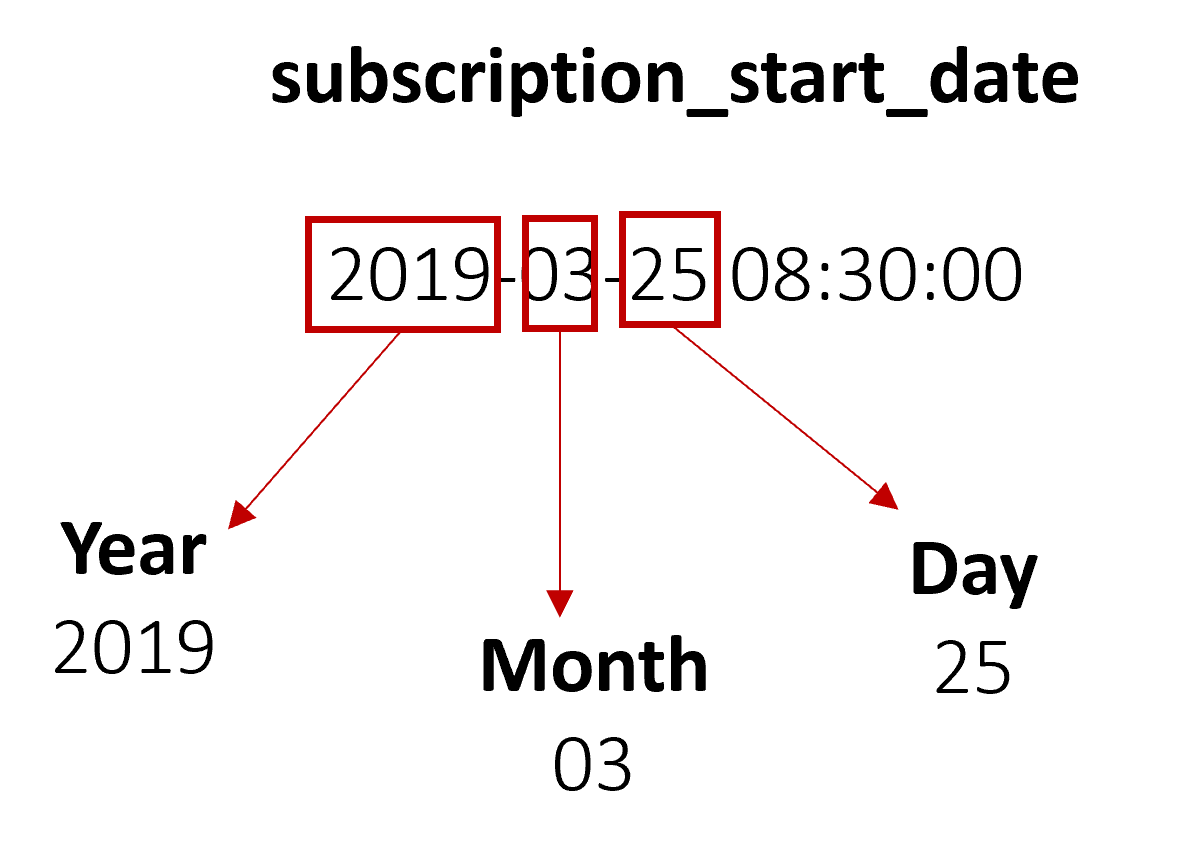
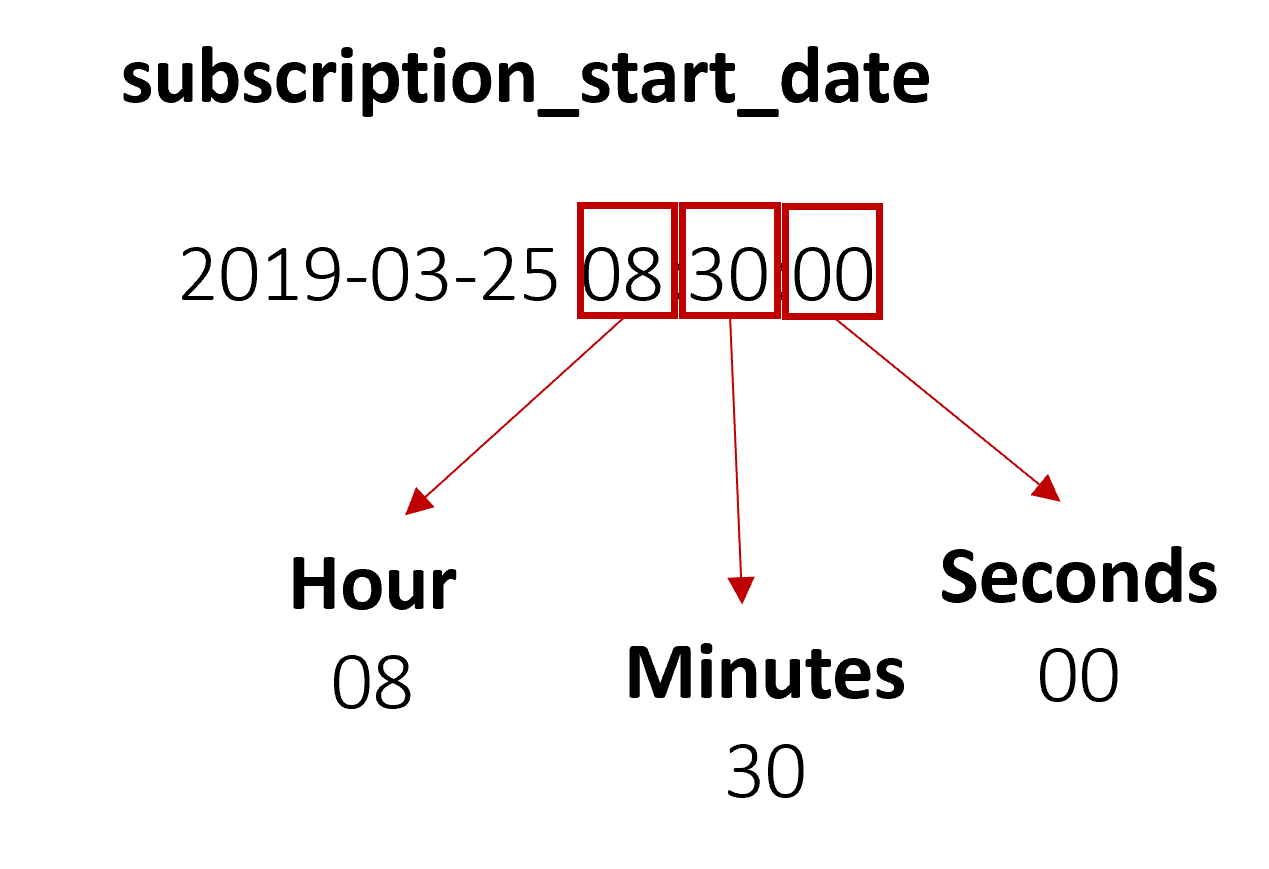
Analyzing at different date grains

Analyzing at different date grains

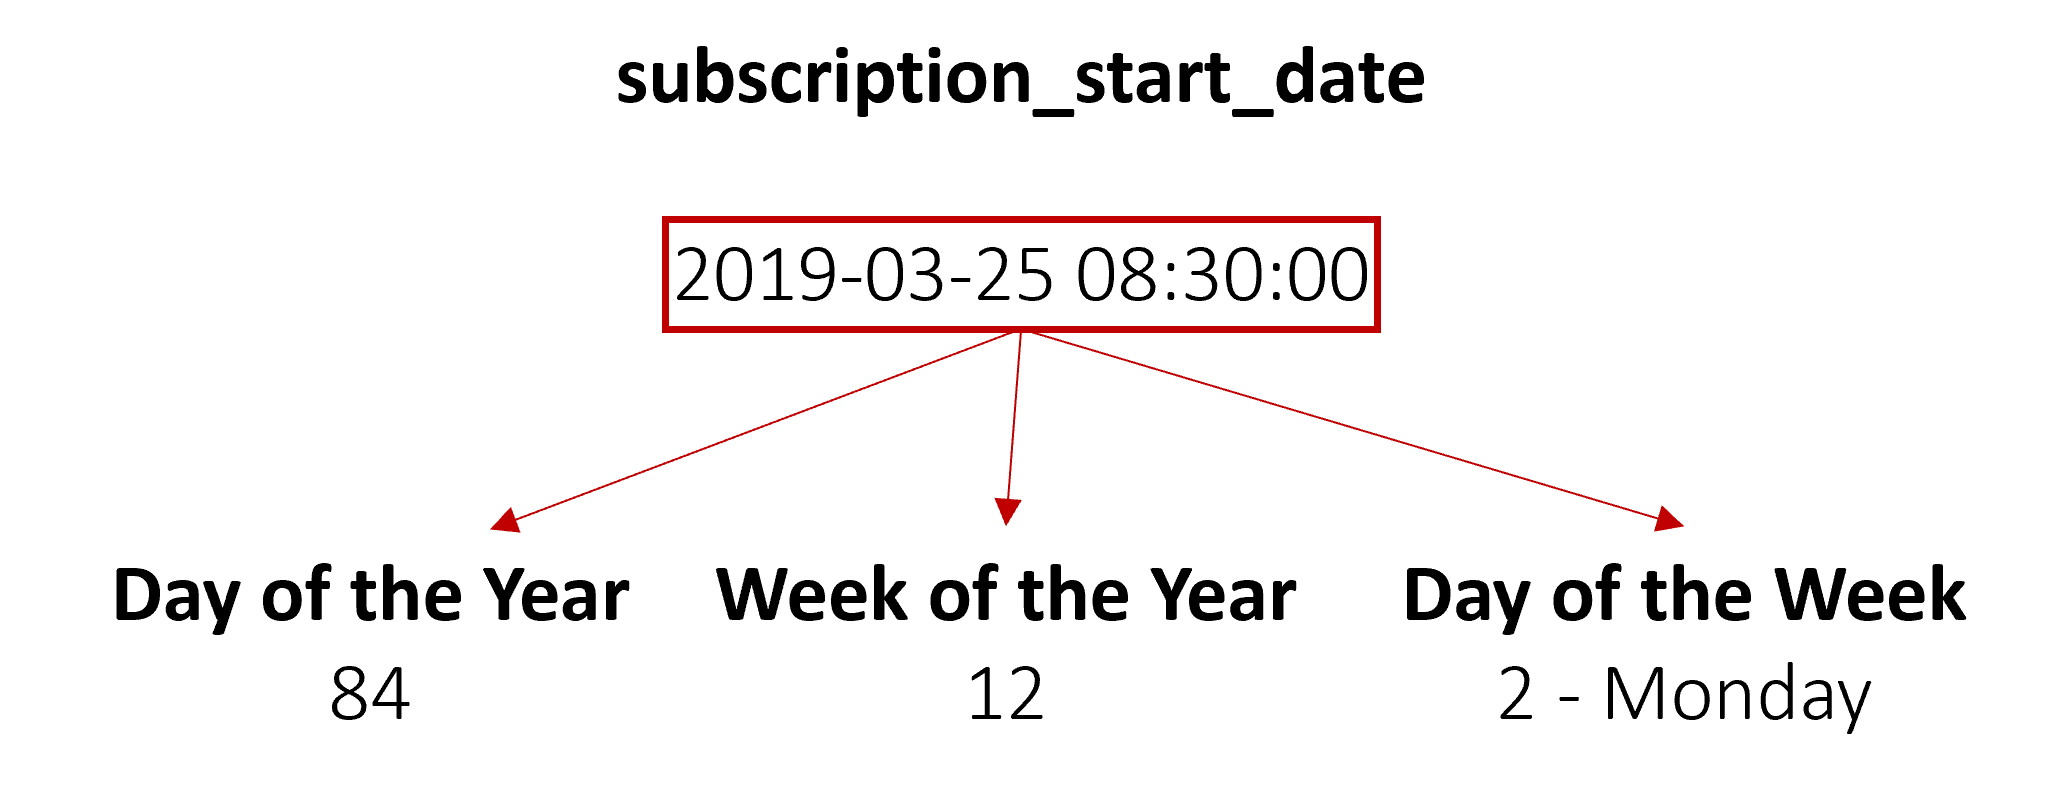
Mutating into different time variables

Mutating into different time variables

Measuring the change over a period of time
Period-over-period change

Measuring the change over a period of time
Period-over-period change

| Month | Stock Price | MoM Change |
|---|---|---|
| Jan 2018 | $20.67 | -- |
| Feb 2018 | $19.79 | -4.3% |
| Mar 2018 | $21.34 | 7.9% |
| Apr 2018 | $21.25 | -0.4% |
| May 2018 | $22.12 | 4.1% |
| Jun 2018 | $22.85 | 3.3% |
DAX functions for dates
DATE(): constructs a date value from parts (e.g. year, month, and day)
LEFT(): extracts a given number of characters from a set of characters, starting from the left side.
RIGHT(): extracts a given number of characters from a set of characters, starting from the right side.
MID(): extracts a given number of characters from a set of characters, starting from a defined place in the set.
WEEKDAY(): returns the day of the week as a number; default is to use the number 1 for Sunday.
Let's practice!
Trend Analysis in Power BI

