Experimental data setup
Experimental Design in Python

James Chapman
Curriculum Manager, DataCamp
The problem with randomization
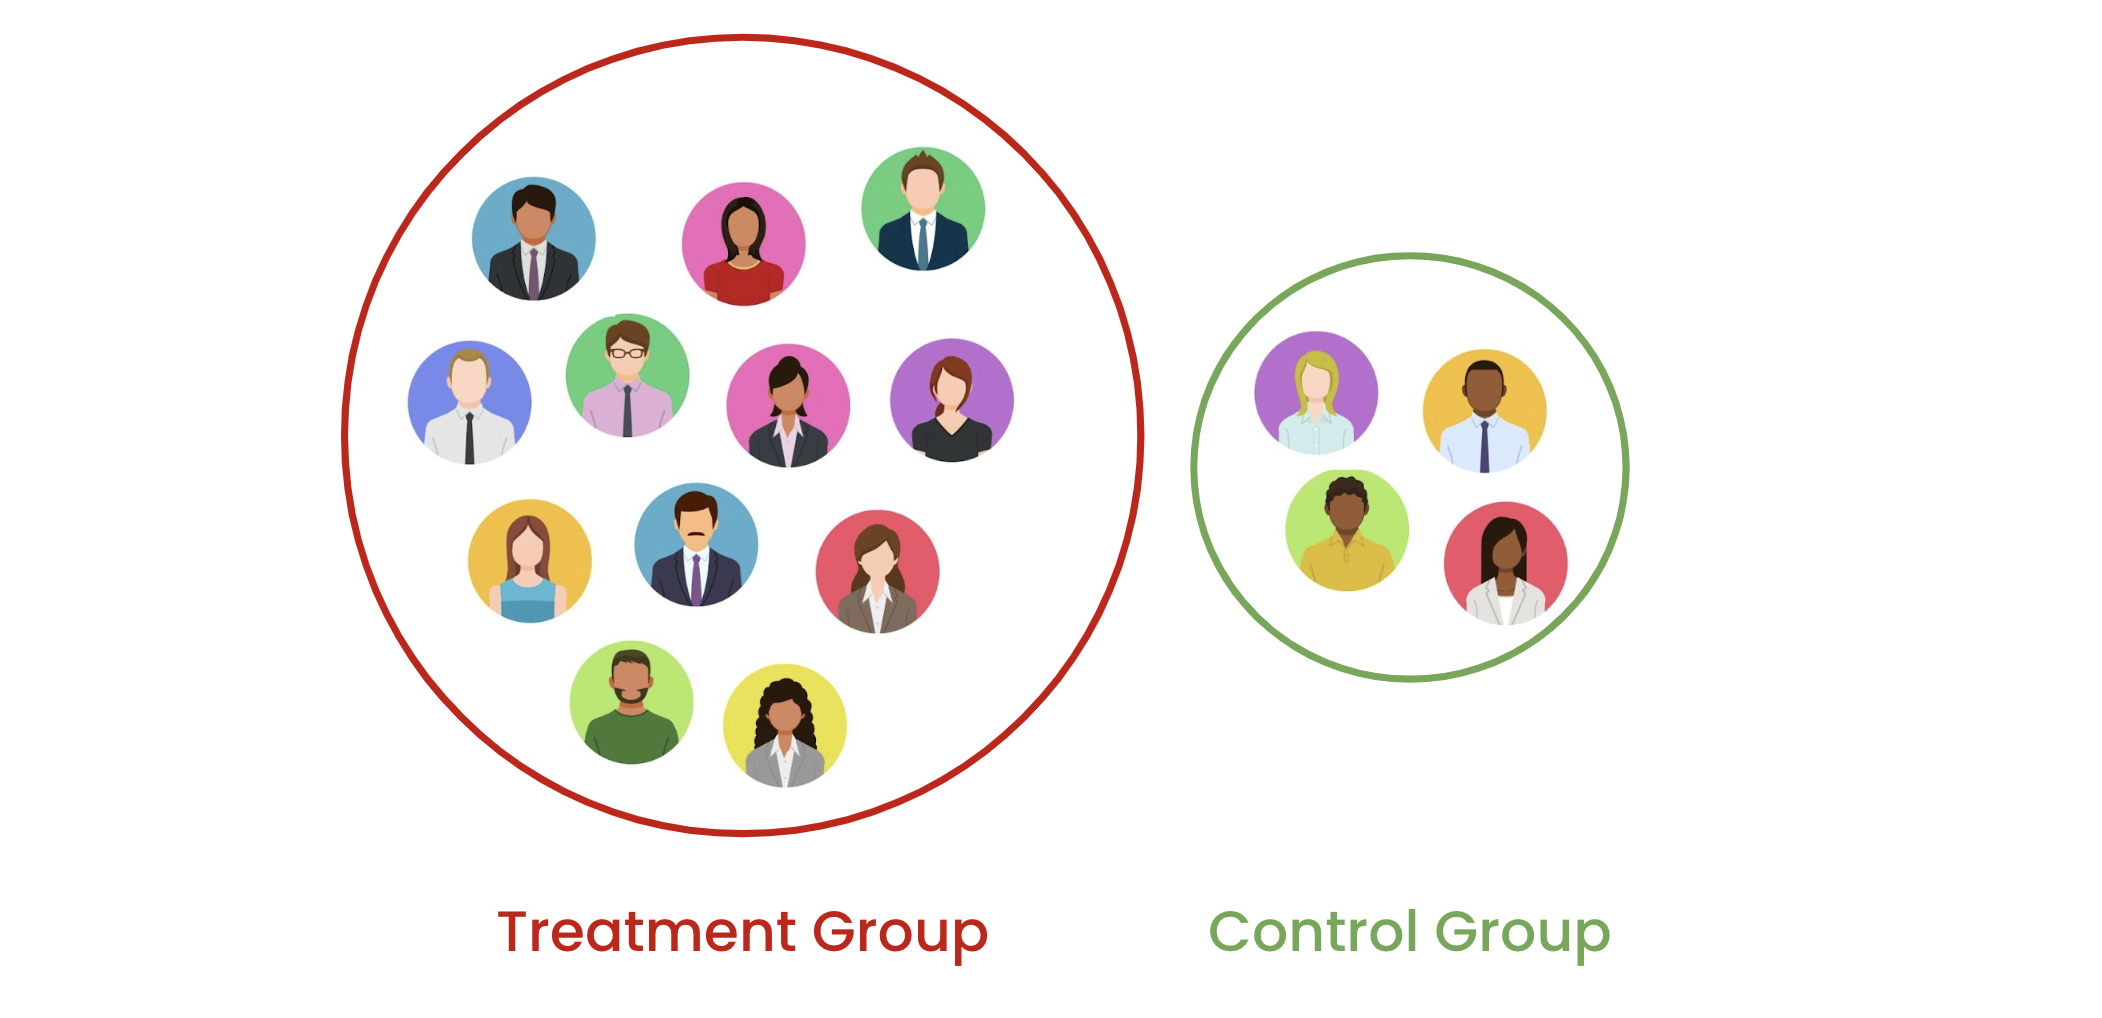
The problem with randomization
Result: harder to measure treatment effect!
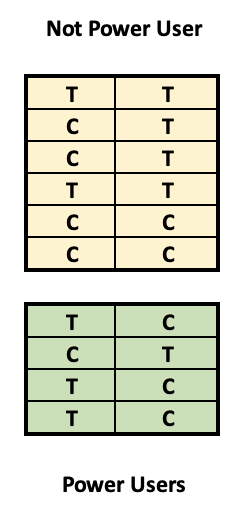
Block randomization
- 24 subjects split into two groups then randomized
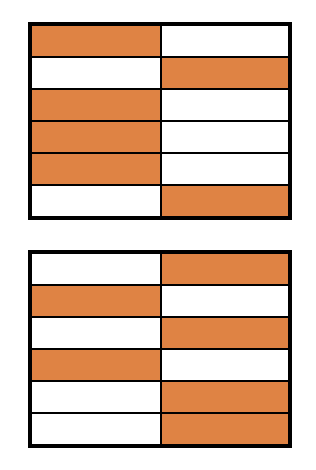
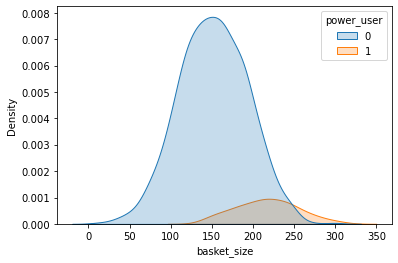
Visualizing splits
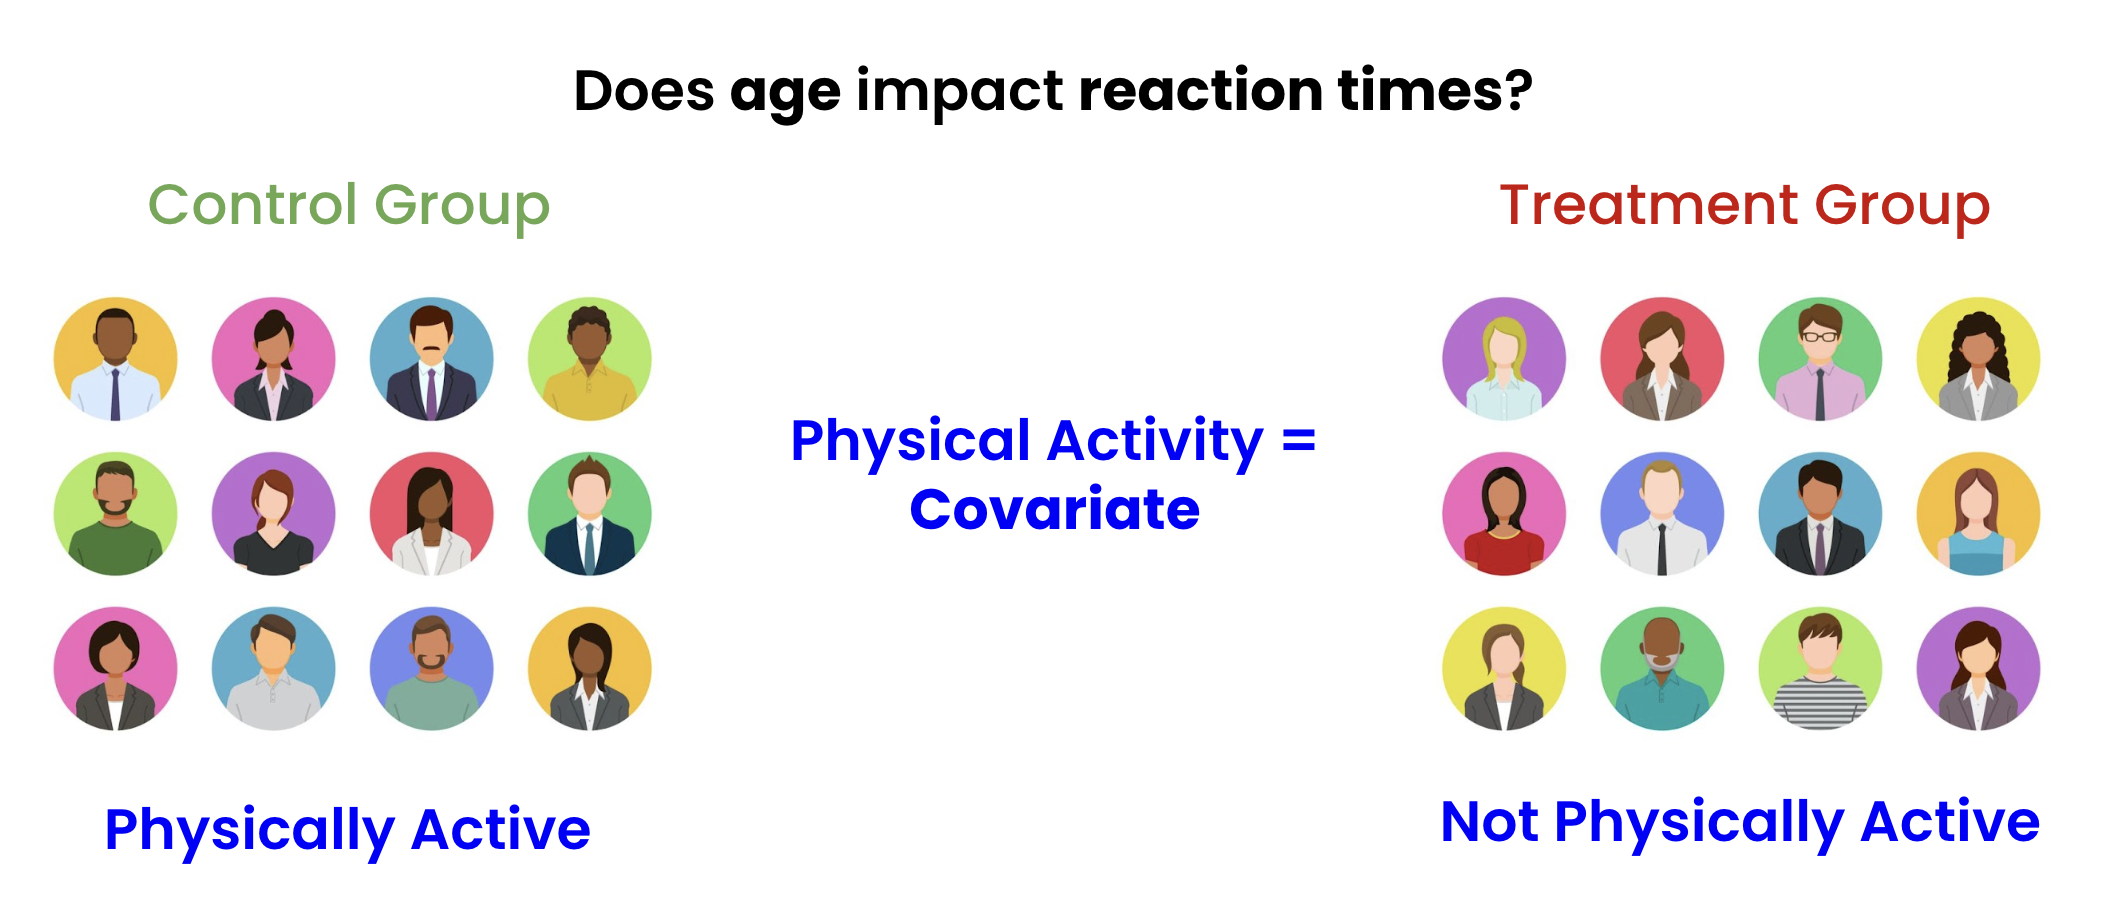
Stratified randomization