Normal data

Experimental Design in Python

James Chapman

Curriculum Manager, DataCamp

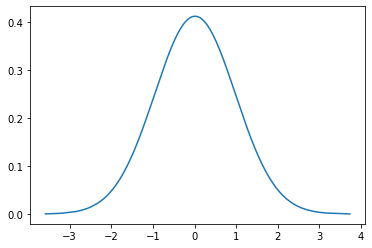
The normal distribution


  • The familiar 'bell curve' shape
  • Related to z-score work

$$ {z} = \frac{x-\mu}{\sigma}$$

  • Mean = 0, std = 1
    • 'How many standard deviations is this point from the mean?'
    • 'What is the probability of obtaining this score?'


A plot of a typical bell curve of data, a blue bell curve line on a white background.

Experimental Design in Python

Normal data and statistical tests


  • Required for parametric tests
  • Nonparametric tests: don't assume normal data


A plot of a typical bell curve of data, a blue bell curve line on a white background.

Experimental Design in Python

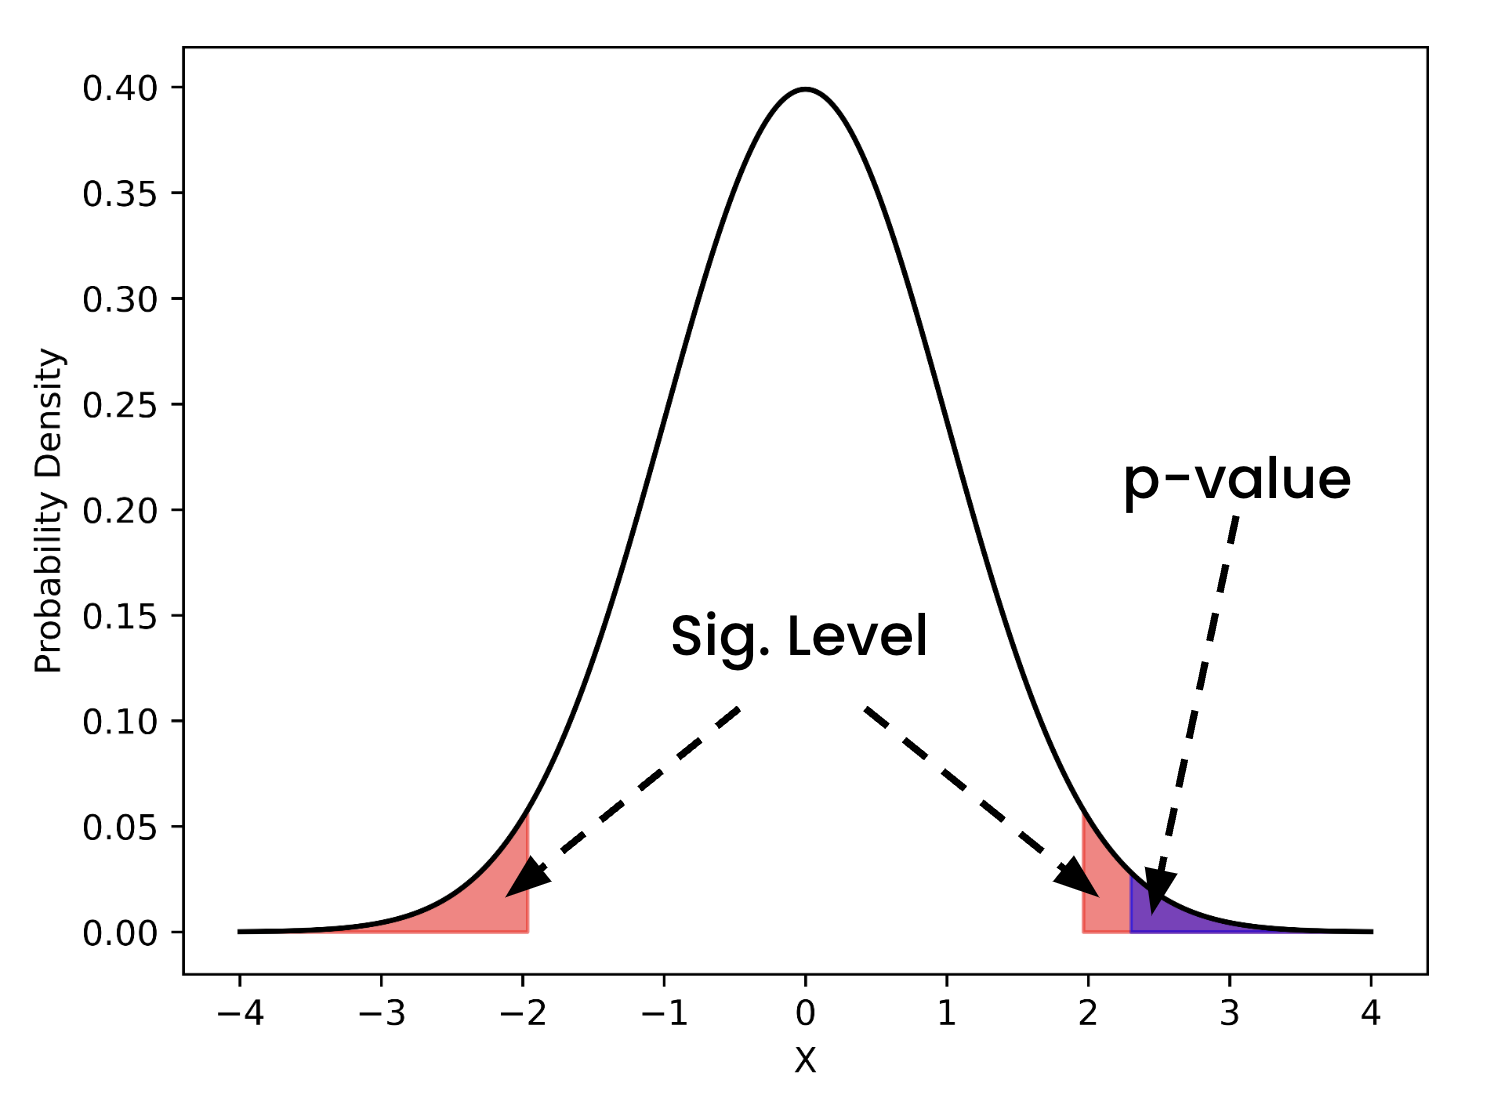
Normal, Z, and alpha


  • Crucial link to significance level ($\alpha$)
  • Compare p-value to $\alpha$
  • Probability of a Type I error


A normal distribution with two small areas at each tail filled in black

Experimental Design in Python

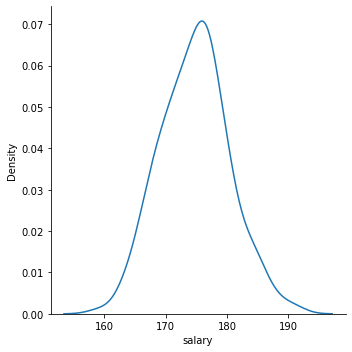
Visualizing normal data
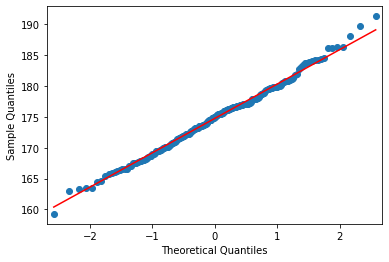
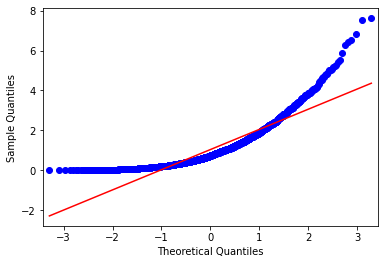
 

sns.displot(data=salaries,
            x='salary',
            kind="kde")
plt.show()


A bell curve distribution that is taller and less wide than a traditional one, but still with the typical bell curve shape

Experimental Design in Python

QQ plots

QQ plot: compare data to a particular distribution

from statsmodels.graphics.gofplots import qqplot
from scipy.stats.distributions import norm
qqplot(salaries['salary'], 
       line='s', 
       dist=norm)
plt.show()
  • Ideal: dots hugging line
  • Bad: bow out at ends


A qq plot where all the dots are mostly hugging the middle 45-degree line closely

A qq plot where the dots in the middle of the 45-degree line hug the line closely but at both ends the dots bow inwards making a curved line from the dots

Experimental Design in Python

Tests for normality


  • Shapiro-Wilk (good for smaller datasets)
  • D'Agostino $K^2$ (uses kurtosis and skewness)
  • Anderson-Darling (returns list of values)


$H_0$ = "Data is drawn from a Normal Distribution"

Experimental Design in Python

A Shapiro-Wilk test


from scipy.stats import shapiro
alpha = 0.05

stat, p = shapiro(salaries['salary']) print(f"p: {round(p,4)} test stat: {round(stat,4)}")
p: 0.8293 test stat: 0.9956
  • p > alpha
    • Fail to reject $H_0$ → likely normal
Experimental Design in Python

An Anderson-Darling test

from scipy.stats import anderson
result = anderson(x=salaries['salary'], dist="norm")
print(round(result.statistic,4))
print(result.significance_level)
print(result.critical_values)
0.2748
[15.  10.   5.   2.5  1. ]
[0.572 0.651 0.781 0.911 1.084]
  • 0.2748 < [0.572 0.651 0.781 0.911 1.084]
    • Fail to reject $H_0$ → likely normal
Experimental Design in Python

Let's practice!

Experimental Design in Python

Preparing Video For Download...