Summarize categorical variables

Importing and Managing Financial Data in Python

Stefan Jansen

Instructor

From categorical to quantitative variables

  • So far, we have analyzed quantitative variables
  • Categorical variables require a different approach
  • Concepts like average don't make much sense
  • Instead, we'll rely on their frequency distribution
Importing and Managing Financial Data in Python

Categorical listing information

amex = pd.read_excel('listings.xlsx', sheet_name='amex', 
                     na_values=['n/a'])
amex.info()
RangeIndex: 360 entries, 0 to 359
Data columns (total 7 columns):
 #   Column                 Non-Null Count  Dtype  
 --  ------                 --------------  -----  
 0   Stock Symbol           360 non-null    object 
 1   Company Name           360 non-null    object 
 2   Last Sale              346 non-null    float64
 3   Market Capitalization  360 non-null    float64
 4   IPO Year               105 non-null    float64
 5   Sector                 238 non-null    object 
 6   Industry               238 non-null    object 
dtypes: float64(3), object(4)
Importing and Managing Financial Data in Python

Categorical listing information

amex = amex['Sector'].nunique()
12
  • apply(): call function on each column
  • lambda: "anonymous function", receives each column as argument x
amex.Sector.apply(lambda x: x.nunique())
Stock Symbol             360
Company Name             326
Last Sale                323
Market Capitalization    317
...
Importing and Managing Financial Data in Python

How many observations per sector?

amex['Sector'].value_counts()
Health Care              49 # Mode
Basic Industries         44
Energy                   28
Consumer Services        27
Capital Goods            24
Technology               20
Consumer Non-Durables    13
Finance                  12
Public Utilities         11
Miscellaneous             5
...
Importing and Managing Financial Data in Python

How many IPOs per year?

amex['IPO Year'].value_counts()
2002.0    19 # Mode
2015.0    11
1999.0     9
1993.0     7
2014.0     6
2013.0     5
2017.0     5
...
2009.0     1
1990.0     1
1991.0     1
Name: IPO Year, dtype: int64
Importing and Managing Financial Data in Python

Convert IPO Year to int

ipo_by_yr = amex['IPO Year'].dropna().astype(int).value_counts()
ipo_by_yr
2002    19
2015    11
1999     9
1993     7
2014     6
2004     5
2003     5
2017     5
...
1987     1
Name: IPO Year, dtype: int64
Importing and Managing Financial Data in Python

Convert IPO Year to int

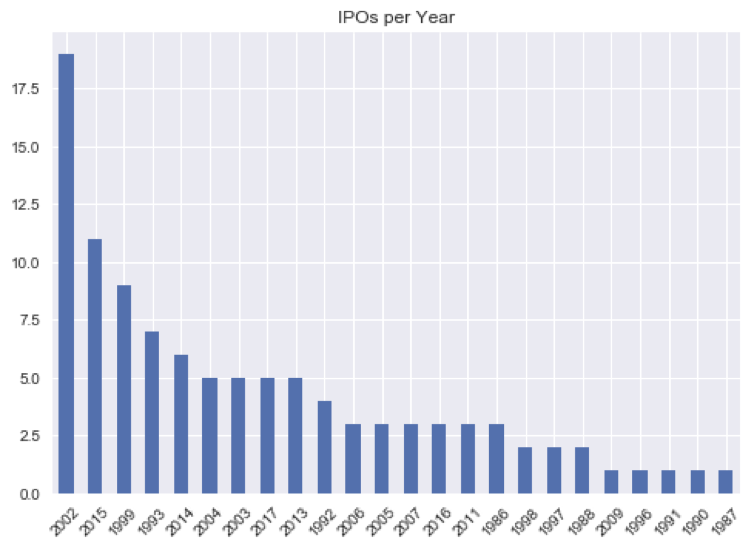
ipo_by_yr.plot(kind='bar', title='IPOs per Year')
plt.xticks(rotation=45)

Bar plot of IPOs per year

Importing and Managing Financial Data in Python

Let's practice!

Importing and Managing Financial Data in Python

Preparing Video For Download...