Visualize the distribution of your data
Importing and Managing Financial Data in Python

Stefan Jansen
Instructor
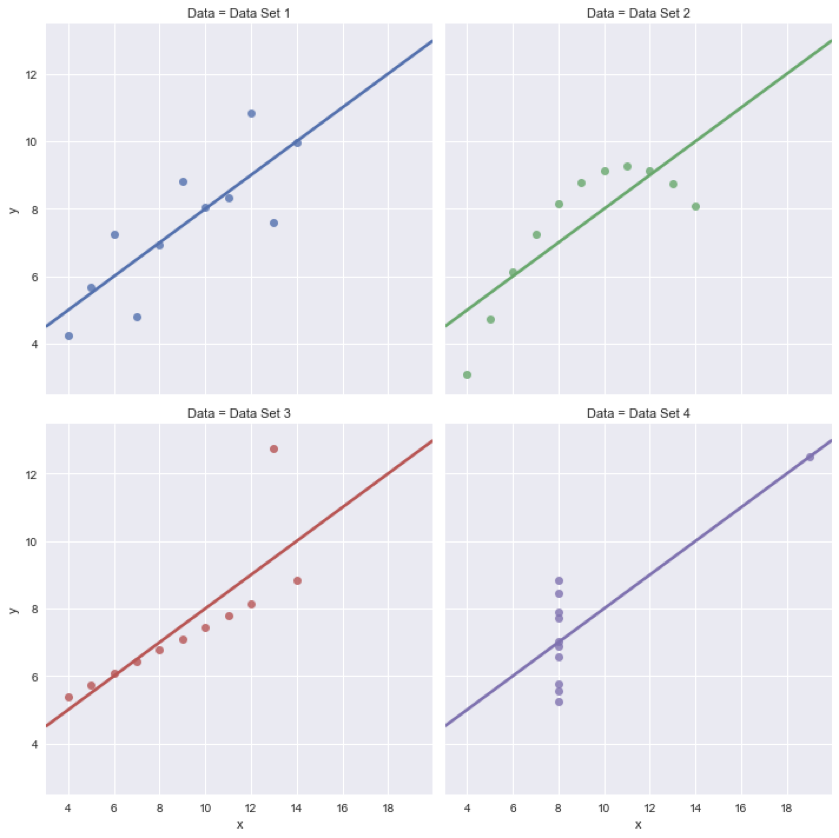
Always look at your data!
- Identical metrics can represent very different data
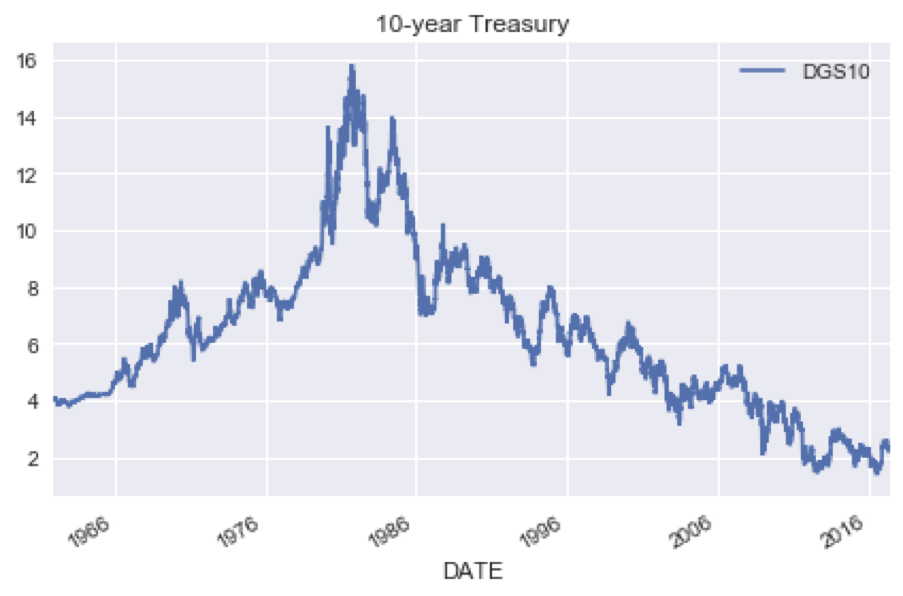
10 year treasury: time series trend
ty10.dropna(inplace=True) # Avoid creation of copyty10.plot(title='10-year Treasury'); plt.tight_layout()
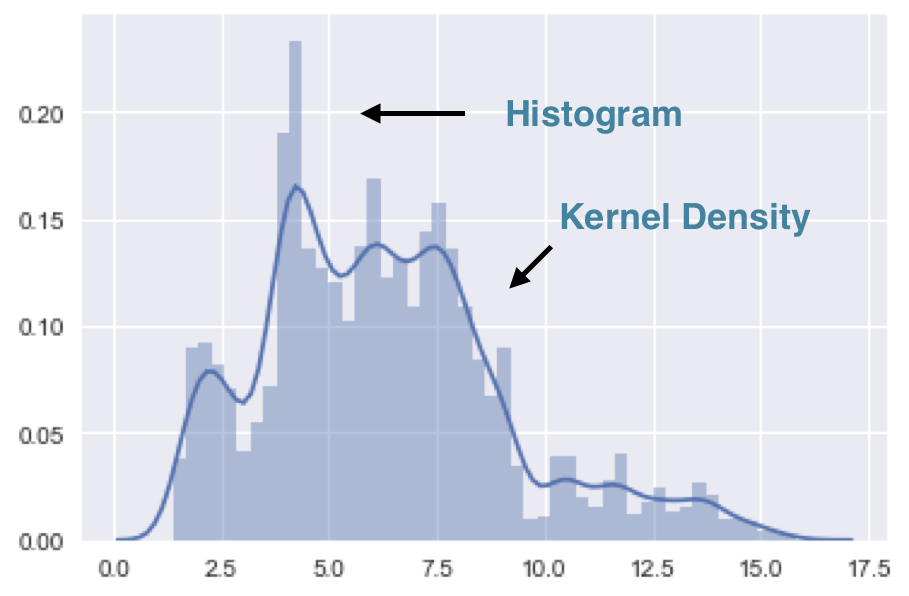
10 year treasury: historical distribution
import seaborn as sns
sns.distplot(ty10)
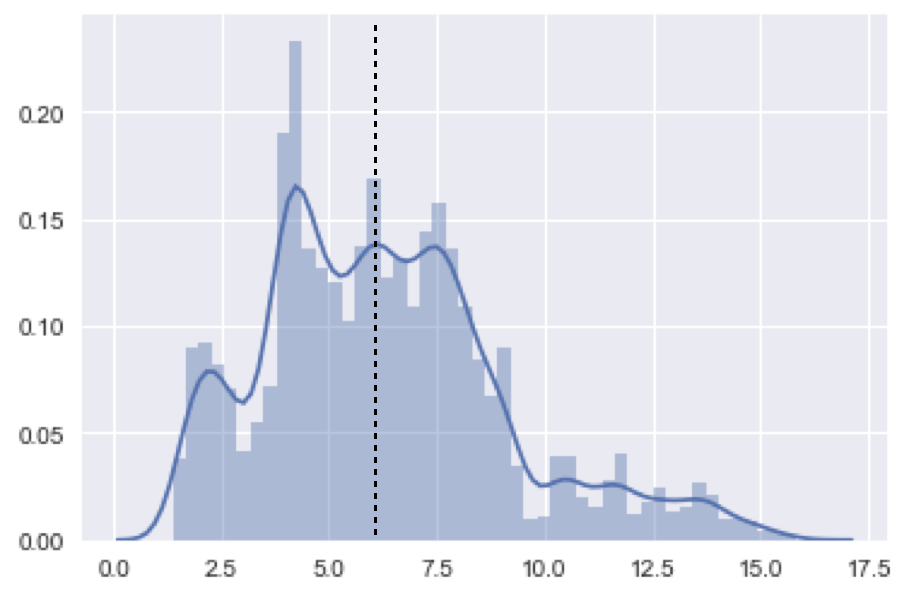
10 year treasury: trend and distribution
ax = sns.distplot(ty10)
ax.axvline(ty10['DGS10'].median(), color='black', ls='--')