Get several stocks & manage a MultiIndex
Importing and Managing Financial Data in Python

Stefan Jansen
Instructor
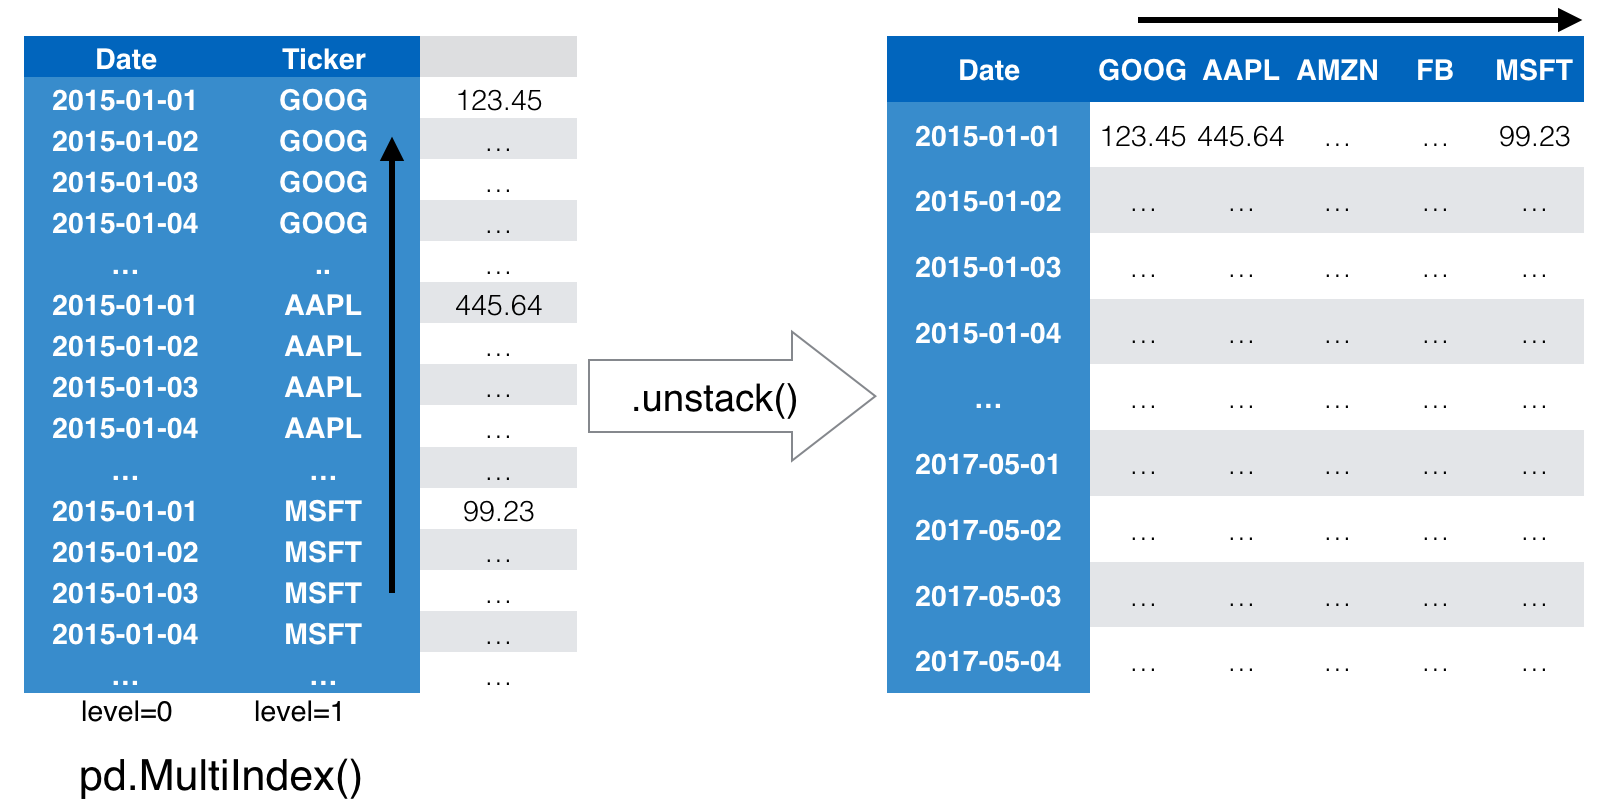
From long to wide format
unstacked = df['Close'].unstack() # Results in DataFrame
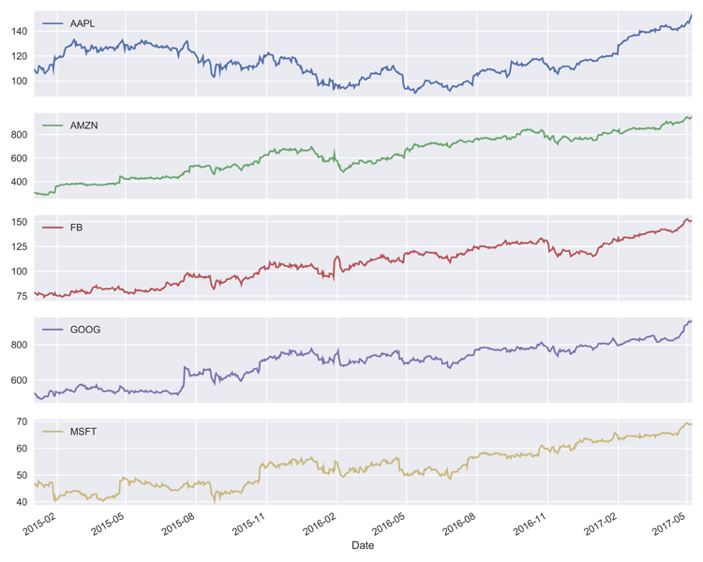
Stock prices: Visualization
Importing and Managing Financial Data in Python
Stefan Jansen
Instructor
unstacked = df['Close'].unstack() # Results in DataFrame

