Introducción a la regresión
Aprendizaje supervisado con scikit-learn

George Boorman
Core Curriculum Manager, DataCamp
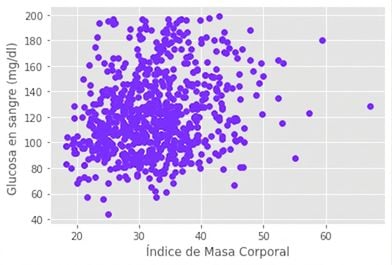
Representación gráfica de la glucosa frente al índice de masa corporal
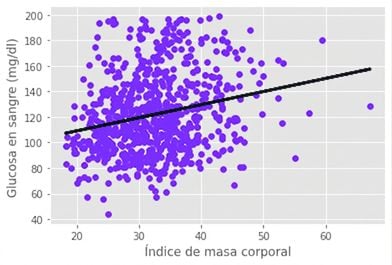
Ajuste de un modelo de regresión
Aprendizaje supervisado con scikit-learn
George Boorman
Core Curriculum Manager, DataCamp

